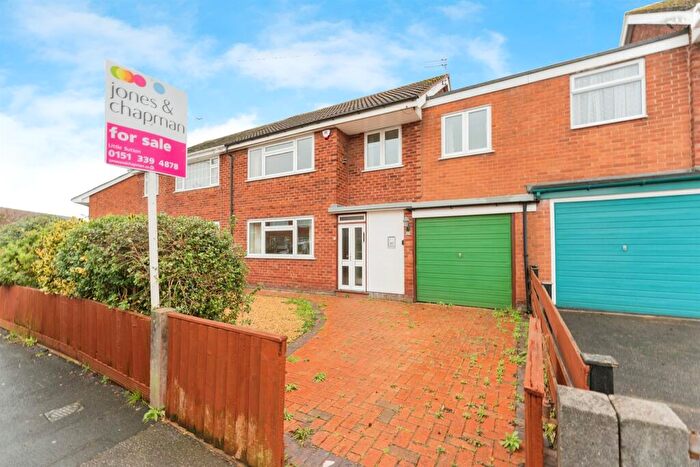
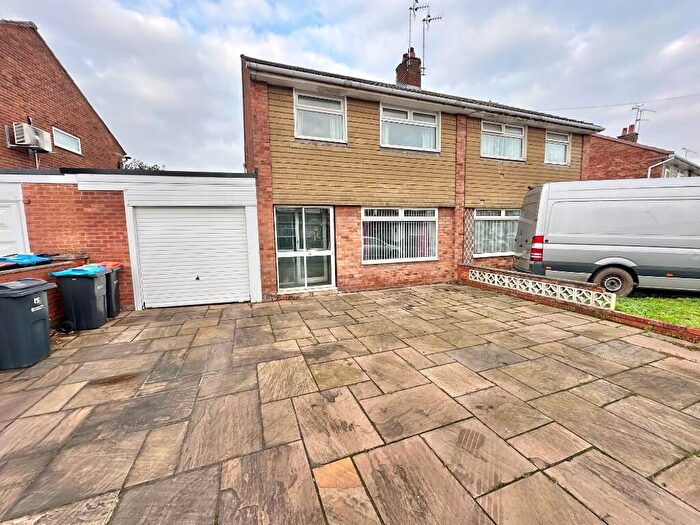
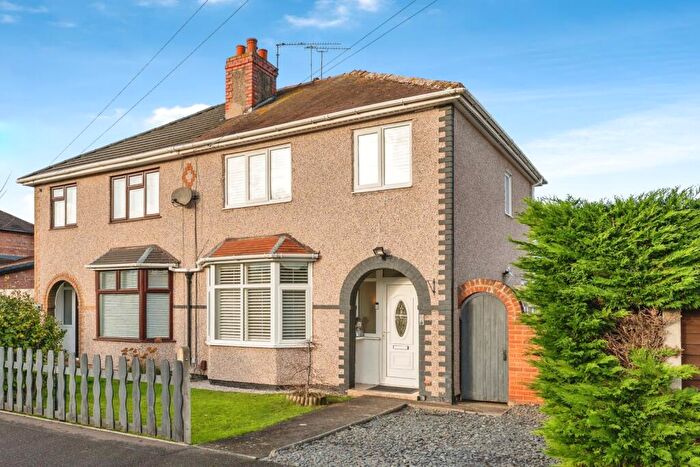
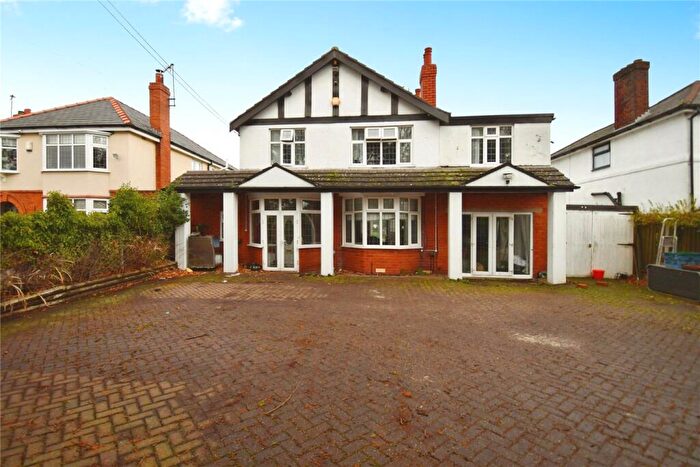
Houses for sale & to rent in Whitby, Ellesmere Port
House Prices in Whitby
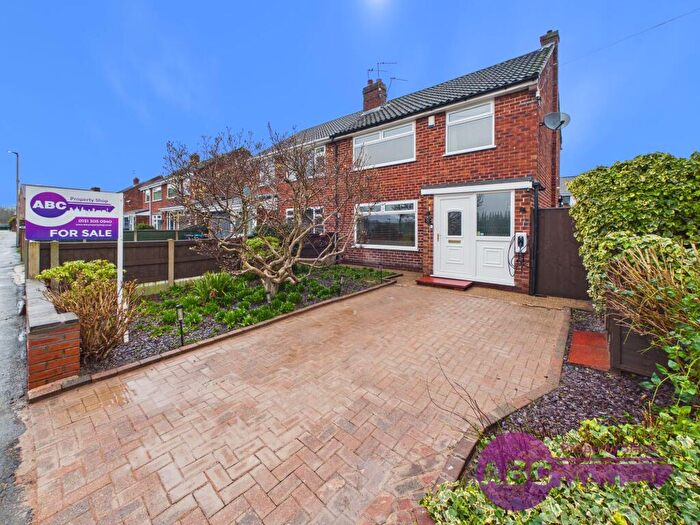
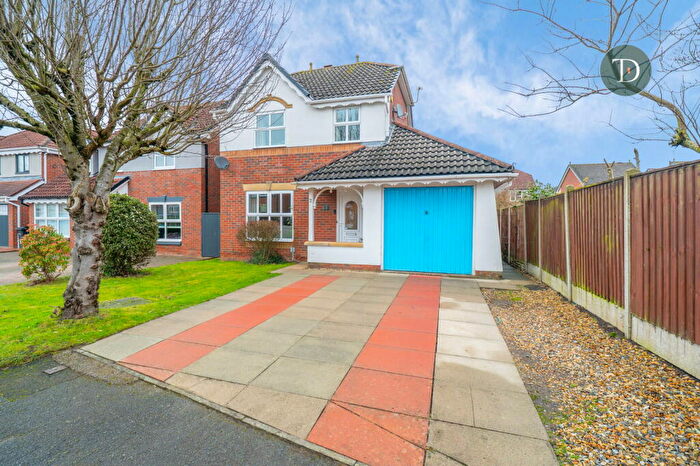
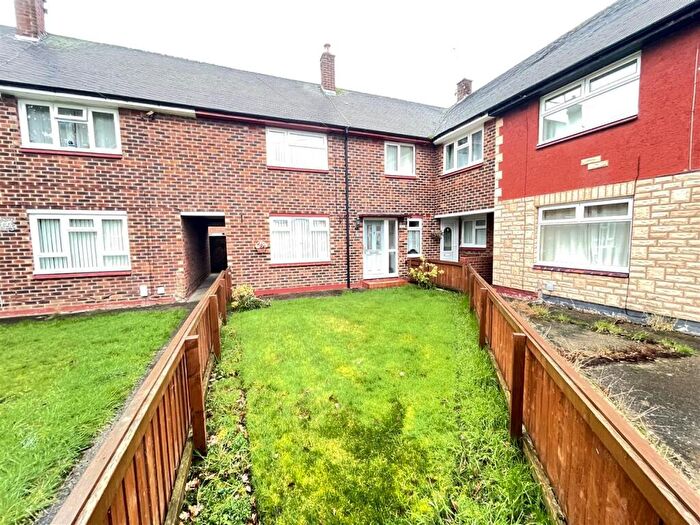
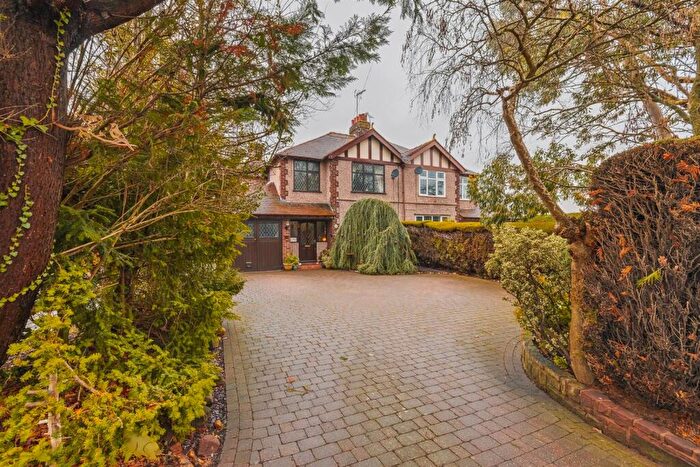
Properties in Whitby have an average house price of £244,771.00 and had 326 Property Transactions within the last 3 years¹.
Whitby is an area in Ellesmere Port, Cheshire with 3,251 households², where the most expensive property was sold for £475,000.00.
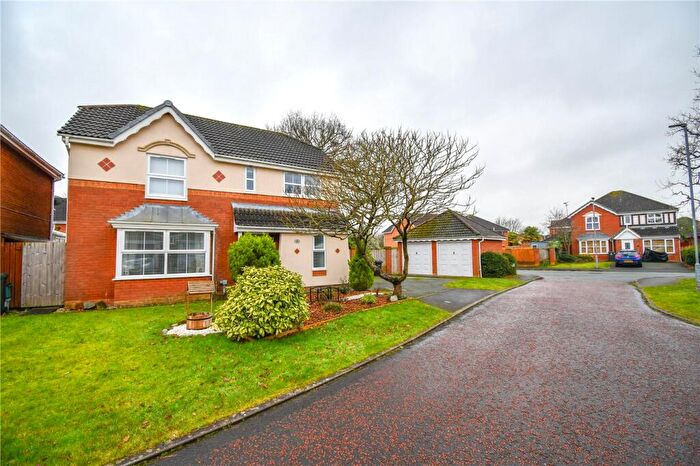
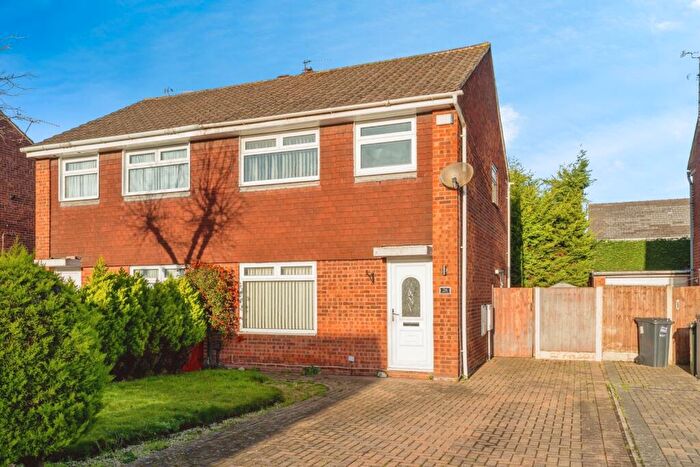
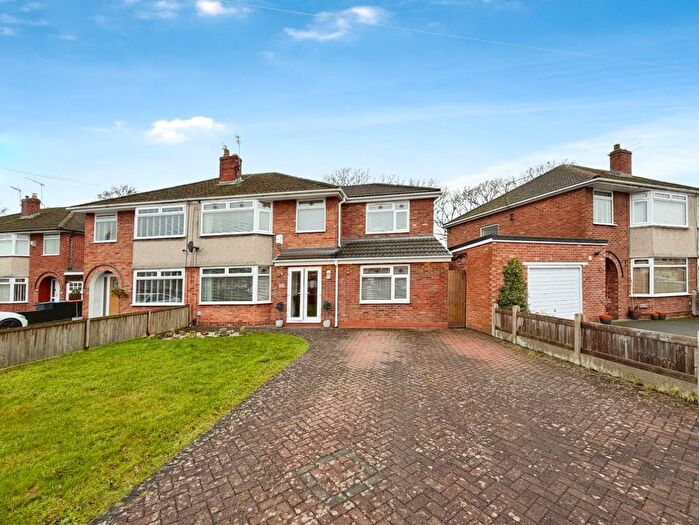
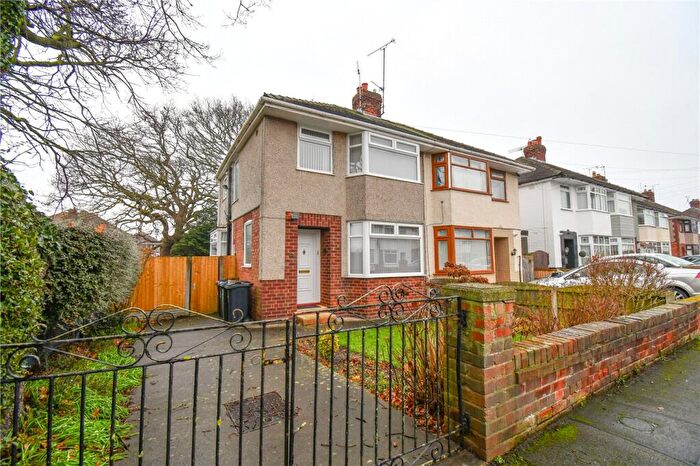
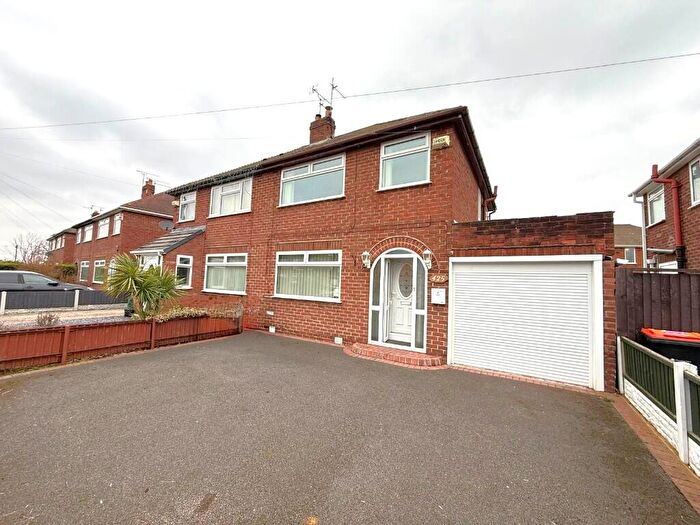
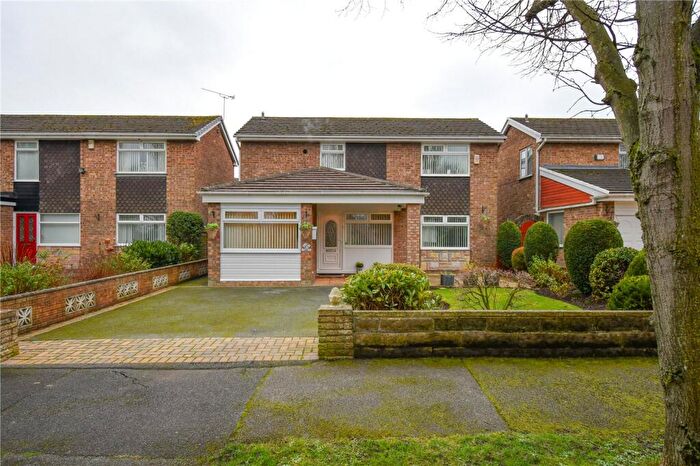
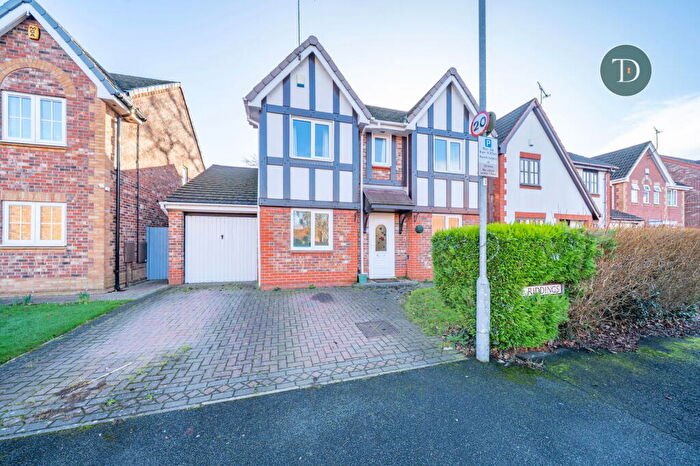
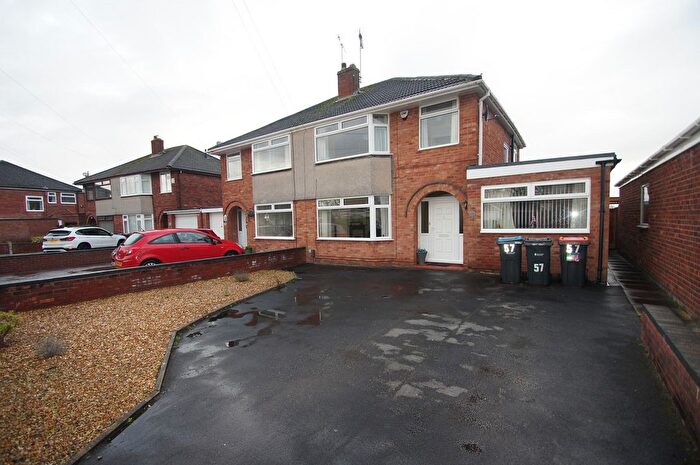
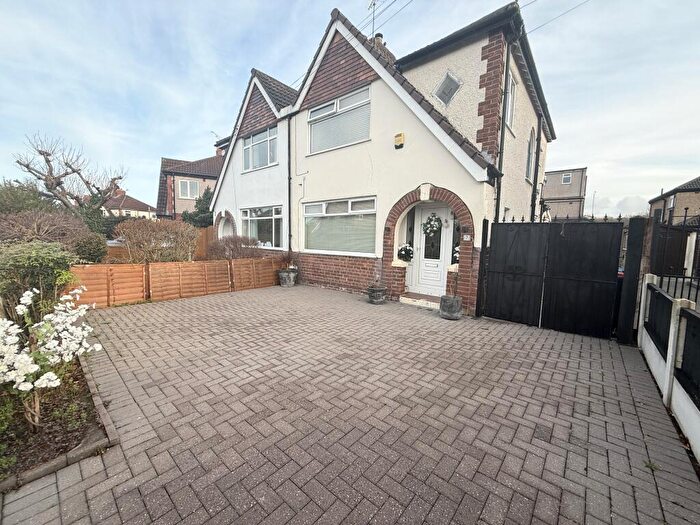
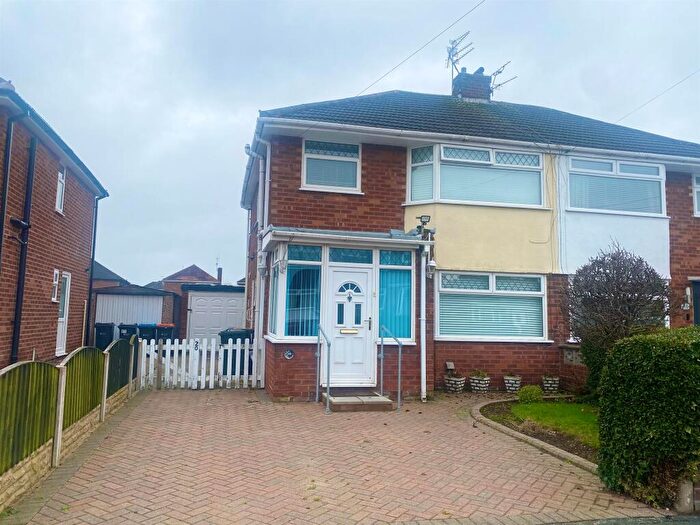
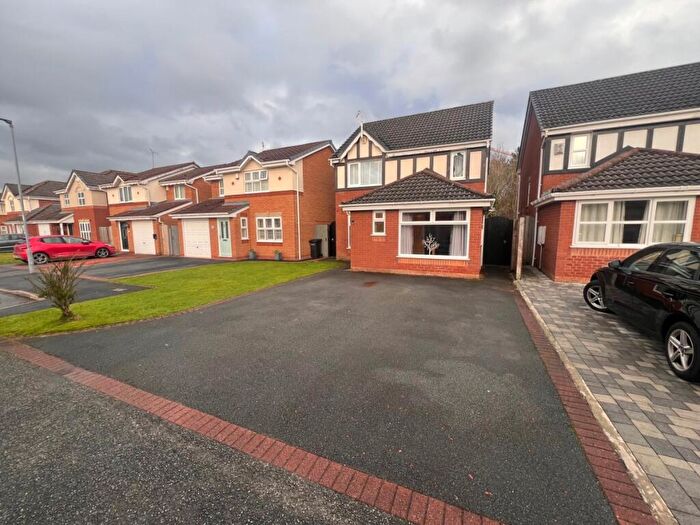
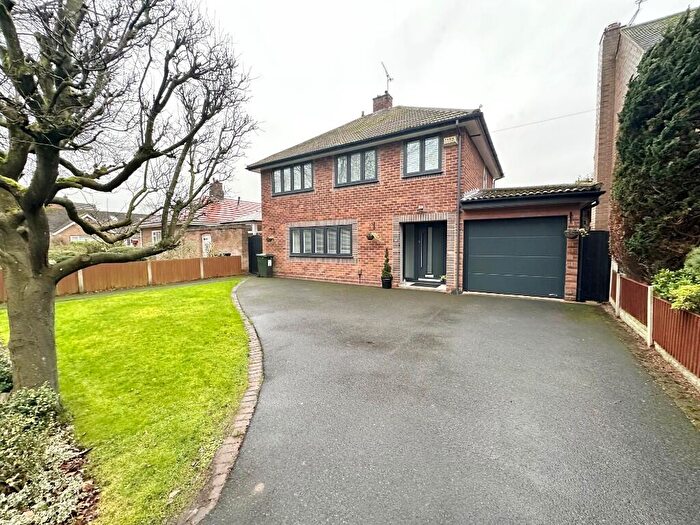
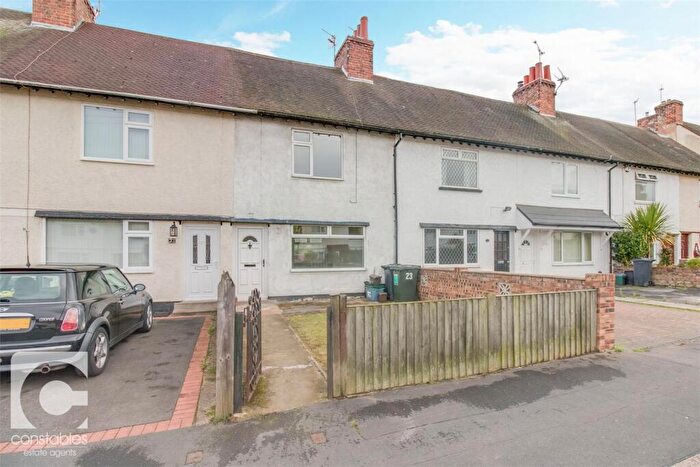
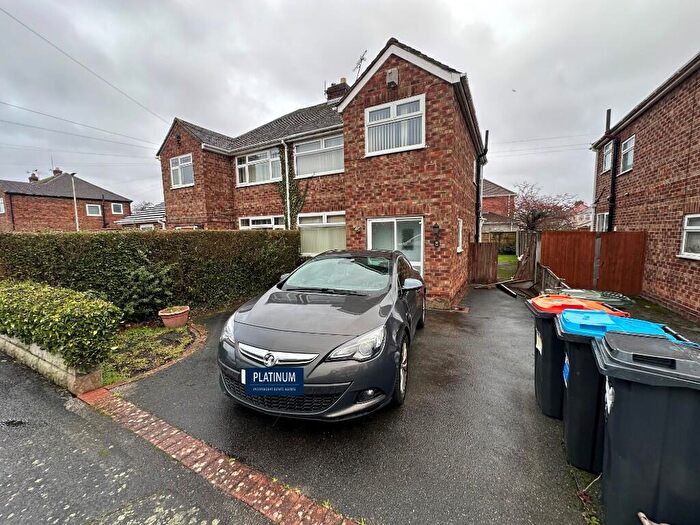
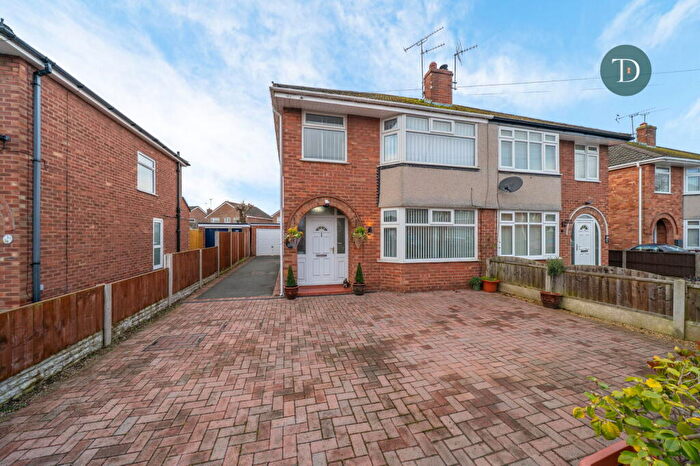
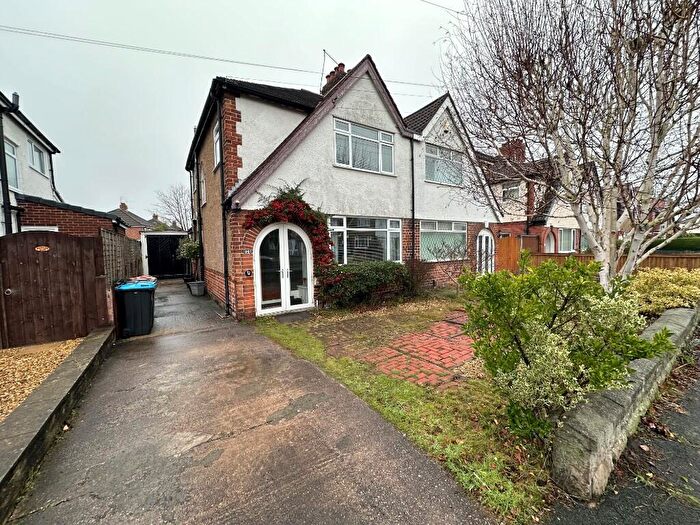
Properties for sale in Whitby
Roads and Postcodes in Whitby
Navigate through our locations to find the location of your next house in Whitby, Ellesmere Port for sale or to rent.
| Streets | Postcodes |
|---|---|
| Acorn Drive | CH65 6UF |
| Alderney Close | CH65 9HU |
| Ambleside Road | CH65 9DG CH65 9DQ |
| Anglesey Close | CH65 9JH |
| Arran Avenue | CH65 9JE |
| Avondale | CH65 6RN CH65 6RW |
| Bardsey Close | CH65 9JD |
| Barry Close | CH65 9HR |
| Bedford Avenue | CH65 6PJ |
| Bedford Avenue East | CH65 6TS |
| Beech Grove | CH66 2PA CH66 2PB |
| Beechcroft Drive | CH65 6PD CH65 6PE |
| Birch Grove | CH66 2PX |
| Birkett Avenue | CH65 9BX CH65 9BY CH65 9BZ CH65 9DA |
| Bradwall Close | CH65 7ES |
| Buttermere Avenue | CH65 9BN CH65 9BW |
| Carrick Drive | CH65 6PG |
| Castle Drive | CH65 6SJ |
| Cavendish Gardens | CH65 7ET |
| Chapel Mews | CH65 6UA |
| Cherry Grove | CH66 2PP |
| Chester Road | CH65 6PL CH65 6RU CH65 6RX CH65 6RY CH65 6SA CH65 6SB CH65 6SD CH65 6SE CH65 9BD CH65 9BE CH66 2LJ CH66 2NX CH66 2NY CH66 2NZ |
| Clare Drive | CH65 6TJ |
| Clydesdale | CH65 6RL |
| Cumbrae Drive | CH65 9JX |
| Dale Gardens | CH65 6RD |
| Dawn Gardens | CH65 9BA |
| Deeside | CH65 6RG CH65 6RQ CH65 6TQ |
| Deeside Close | CH65 6TH |
| Dunkirk Drive | CH65 6QH |
| Dunkirk Lane | CH65 6QF |
| Eddisbury Road | CH66 2JT CH66 2JU CH66 2JX |
| Elm Grove | CH66 2PR CH66 2PS CH66 2PT |
| Eskdale | CH65 6RH |
| Fair Isles Close | CH65 9LQ |
| Fairfield Avenue | CH65 6PQ |
| Fairview Road | CH65 6SY CH65 6SZ |
| Farne Close | CH65 9JT |
| Fern Road | CH65 6PA CH65 6PB |
| Fir Tree Grove | CH66 2QT |
| Grasmere Road | CH65 9BP |
| Greenlea Close | CH65 6QA |
| Grindley Gardens | CH65 9BU |
| Guernsey Drive | CH65 9JA |
| Handa Drive | CH65 9HL |
| Heath Avenue | CH65 6QQ |
| Hilbre Drive | CH65 9JQ |
| Holmwood Drive | CH65 6PF |
| Islay Close | CH65 9LS |
| Jersey Avenue | CH65 9HZ |
| Kinnerley Road | CH65 6SR |
| Kintyre Close | CH65 9LH |
| Laburnum Grove | CH66 2PD |
| Lewis Close | CH65 9LR |
| Lilac Grove | CH66 2PH |
| Lindisfarne Avenue | CH65 9JF |
| Lundy Drive | CH65 9JS |
| Mansfield Road | CH65 6SS CH65 6ST |
| Maple Grove | CH66 2PE CH66 2PF CH66 2PG CH66 2PQ |
| Maxwell Close | CH65 6SX |
| Mull Close | CH65 9JZ |
| Old Hall Drive | CH65 9AX |
| Orchard Road | CH65 6PH |
| Orkney Close | CH65 9HX |
| Overpool Road | CH66 2JD CH66 2JJ |
| Palm Grove | CH66 2PU |
| Park Drive | CH65 6QX CH65 6QZ CH65 6RA |
| Parkfield Drive | CH65 6SN CH65 6SW |
| Pembroke Drive | CH65 6TB CH65 6TD |
| Pine Grove | CH66 2PL |
| Pleck Road | CH65 6SP |
| Pooltown Road | CH65 7AA CH65 7AB |
| Poplar Close | CH65 9LW |
| Puffin Close | CH65 9JP |
| Queens Avenue | CH65 6SL |
| Ramsey Road | CH65 9LJ |
| Rhum Close | CH65 9LD |
| Ribblesdale | CH65 6RF |
| Rona Avenue | CH65 9HS |
| Rydal Close | CH65 9BT |
| Sark Avenue | CH65 9LU |
| Scilly Close | CH65 9JU |
| Severn Vale | CH65 6RE |
| Shetland Drive | CH65 9HT |
| Silverne Drive | CH65 6TA |
| Skye Close | CH65 9JG |
| St Kilda Close | CH65 9LL |
| St Thomas View | CH65 9LN |
| Staffin Avenue | CH65 9HP |
| Stanney Lane | CH65 9AD CH65 9AE CH65 9AF CH65 9AG CH65 9AQ |
| Strawberry Drive | CH66 2TU |
| Strawberry Green | CH66 2TX |
| Strawberry Park | CH66 2YS |
| Stroma Avenue | CH65 9HW |
| Sycamore Drive | CH66 2PN CH66 2PW |
| Thames Gardens | CH65 6QU |
| Thames Side | CH65 6QT |
| Thamesdale | CH65 6QP CH65 6QS CH65 6QW |
| The Green | CH65 6RR |
| The Riddings | CH65 9LP |
| Thirlmere Road | CH65 9DD CH65 9DH |
| Thomas Close | CH65 6TP |
| Trentdale | CH65 6RP |
| Tynesdale | CH65 6RB |
| Ullswater Road | CH65 9BS |
| Underwood Drive | CH65 6TN CH65 9AW CH65 9BH CH65 9BJ CH65 9BL CH65 9BQ |
| Vale Gardens | CH65 9BB |
| Vale Road | CH65 9AY CH65 9AZ |
| Walnut Grove | CH66 2JY CH66 2JZ |
| Warrington Avenue | CH65 6TR |
| Weaver Road | CH65 9DE CH65 9DF |
| Whitby Road | CH65 6RT |
| Wight Close | CH65 9HY |
| Willow Grove | CH66 2PJ |
| Windermere Road | CH65 9DJ CH65 9DL |
| Windsor Drive | CH65 6SH |
| Woodbank Road | CH65 6PT CH65 6PU CH65 6PX |
| Woodcote Avenue | CH65 6PY |
| Woodland Road | CH65 6PN CH65 6PP CH65 6PR CH65 6PS CH65 6PW |
| Woodside | CH65 6PZ |
| Woodsome Close | CH65 6QE |
| Woodsome Drive | CH65 6QB CH65 6QD CH65 6QG |
| Wyedale | CH65 6RJ |
| Wyncroft Close | CH65 6TT |
Transport near Whitby
-
Ellesmere Port Station
-
Overpool Station
-
Capenhurst Station
-
Little Sutton Station
-
Stanlow and Thornton Station
- FAQ
- Price Paid By Year
- Property Type Price
Frequently asked questions about Whitby
What is the average price for a property for sale in Whitby?
The average price for a property for sale in Whitby is £244,771. This amount is 18% higher than the average price in Ellesmere Port. There are 605 property listings for sale in Whitby.
What streets have the most expensive properties for sale in Whitby?
The streets with the most expensive properties for sale in Whitby are Rona Avenue at an average of £415,000, Acorn Drive at an average of £404,000 and Castle Drive at an average of £384,000.
What streets have the most affordable properties for sale in Whitby?
The streets with the most affordable properties for sale in Whitby are Dawn Gardens at an average of £155,000, Fir Tree Grove at an average of £167,500 and Ramsey Road at an average of £171,750.
Which train stations are available in or near Whitby?
Some of the train stations available in or near Whitby are Ellesmere Port, Overpool and Capenhurst.
Property Price Paid in Whitby by Year
The average sold property price by year was:
| Year | Average Sold Price | Price Change |
Sold Properties
|
|---|---|---|---|
| 2025 | £247,042 | 0,2% |
98 Properties |
| 2024 | £246,562 | 2% |
113 Properties |
| 2023 | £241,076 | -0,1% |
115 Properties |
| 2022 | £241,241 | 10% |
117 Properties |
| 2021 | £216,150 | 10% |
168 Properties |
| 2020 | £193,701 | -0,3% |
104 Properties |
| 2019 | £194,275 | 1% |
128 Properties |
| 2018 | £192,543 | 5% |
135 Properties |
| 2017 | £182,531 | 1% |
155 Properties |
| 2016 | £181,439 | 7% |
123 Properties |
| 2015 | £168,104 | 2% |
127 Properties |
| 2014 | £164,954 | 2% |
134 Properties |
| 2013 | £162,202 | 1% |
118 Properties |
| 2012 | £159,904 | 6% |
80 Properties |
| 2011 | £150,906 | -13% |
86 Properties |
| 2010 | £171,220 | 8% |
75 Properties |
| 2009 | £156,946 | -4% |
73 Properties |
| 2008 | £163,682 | -8% |
90 Properties |
| 2007 | £177,437 | 8% |
138 Properties |
| 2006 | £163,513 | -3% |
149 Properties |
| 2005 | £167,653 | 3% |
108 Properties |
| 2004 | £162,667 | 17% |
166 Properties |
| 2003 | £135,023 | 14% |
158 Properties |
| 2002 | £116,185 | 10% |
189 Properties |
| 2001 | £105,003 | 16% |
211 Properties |
| 2000 | £88,136 | 10% |
225 Properties |
| 1999 | £79,307 | 4% |
261 Properties |
| 1998 | £76,252 | 1% |
165 Properties |
| 1997 | £75,267 | 10% |
165 Properties |
| 1996 | £68,062 | 6% |
130 Properties |
| 1995 | £63,979 | - |
123 Properties |
Property Price per Property Type in Whitby
Here you can find historic sold price data in order to help with your property search.
The average Property Paid Price for specific property types in the last three years are:
| Property Type | Average Sold Price | Sold Properties |
|---|---|---|
| Semi Detached House | £230,659.00 | 230 Semi Detached Houses |
| Detached House | £308,749.00 | 70 Detached Houses |
| Terraced House | £206,239.00 | 23 Terraced Houses |
| Flat | £129,333.00 | 3 Flats |

