
Houses for sale in Congleton, Cheshire
House Prices in Congleton
Properties in Congleton have an average house price of £295k and had 1,600 Property Transactions within the last 3 years.¹
Congleton is an area in Cheshire with 14,857 households², where the most expensive property was sold for £2.2M.
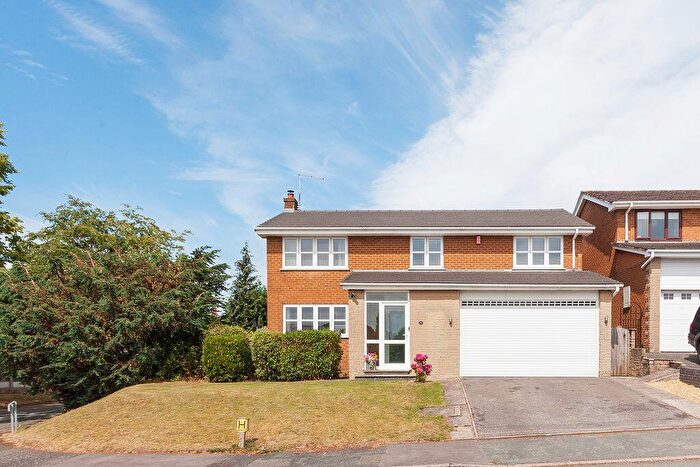
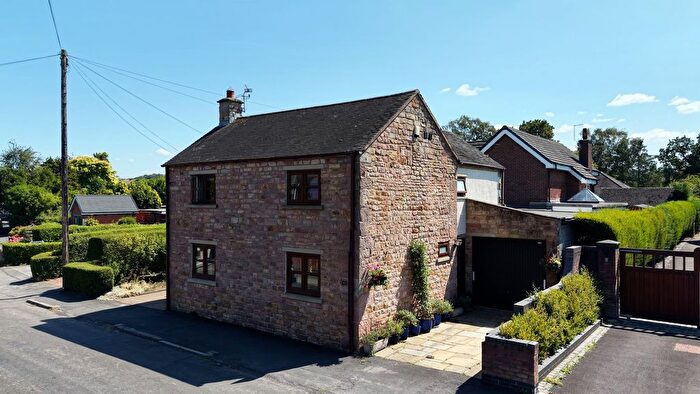
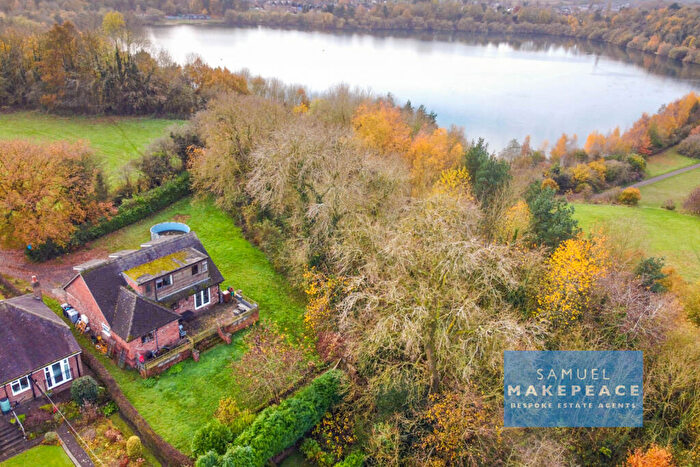
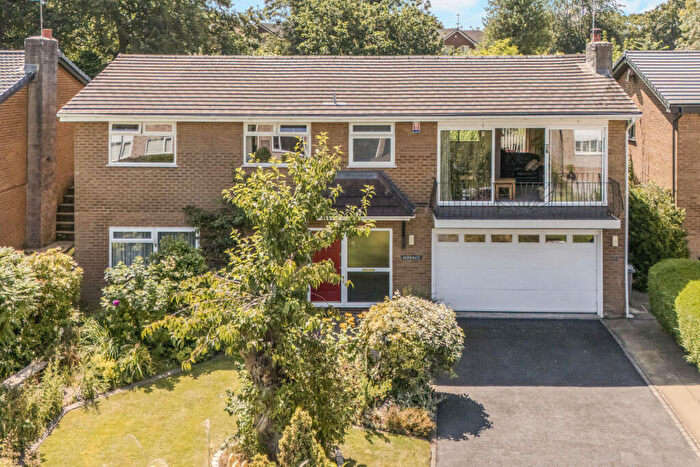
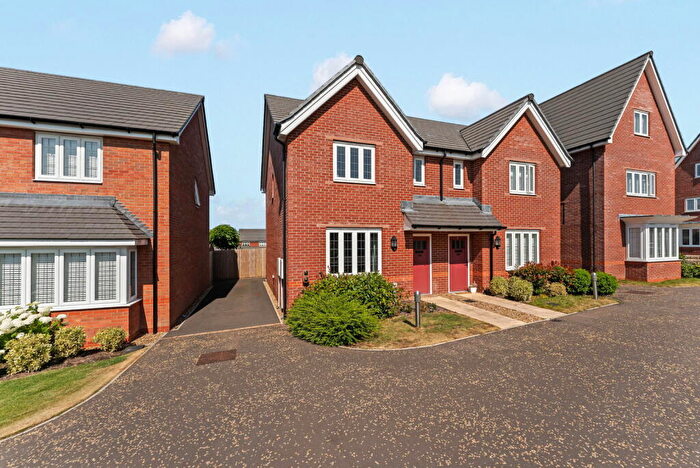
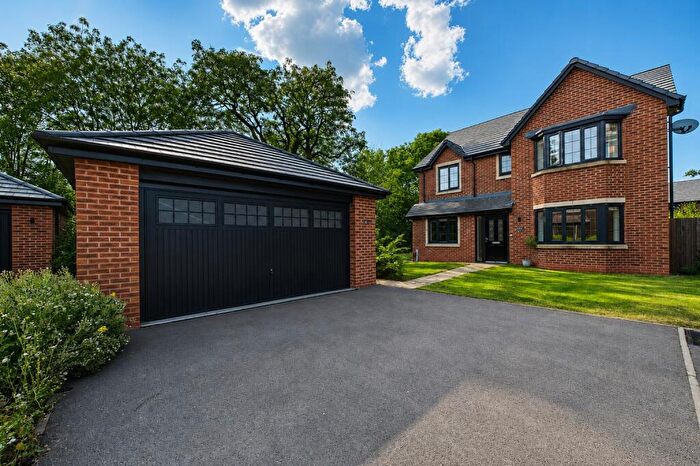
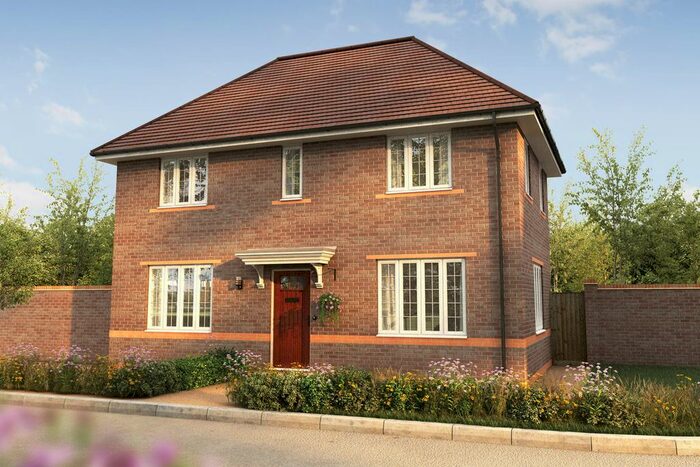
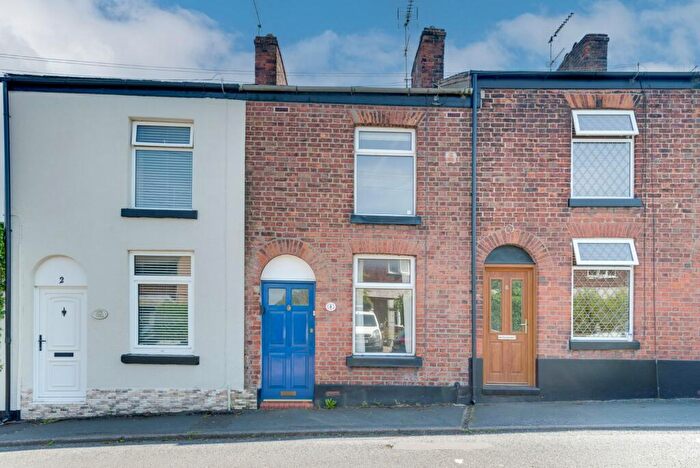
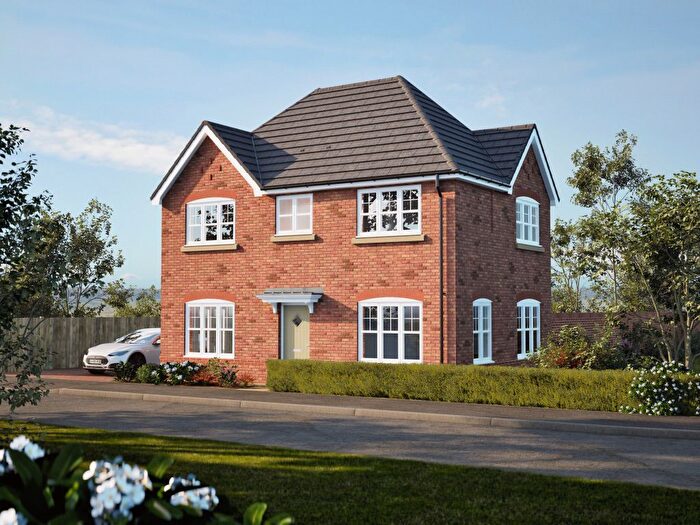
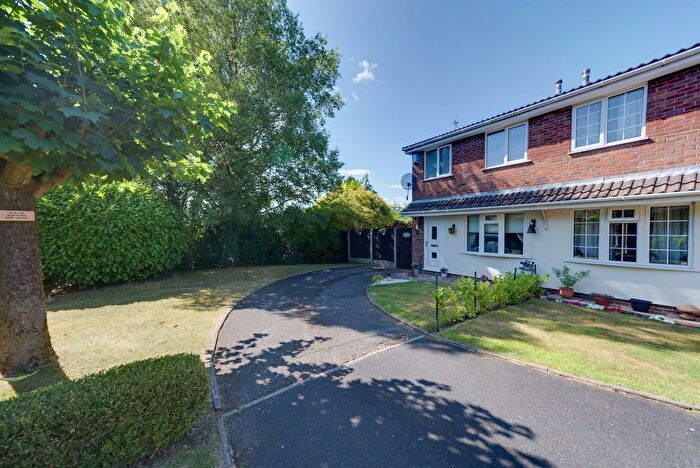
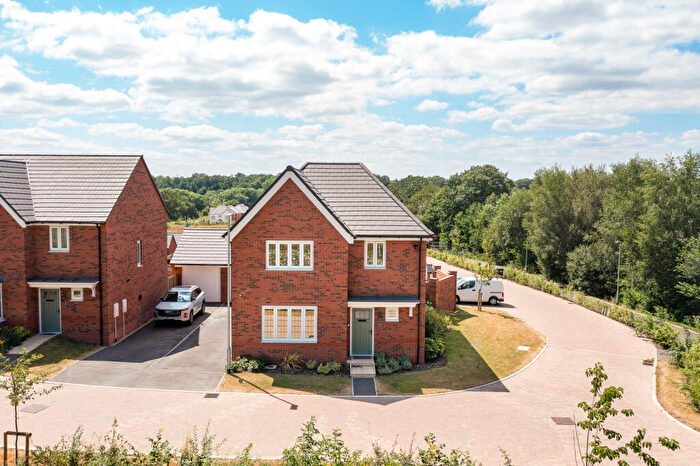
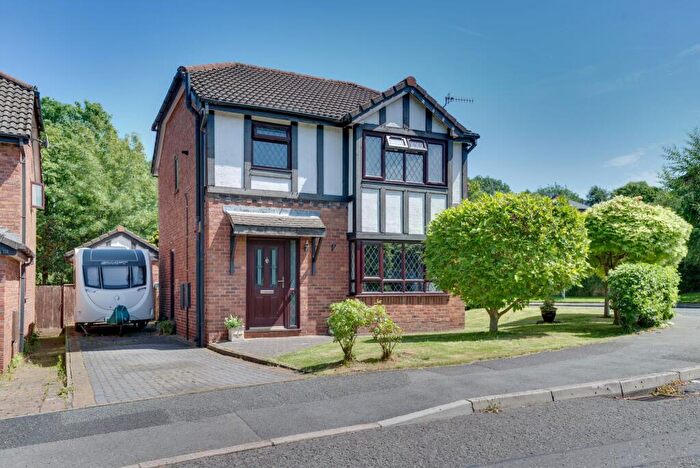
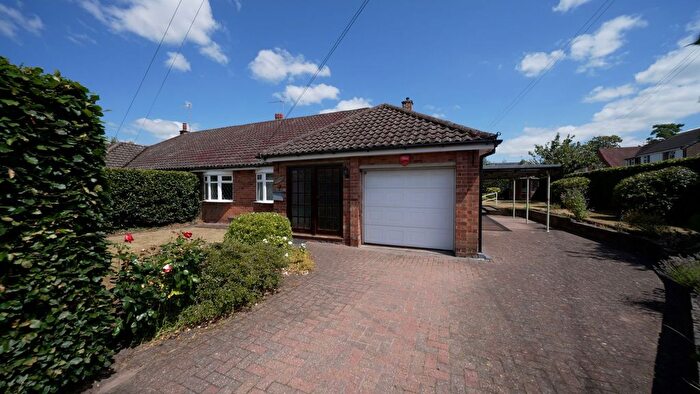
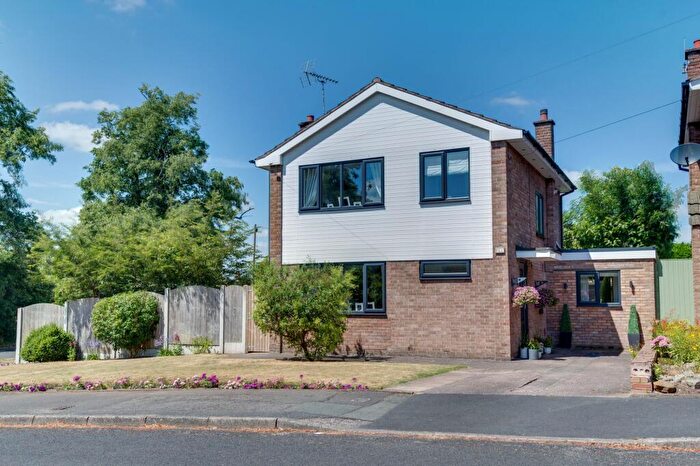
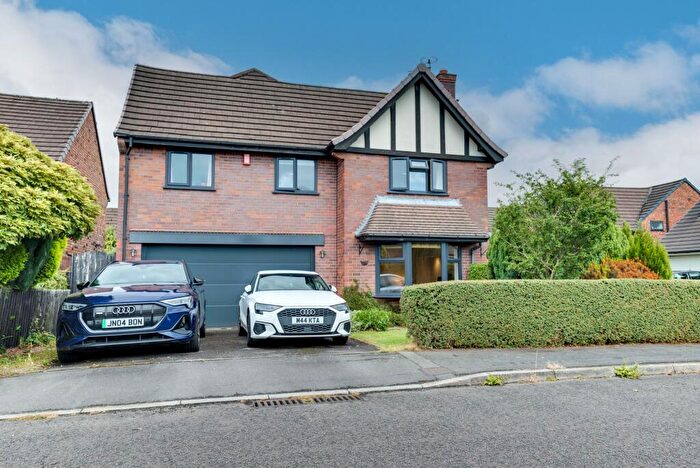
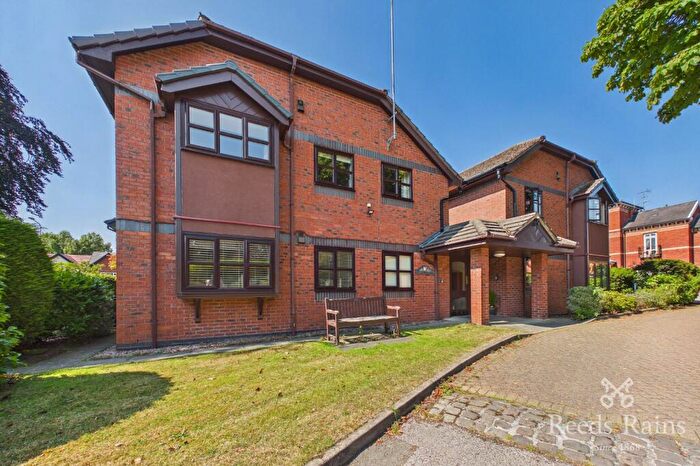
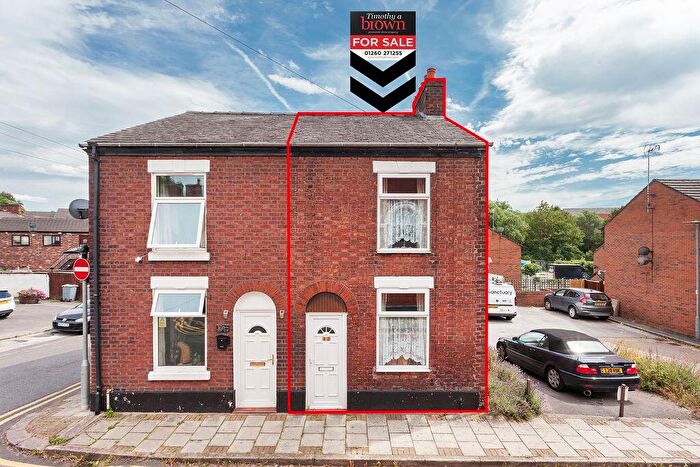
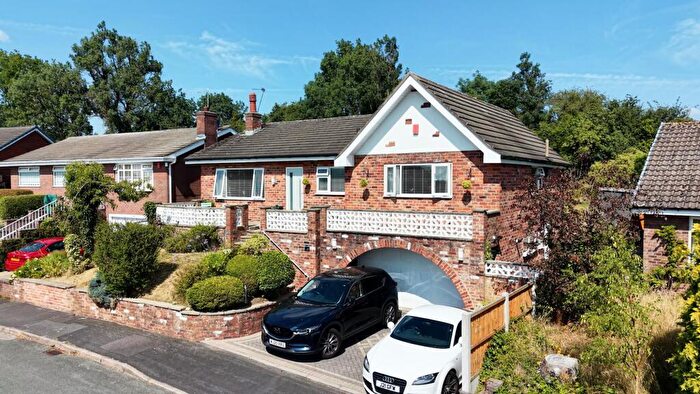
Properties for sale in Congleton
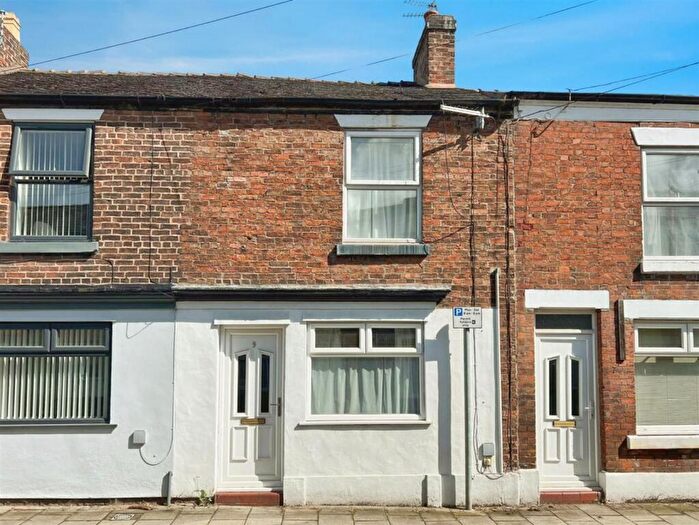
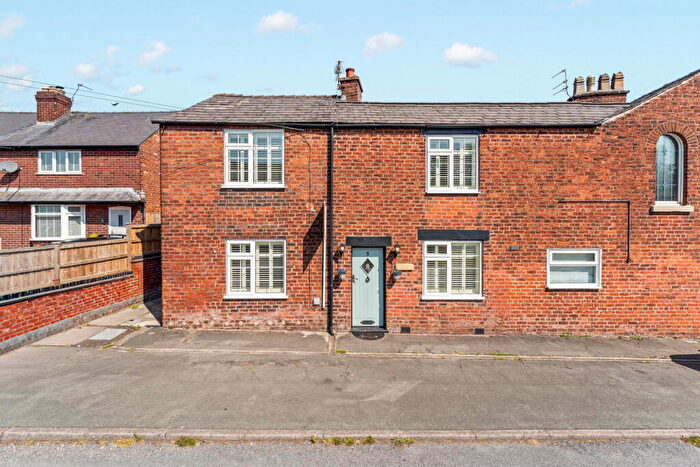
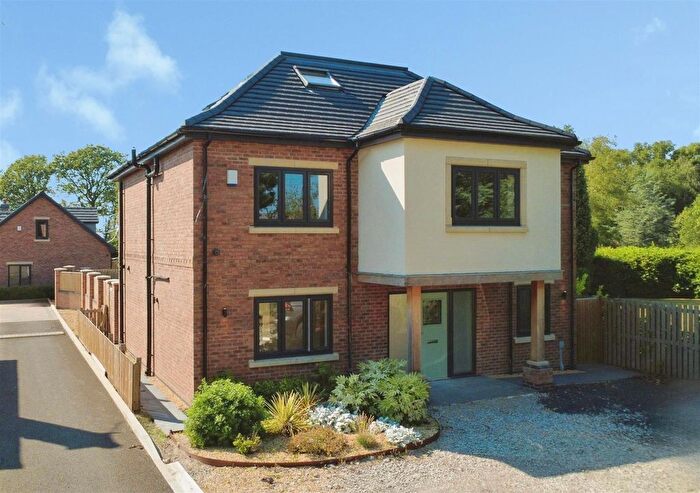
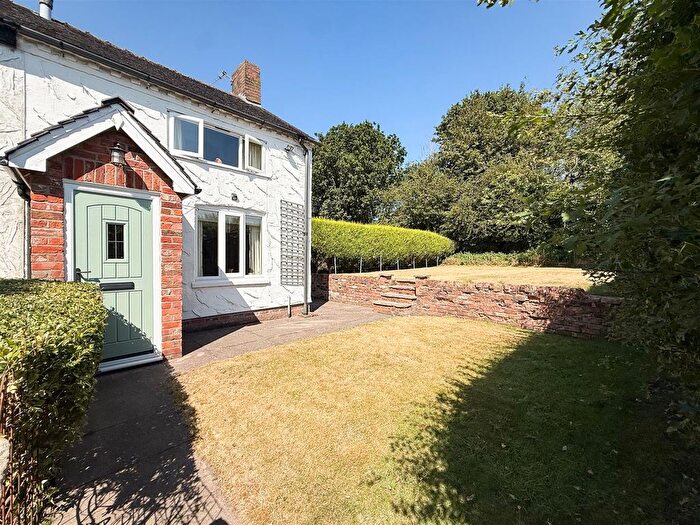
![]()
If you are looking to sell your house, let it out, or receive a property valuation, an expert can help you.
Click the button below to get started.
Neighbourhoods in Congleton
Navigate through our locations to find the location of your next house in Congleton, Cheshire for sale or to rent.
Property price trends in Congleton
According to the latest Land Registry data, the average home in Congleton sold for £275,054 in 2026. That figure comes from a substantial record of 17,854 sales logged over the past 31 years.
Prices have softened over the last three years. Compared with 2023, when the typical sale came in around £285,451, that's a fall of roughly 3.6%.
Looking back five years, average prices are up about 0.9% since 2021, a gain of around £2,486 in cash terms.
Zoom out to the past decade for the fuller picture. Back in 2016, homes here averaged £211,875, so the typical sold price has climbed about 29.8% since then, roughly 2.6% a year. Stretch the view to fifteen years and that annual pace holds at about 2.8%.
Frequently asked questions about Congleton
What is the average price for a property for sale in Congleton?
The average price for a property for sale in Congleton is £294,782. This amount is 8% lower than the average price in Cheshire. There are 6,809 property listings for sale in Congleton.
What locations have the most expensive properties for sale in Congleton?
The locations with the most expensive properties for sale in Congleton are Odd Rode at an average of £627,002, Brereton Rural at an average of £436,440 and Gawsworth at an average of £431,448.
What locations have the most affordable properties for sale in Congleton?
The locations with the most affordable properties for sale in Congleton are Congleton West at an average of £250,715 and Congleton East at an average of £293,731.
Which train stations are available in or near Congleton?
Some of the train stations available in or near Congleton are Congleton, Kidsgrove and Goostrey.
Property Price Paid in Congleton by Year
The average sold property price by year was:
| Year | Average Sold Price | Price Change |
Sold Properties
|
|---|---|---|---|
| 2026 | £275,054 | -12% |
37 Properties |
| 2025 | £308,098 | 6% |
554 Properties |
| 2024 | £290,538 | 2% |
544 Properties |
| 2023 | £285,451 | -6% |
465 Properties |
| 2022 | £301,443 | 10% |
613 Properties |
| 2021 | £272,568 | 3% |
801 Properties |
| 2020 | £263,486 | 7% |
778 Properties |
| 2019 | £245,666 | -1% |
869 Properties |
| 2018 | £247,630 | 8% |
712 Properties |
| 2017 | £228,179 | 7% |
693 Properties |
Property Price per Property Type in Congleton
Here you can find historic sold price data in order to help with your property search.
The average Property Paid Price for specific property types in the last three years are:
| Property Type | Average Sold Price | Sold Properties |
|---|---|---|
| Semi Detached House | £256,189.00 | 518 Semi Detached Houses |
| Detached House | £438,374.00 | 576 Detached Houses |
| Terraced House | £180,069.00 | 394 Terraced Houses |
| Flat | £138,342.00 | 112 Flats |
Transport in Congleton
Please see below transportation links in this area:
