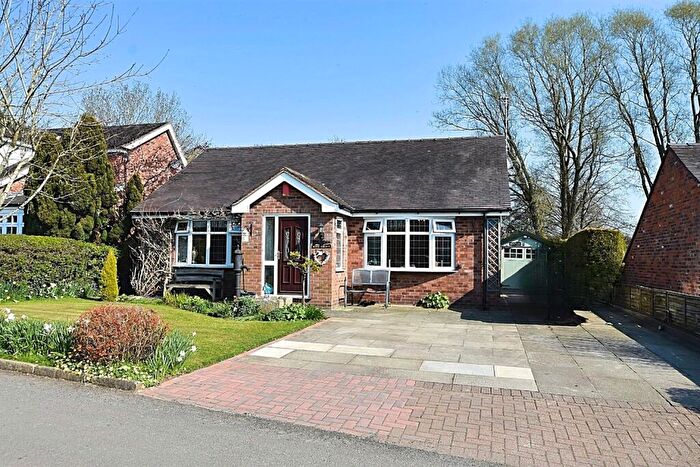
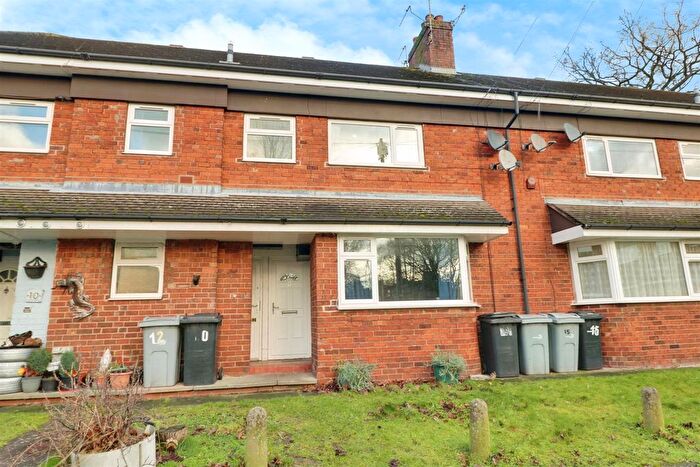
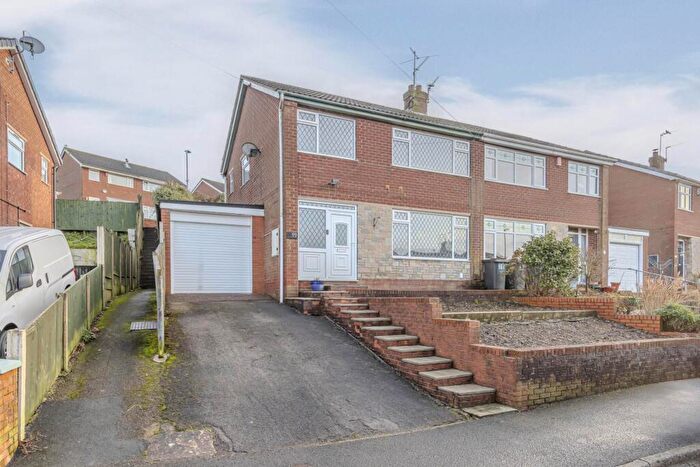
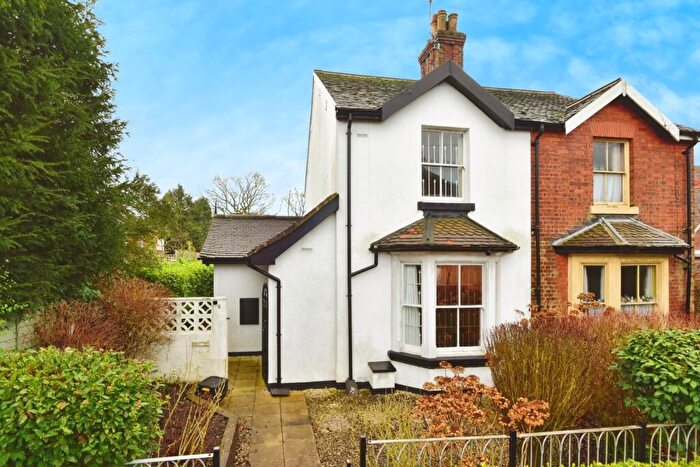
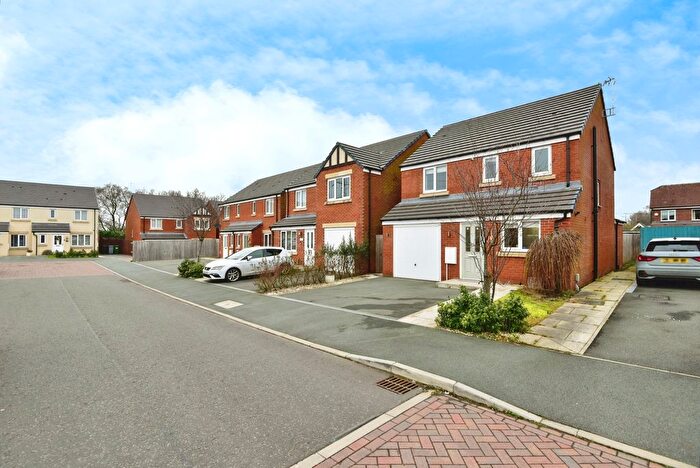
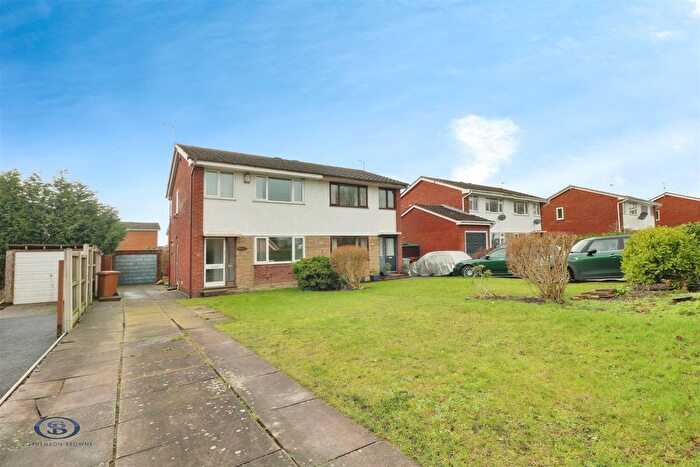
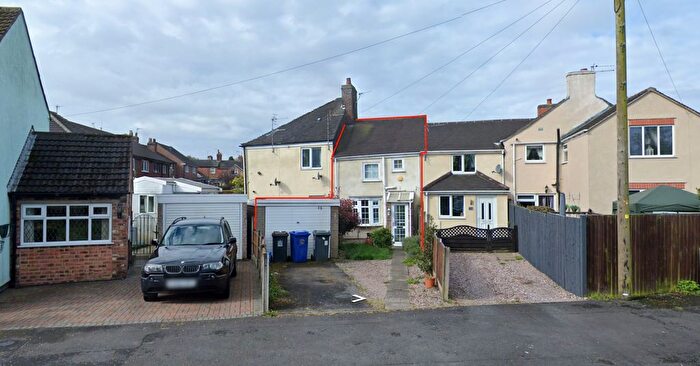
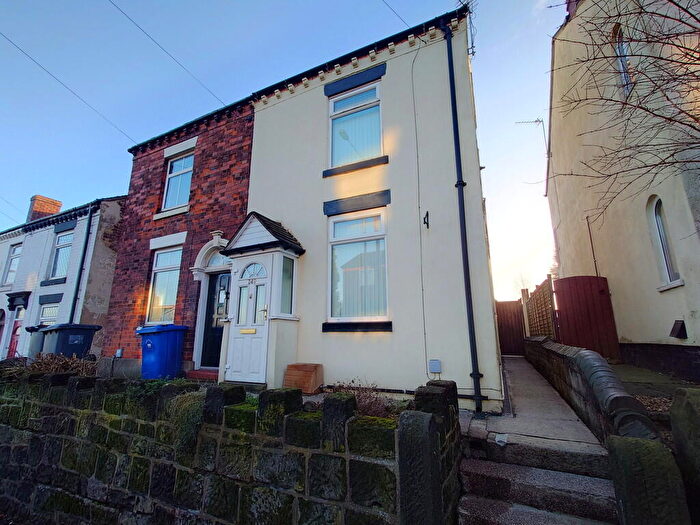
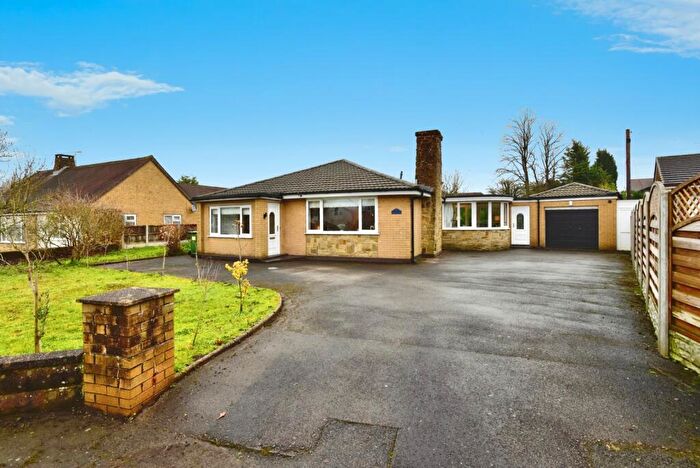
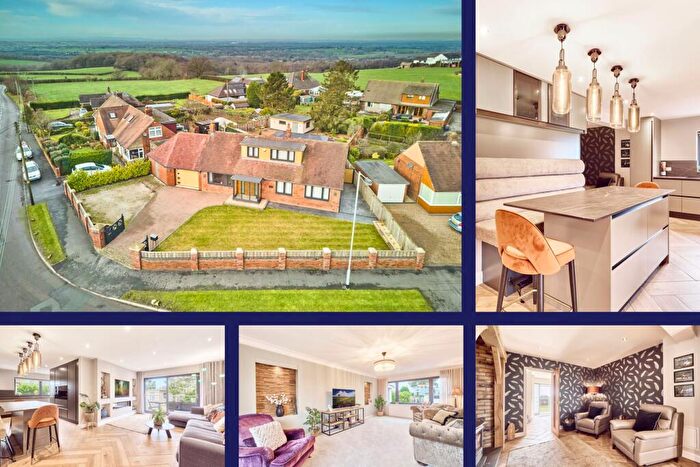
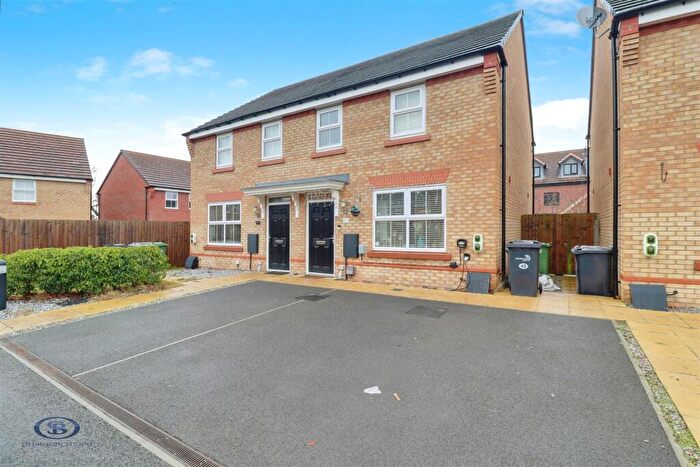
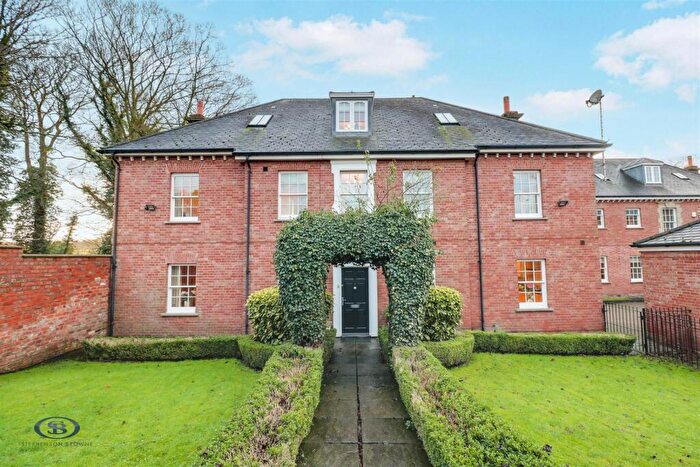
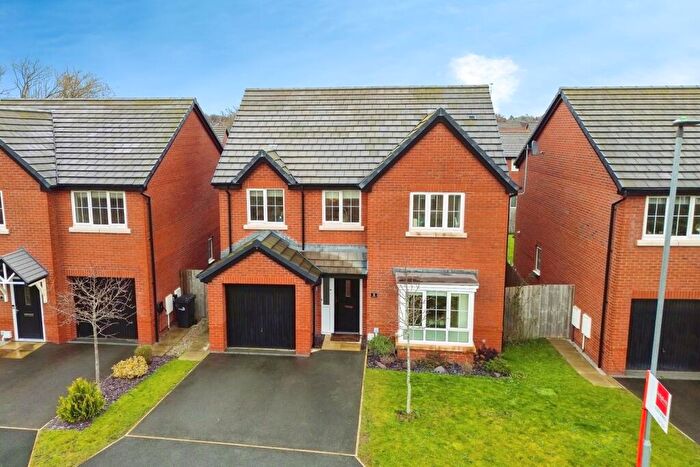
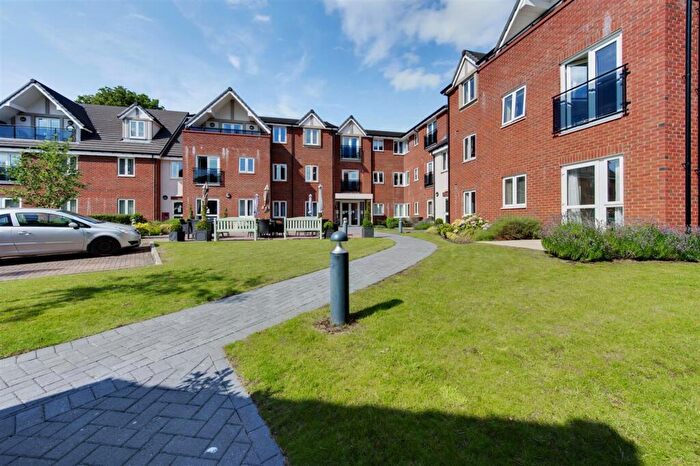
Houses for sale & to rent in Stoke-on-trent, Cheshire
House Prices in Stoke-on-trent
Properties in Stoke-on-trent have an average house price of £288,198.00 and had 1,001 Property Transactions within the last 3 years.¹
Stoke-on-trent is an area in Cheshire with 8,596 households², where the most expensive property was sold for £1,995,000.00.
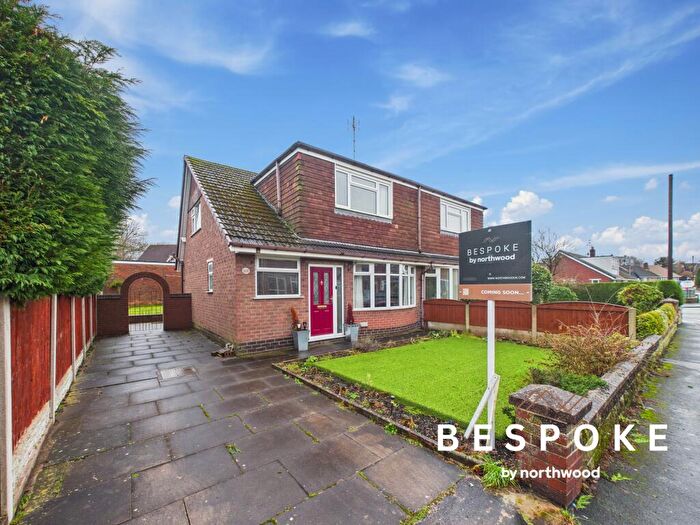
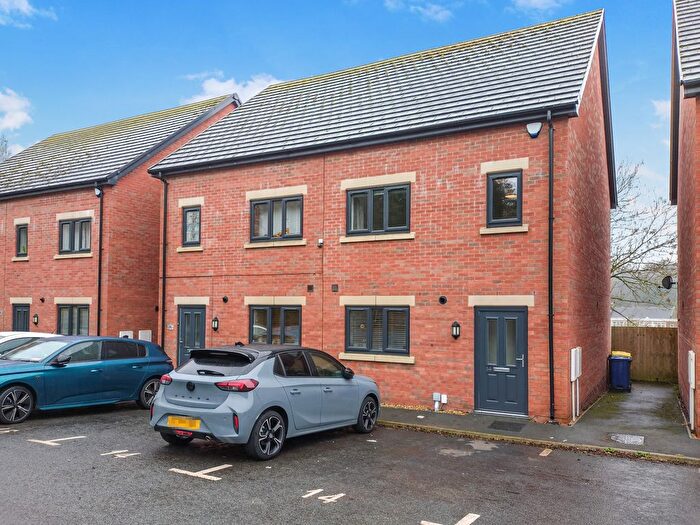
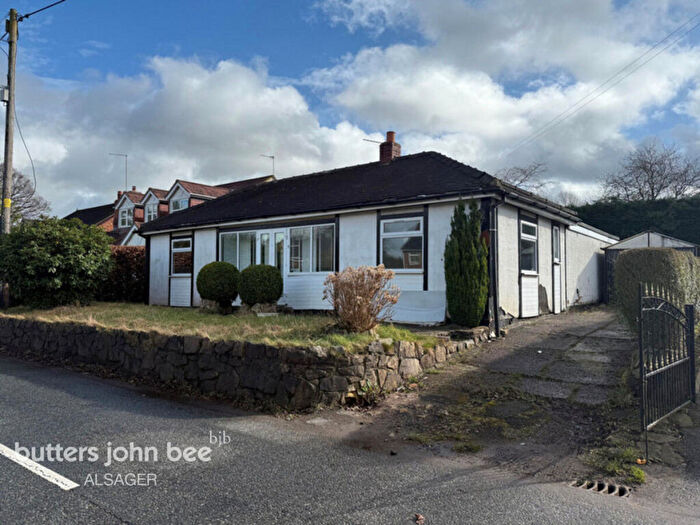
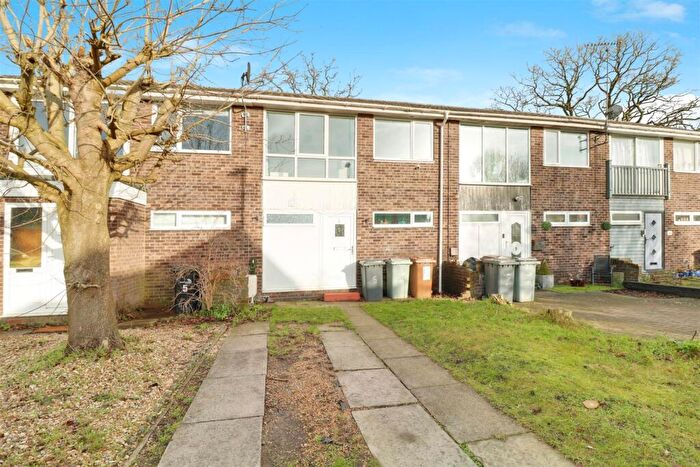
Properties for sale in Stoke-on-trent
Neighbourhoods in Stoke-on-trent
Navigate through our locations to find the location of your next house in Stoke-on-trent, Cheshire for sale or to rent.
Transport in Stoke-on-trent
Please see below transportation links in this area:
-
Alsager Station
-
Kidsgrove Station
-
Longport Station
-
Sandbach Station
-
Congleton Station
-
Crewe Station
-
Holmes Chapel Station
-
Stoke-On-Trent Station
-
Goostrey Station
-
Nantwich Station
- FAQ
- Price Paid By Year
- Property Type Price
Frequently asked questions about Stoke-on-trent
What is the average price for a property for sale in Stoke-on-trent?
The average price for a property for sale in Stoke-on-trent is £288,198. This amount is 10% lower than the average price in Cheshire. There are 4,799 property listings for sale in Stoke-on-trent.
What locations have the most expensive properties for sale in Stoke-on-trent?
The locations with the most expensive properties for sale in Stoke-on-trent are Haslington at an average of £311,465 and Alsager at an average of £292,430.
What locations have the most affordable properties for sale in Stoke-on-trent?
The location with the most affordable properties for sale in Stoke-on-trent is Odd Rode at an average of £277,921.
Which train stations are available in or near Stoke-on-trent?
Some of the train stations available in or near Stoke-on-trent are Alsager, Kidsgrove and Longport.
Property Price Paid in Stoke-on-trent by Year
The average sold property price by year was:
| Year | Average Sold Price | Price Change |
Sold Properties
|
|---|---|---|---|
| 2025 | £306,616 | 9% |
288 Properties |
| 2024 | £278,044 | -2% |
361 Properties |
| 2023 | £283,544 | 4% |
352 Properties |
| 2022 | £272,869 | 6% |
388 Properties |
| 2021 | £256,993 | 11% |
574 Properties |
| 2020 | £229,013 | - |
543 Properties |
| 2019 | £229,018 | 2% |
593 Properties |
| 2018 | £224,135 | 2% |
480 Properties |
| 2017 | £220,462 | 12% |
413 Properties |
| 2016 | £194,729 | -4% |
421 Properties |
| 2015 | £202,950 | 4% |
378 Properties |
| 2014 | £194,680 | 7% |
360 Properties |
| 2013 | £181,081 | 5% |
301 Properties |
| 2012 | £172,256 | -4% |
225 Properties |
| 2011 | £178,622 | -0,4% |
244 Properties |
| 2010 | £179,414 | 10% |
201 Properties |
| 2009 | £162,018 | -5% |
199 Properties |
| 2008 | £169,687 | -15% |
168 Properties |
| 2007 | £194,667 | 6% |
353 Properties |
| 2006 | £182,436 | 6% |
371 Properties |
| 2005 | £172,298 | 8% |
321 Properties |
| 2004 | £158,767 | 10% |
382 Properties |
| 2003 | £142,596 | 25% |
436 Properties |
| 2002 | £106,553 | 11% |
488 Properties |
| 2001 | £95,321 | 13% |
530 Properties |
| 2000 | £83,193 | 12% |
436 Properties |
| 1999 | £73,545 | 12% |
408 Properties |
| 1998 | £64,575 | -1% |
344 Properties |
| 1997 | £65,158 | 10% |
413 Properties |
| 1996 | £58,555 | -4% |
295 Properties |
| 1995 | £60,728 | - |
284 Properties |
Property Price per Property Type in Stoke-on-trent
Here you can find historic sold price data in order to help with your property search.
The average Property Paid Price for specific property types in the last three years are:
| Property Type | Average Sold Price | Sold Properties |
|---|---|---|
| Semi Detached House | £233,667.00 | 379 Semi Detached Houses |
| Detached House | £398,685.00 | 405 Detached Houses |
| Terraced House | £191,476.00 | 167 Terraced Houses |
| Flat | £129,655.00 | 50 Flats |

