
Houses for sale in CW12 3DP, Wallworths Bank, Congleton West, Congleton
House Prices in CW12 3DP, Wallworths Bank, Congleton West
Properties in CW12 3DP have no sales history available within the last 3 years. CW12 3DP is a postcode in Wallworths Bank located in Congleton West, an area in Congleton, Cheshire, with 17 households².
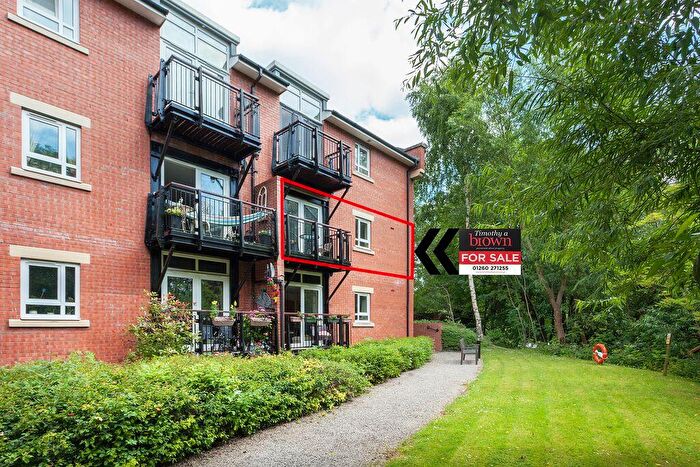
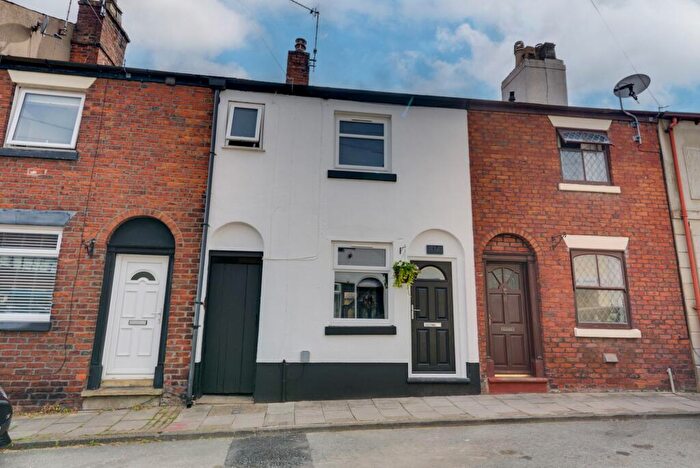
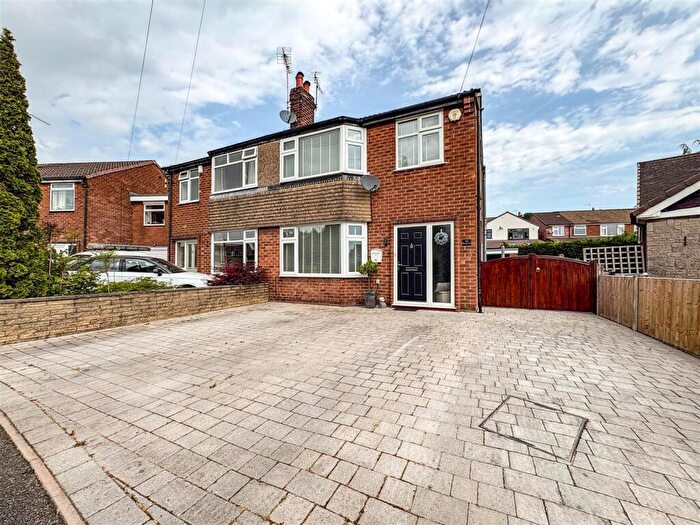
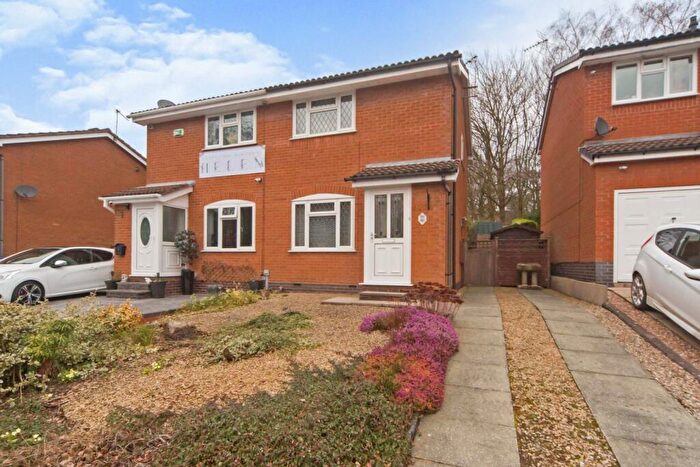
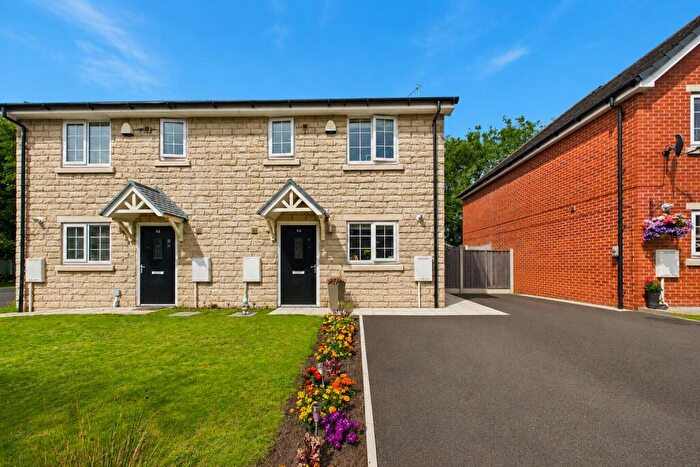
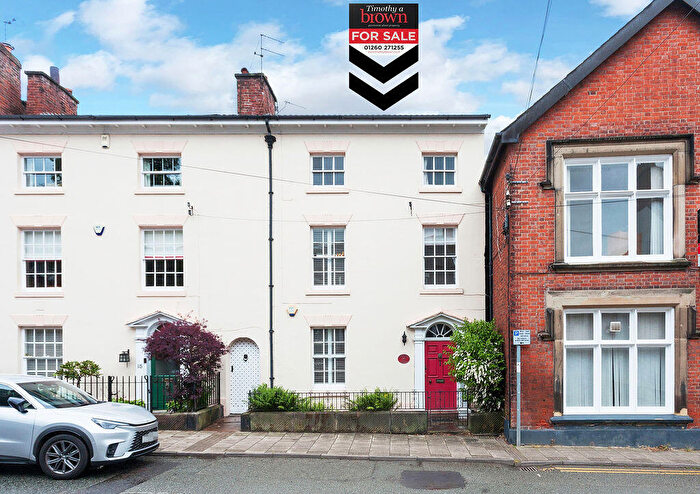
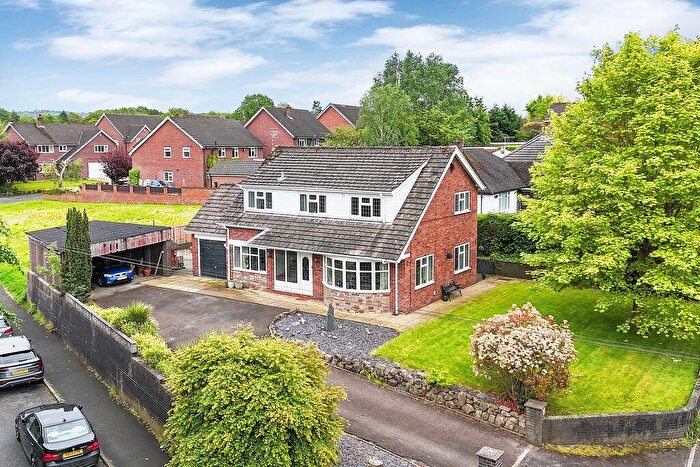
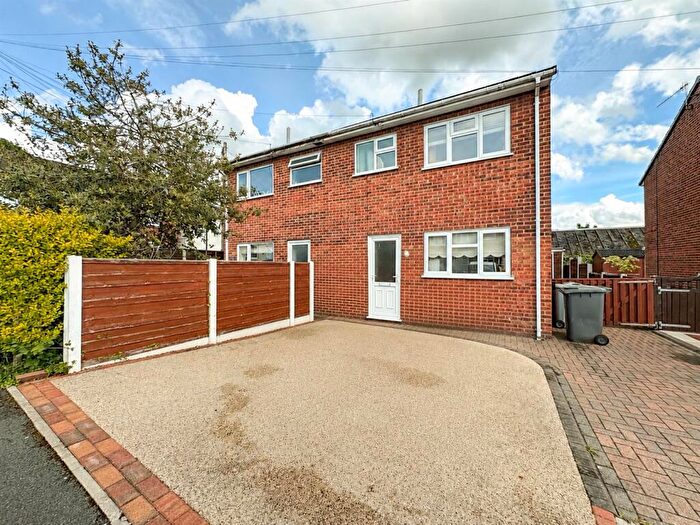
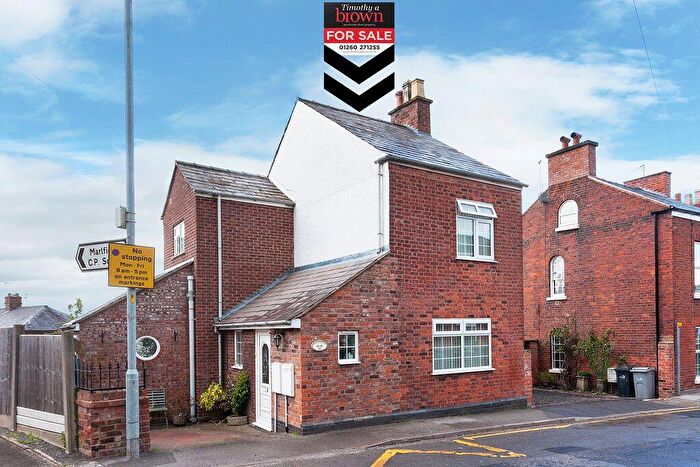
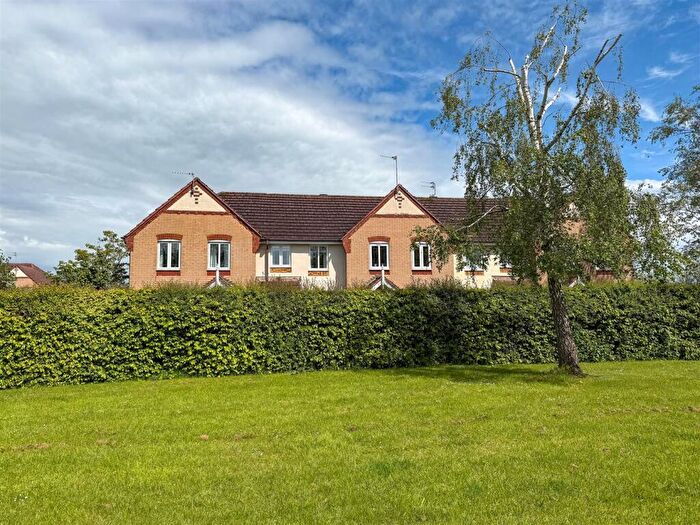
Properties for sale near CW12 3DP, Wallworths Bank
![]()
If you are looking to sell your house, let it out, or receive a property valuation, an expert can help you.
Click the button below to get started.
Price Paid in Wallworths Bank, CW12 3DP, Congleton West
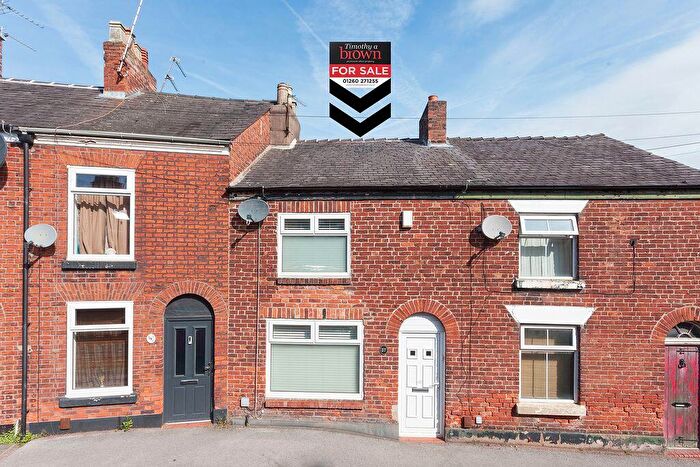
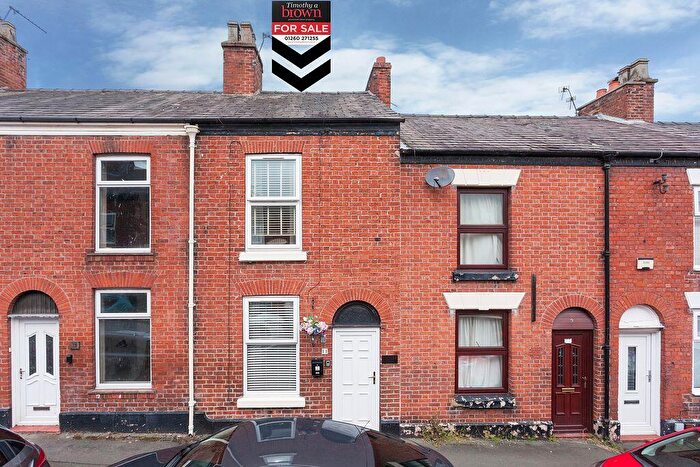
7 Wallworths Bank, CW12 3DP, Congleton West Congleton
Property 7 has been sold 2 times. The last time it was sold was in 16/11/2018 and the sold price was £92,500.00.
This terraced house, sold as a freehold on 16/11/2018, is a 55 sqm mid-terrace house with an EPC rating of C.
| Date | Price | Property Type | Tenure | Classification |
|---|---|---|---|---|
| 16/11/2018 | £92,500.00 | Terraced House | freehold | Established Building |
| 01/08/2002 | £54,000.00 | Terraced House | freehold | Established Building |
9 Wallworths Bank, CW12 3DP, Congleton West Congleton
Property 9 has been sold 1 time. The last time it was sold was in 16/03/2016 and the sold price was £86,000.00.
This terraced house, sold as a freehold on 16/03/2016, is a 70 sqm mid-terrace house with an EPC rating of C.
| Date | Price | Property Type | Tenure | Classification |
|---|---|---|---|---|
| 16/03/2016 | £86,000.00 | Terraced House | freehold | Established Building |
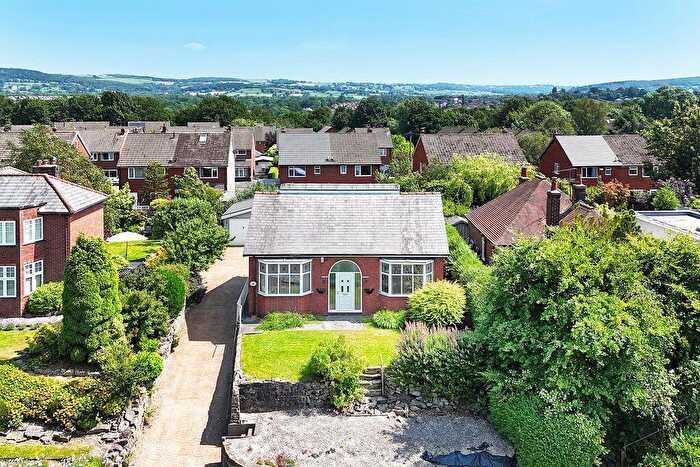
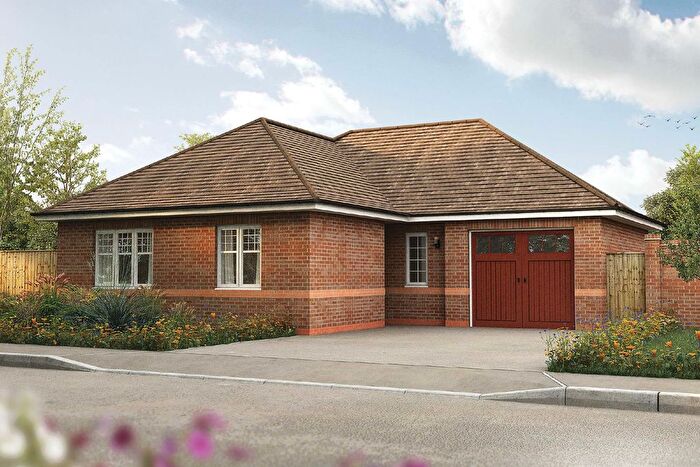
2 WALLWORTHS BANK, CW12 3DP, Congleton West Congleton
This is a 177 square meter Detached House with an EPC rating of D. Currently, there is no transaction history available for this property.
Property price trends in CW12 3DP, Wallworths Bank
According to the latest Land Registry data, the average home in CW12 3DP, Wallworths Bank sold for £92,500 in 2018. That figure comes from 3 sales logged over the past 16 years.
Prices have continued to climb over the last three years. Compared with 2016, when the typical sale came in around £86,000, that's a rise of roughly 7.6%.
Property Price Paid in CW12 3DP, Wallworths Bank by Year
The average sold property price by year was:
| Year | Average Sold Price | Price Change |
Sold Properties
|
|---|---|---|---|
| 2018 | £92,500 | 7% |
1 Property |
| 2016 | £86,000 | 37% |
1 Property |
| 2002 | £54,000 | - |
1 Property |
