
Houses for sale in Ellesmere Port, Cheshire
House Prices in Ellesmere Port
Properties in Ellesmere Port have an average house price of £208k and had 2,561 Property Transactions within the last 3 years.¹
Ellesmere Port is an area in Cheshire with 28,971 households², where the most expensive property was sold for £850k.
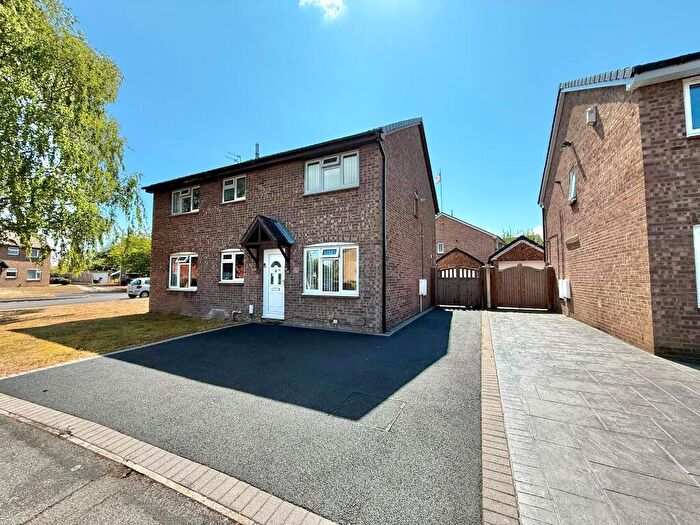
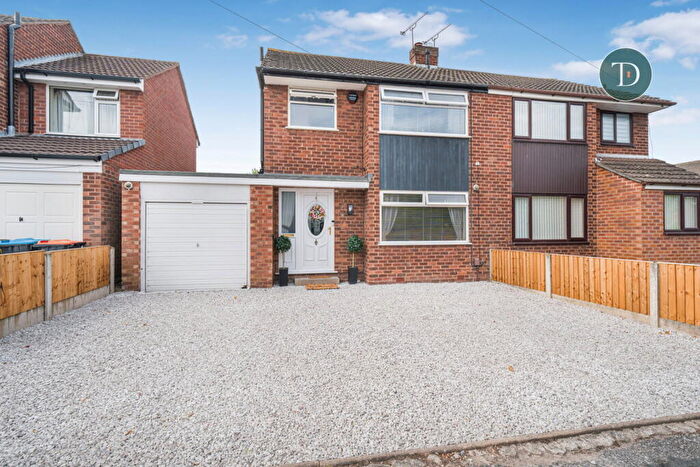
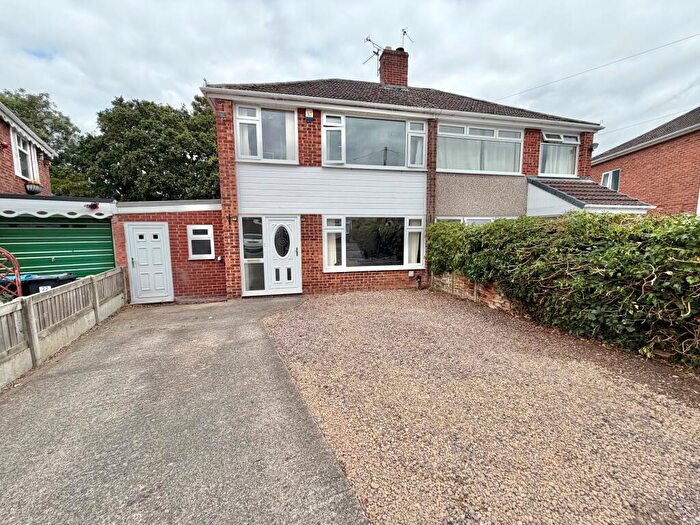
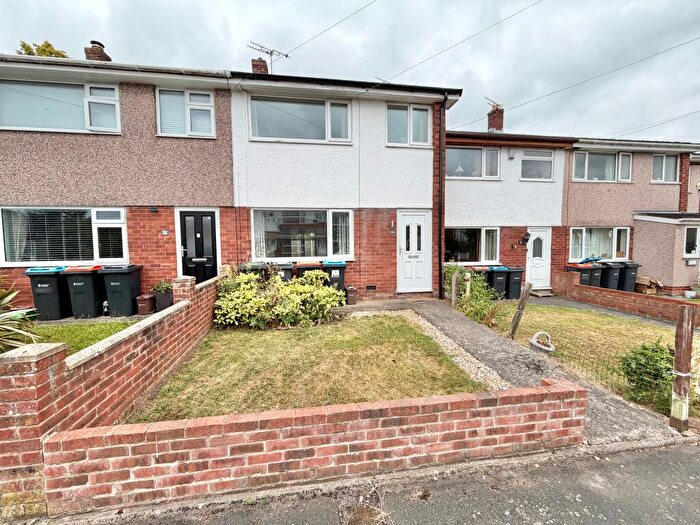
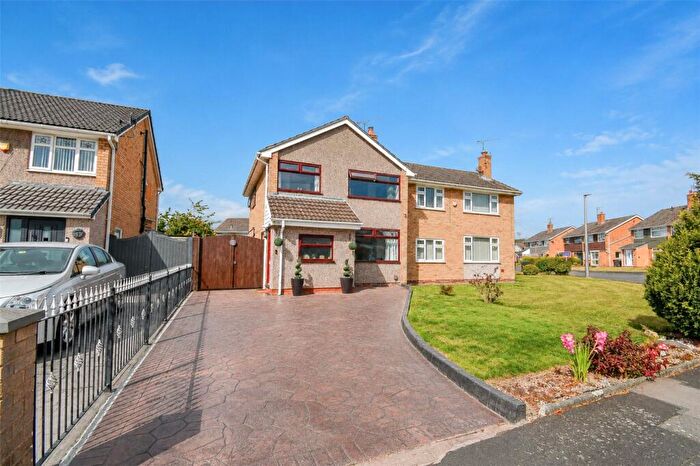
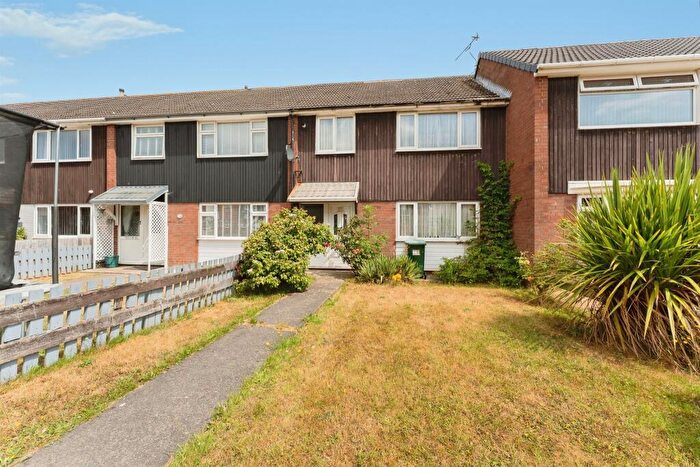
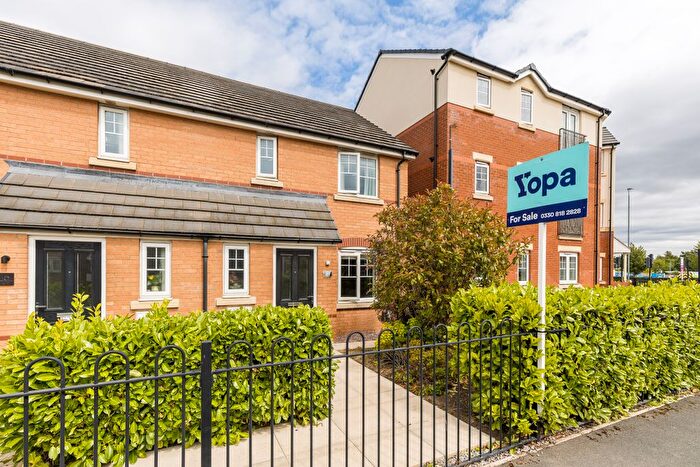
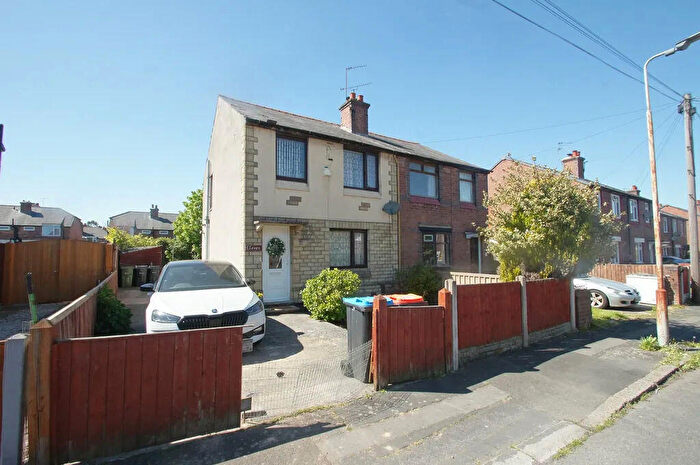
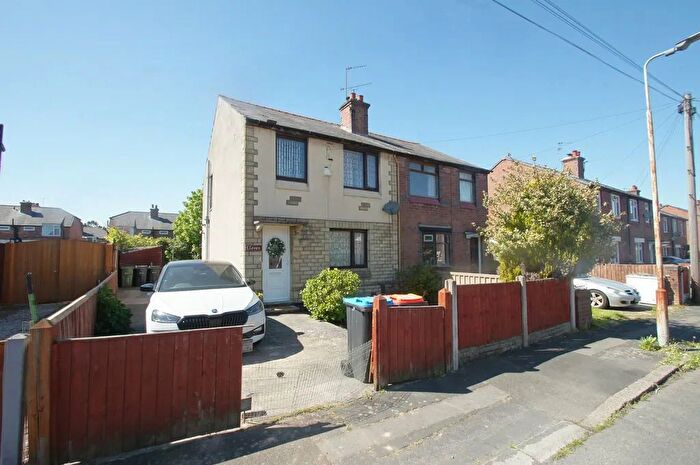
Properties for sale in Ellesmere Port
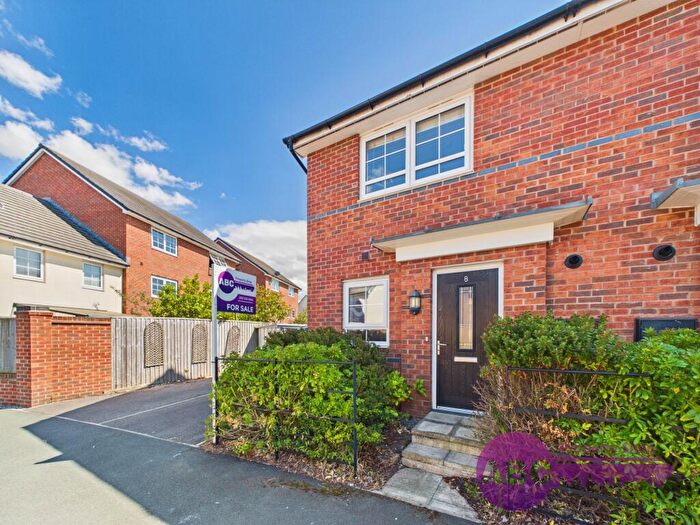
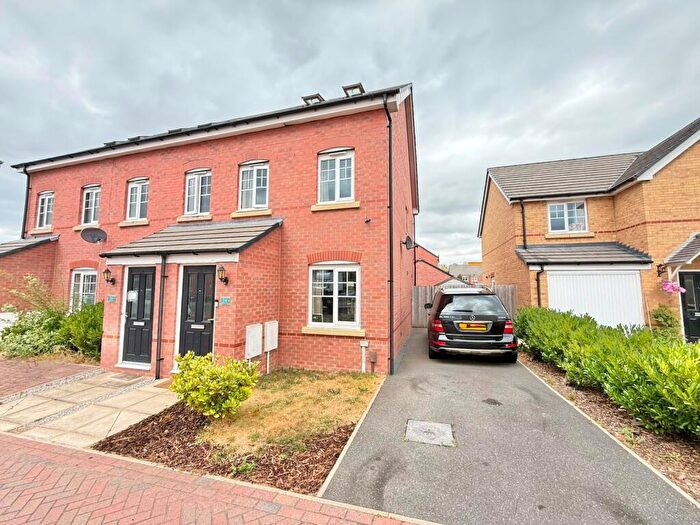
![]()
If you are looking to sell your house, let it out, or receive a property valuation, an expert can help you.
Click the button below to get started.

Neighbourhoods in Ellesmere Port
Navigate through our locations to find the location of your next house in Ellesmere Port, Cheshire for sale or to rent.
- Ellesmere Port Town
- Grange
- Ledsham And Manor
- Little Neston And Burton
- Netherpool
- Rossmore
- Saughall And Mollington
- St Pauls
- Strawberry
- Sutton
- Whitby
- Willaston And Thornton
- Central & Grange
- Westminster
- Gowy Rural
- Wolverham
- Whitby Park
- Whitby Groves
- Saughall & Mollington
- Willaston & Thornton
- Sutton Villages
- Ledsham & Manor
Property price trends in Ellesmere Port
According to the latest Land Registry data, the average home in Ellesmere Port sold for £210,961 in 2026. That figure comes from a substantial record of 29,315 sales logged over the past 31 years.
Prices have moved up over the last three years. Compared with 2023, when the typical sale came in around £200,783, that's a rise of roughly 5.1%.
Looking back five years, average prices are up about 11.3% since 2021, a gain of around £21,346 in cash terms.
Zoom out to the past decade for the fuller picture. Back in 2016, homes here averaged £153,834, so the typical sold price has climbed about 37.1% since then, roughly 3.2% a year. Stretch the view to fifteen years and that annual pace eases back to about 3%.
Frequently asked questions about Ellesmere Port
What is the average price for a property for sale in Ellesmere Port?
The average price for a property for sale in Ellesmere Port is £207,578. This amount is 36% lower than the average price in Cheshire. There are 4,823 property listings for sale in Ellesmere Port.
What locations have the most expensive properties for sale in Ellesmere Port?
The locations with the most expensive properties for sale in Ellesmere Port are Saughall & Mollington at an average of £640,000, Saughall And Mollington at an average of £616,873 and Little Neston And Burton at an average of £590,000.
What locations have the most affordable properties for sale in Ellesmere Port?
The locations with the most affordable properties for sale in Ellesmere Port are Sutton Villages at an average of £98,600, Wolverham at an average of £116,875 and Ellesmere Port Town at an average of £130,481.
Which train stations are available in or near Ellesmere Port?
Some of the train stations available in or near Ellesmere Port are Overpool, Ellesmere Port and Little Sutton.
Property Price Paid in Ellesmere Port by Year
The average sold property price by year was:
| Year | Average Sold Price | Price Change |
Sold Properties
|
|---|---|---|---|
| 2026 | £210,961 | -2% |
42 Properties |
| 2025 | £214,409 | 3% |
824 Properties |
| 2024 | £207,519 | 3% |
853 Properties |
| 2023 | £200,783 | 2% |
842 Properties |
| 2022 | £197,443 | 4% |
940 Properties |
| 2021 | £189,615 | 5% |
1,146 Properties |
| 2020 | £180,229 | 6% |
930 Properties |
| 2019 | £169,895 | 3% |
1,191 Properties |
| 2018 | £164,923 | -1% |
1,120 Properties |
| 2017 | £166,401 | 8% |
1,101 Properties |
Property Price per Property Type in Ellesmere Port
Here you can find historic sold price data in order to help with your property search.
The average Property Paid Price for specific property types in the last three years are:
| Property Type | Average Sold Price | Sold Properties |
|---|---|---|
| Semi Detached House | £201,677.00 | 1,163 Semi Detached Houses |
| Terraced House | £148,939.00 | 685 Terraced Houses |
| Detached House | £327,069.00 | 543 Detached Houses |
| Flat | £102,552.00 | 170 Flats |
Transport in Ellesmere Port
Please see below transportation links in this area:
