Houses for sale & to rent in Gowy, Frodsham
House Prices in Gowy
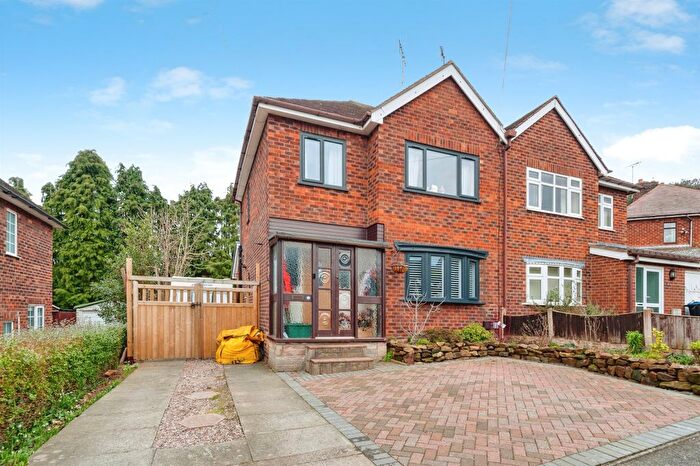
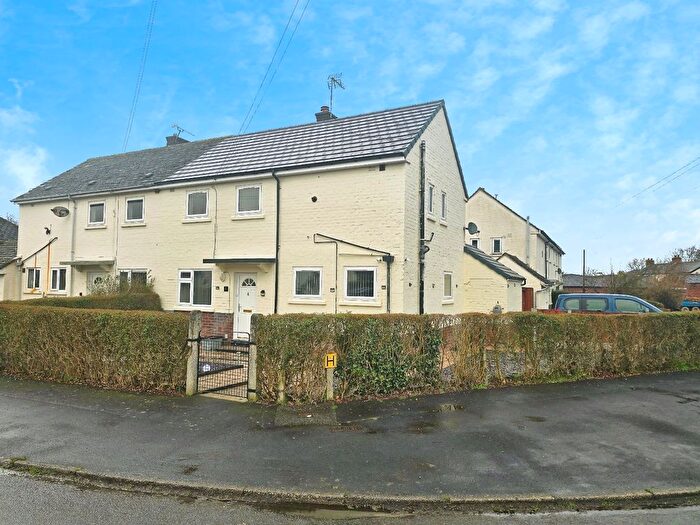
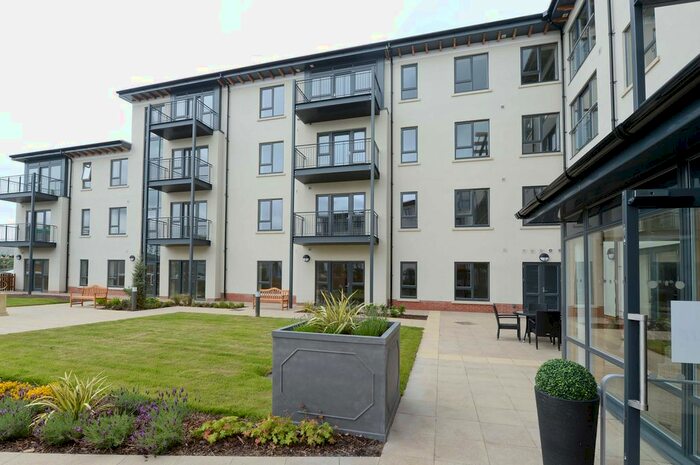
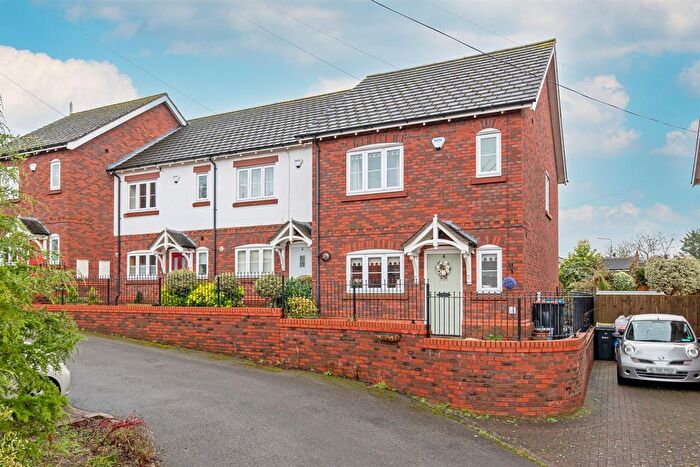
Properties in Gowy have an average house price of £371,122.00 and had 50 Property Transactions within the last 3 years¹.
Gowy is an area in Frodsham, Cheshire with 523 households², where the most expensive property was sold for £1,395,000.00.
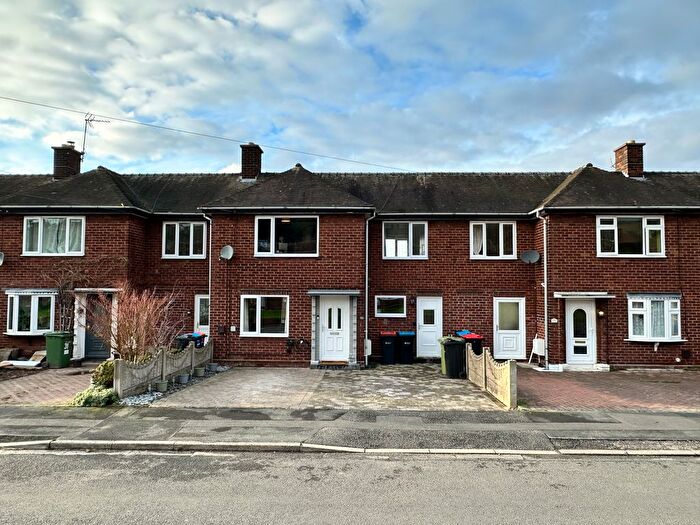
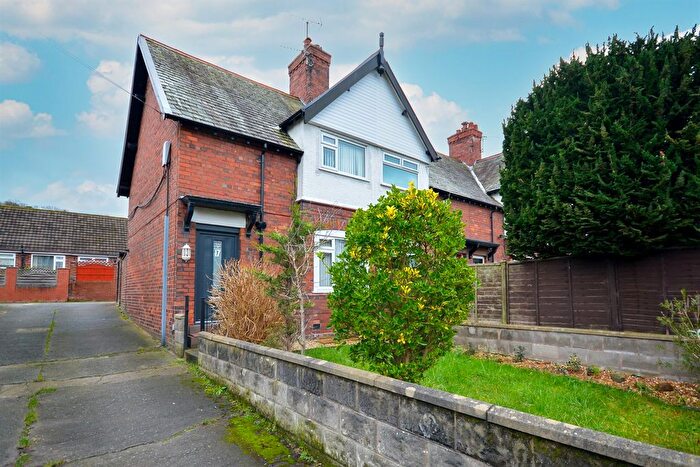
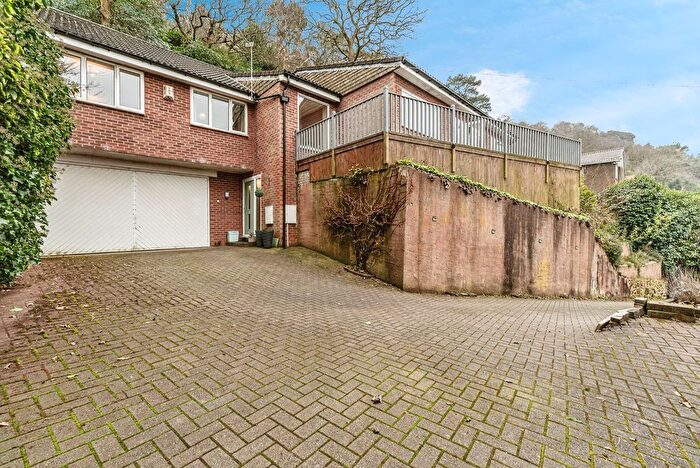
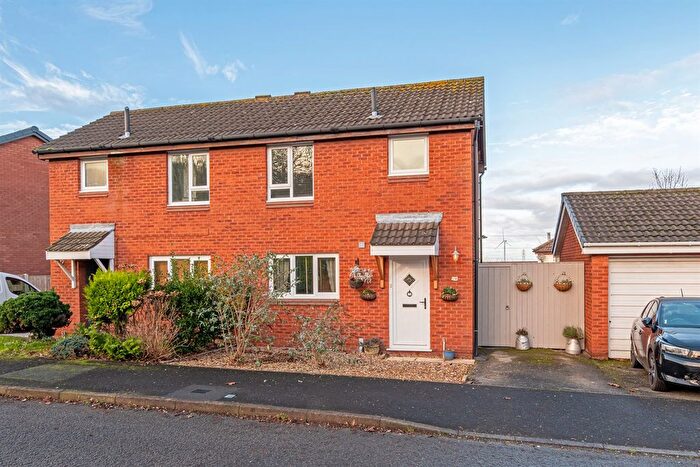
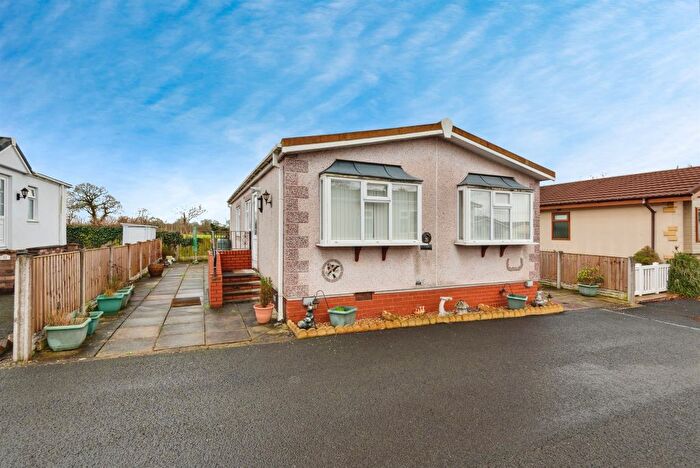
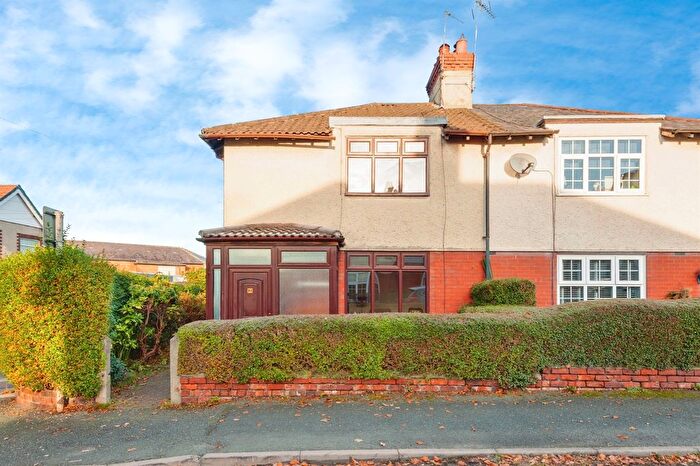
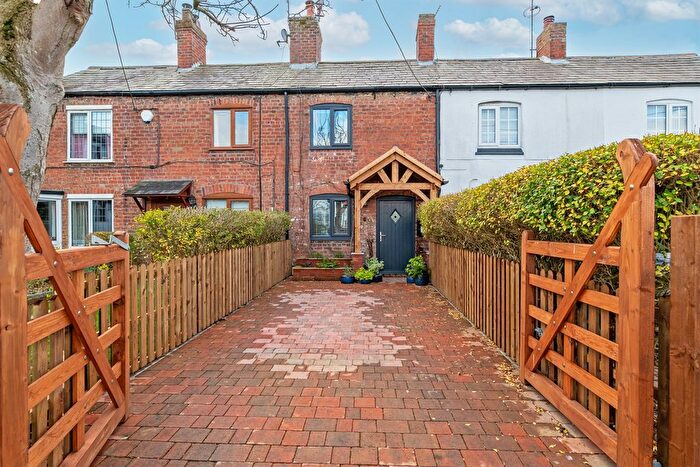
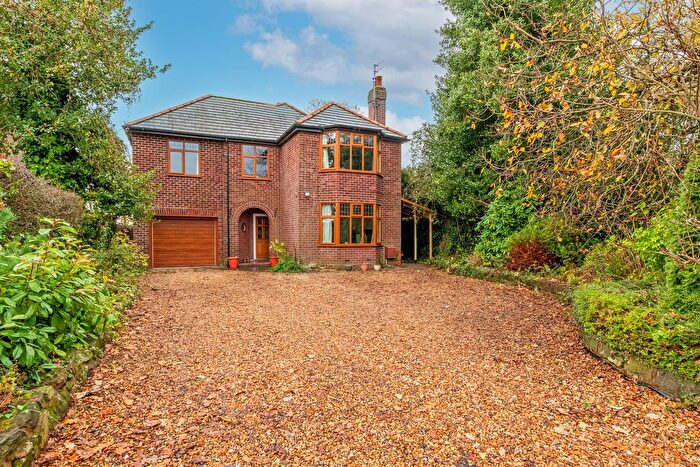
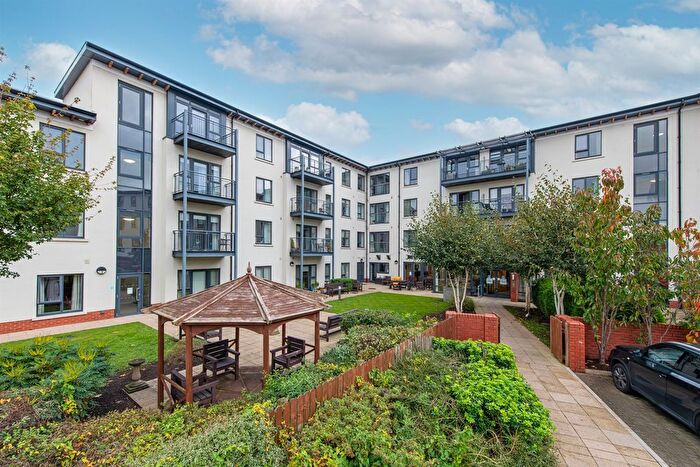
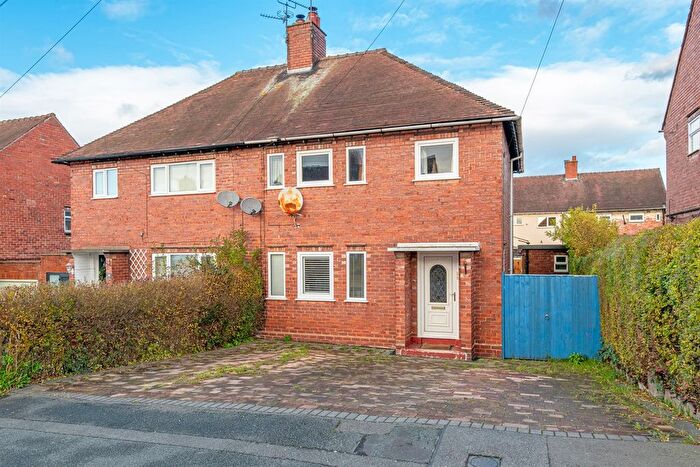
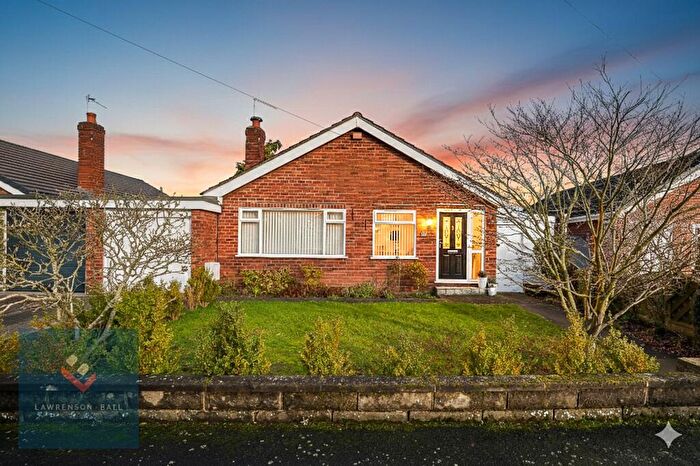
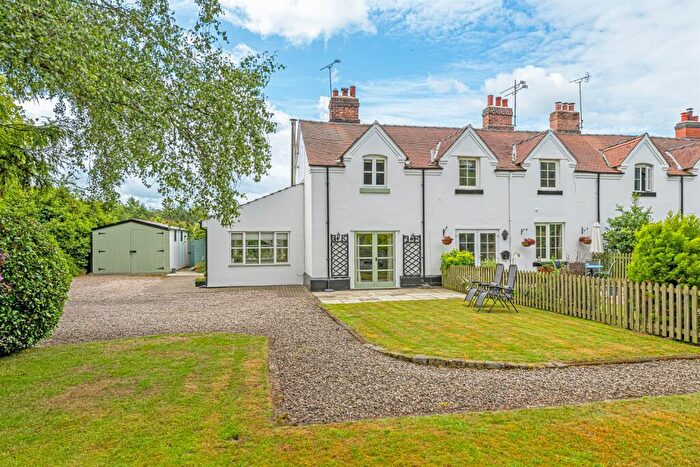
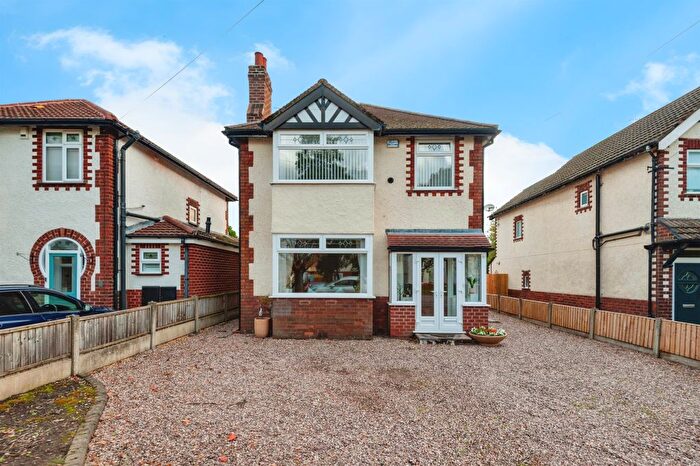
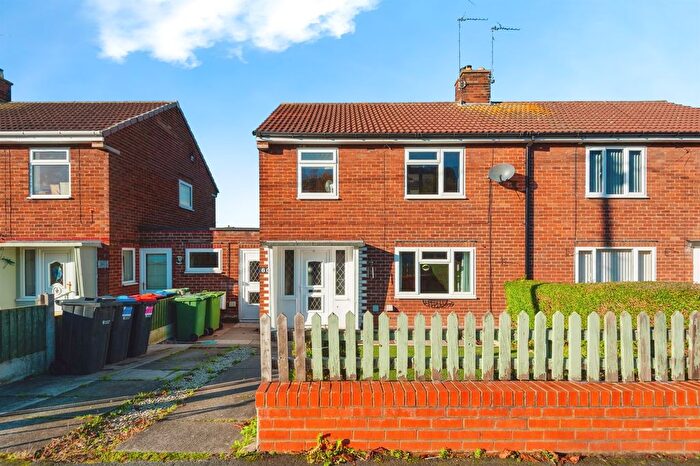
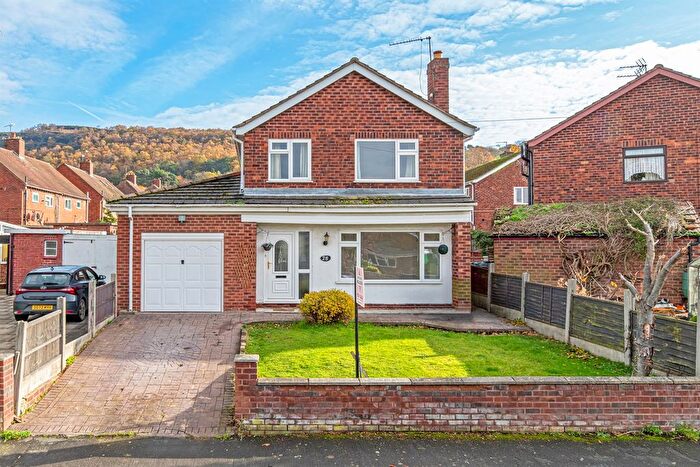
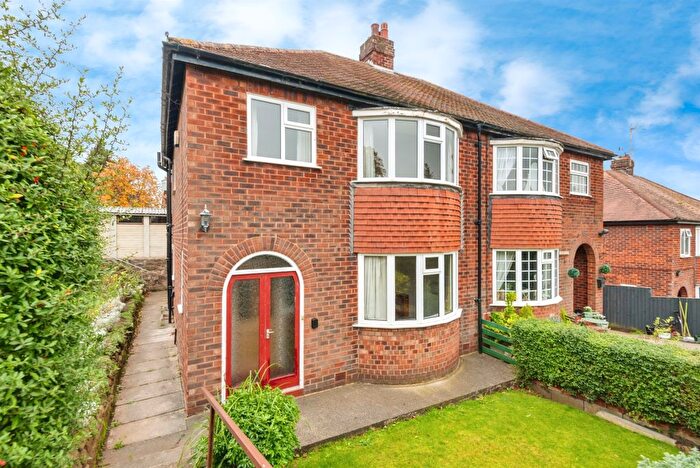
Properties for sale in Gowy
Roads and Postcodes in Gowy
Navigate through our locations to find the location of your next house in Gowy, Frodsham for sale or to rent.
| Streets | Postcodes |
|---|---|
| Alvanley Road | WA6 9BL WA6 9QF |
| Ardern Lea | WA6 9EQ |
| Back Lane | WA6 9AN WA6 9AW WA6 9BJ |
| Burrows Lane | WA6 6XG |
| Bushells Lane | WA6 6HX |
| Chapel Lane | WA6 9JQ |
| Chester Road | WA6 0JG WA6 0JL WA6 0JQ WA6 0LL WA6 0NX |
| Churchway | WA6 9BZ |
| Cob Hall Lane | WA6 9HH |
| Commonside | WA6 9HB WA6 9HD |
| Crossley Park | WA6 6JG |
| Dale Croft | WA6 0JX |
| Dark Ark Lane | WA6 9EE WA6 9EG |
| Dunham Court | WA6 0NH |
| Dunham On The Hill | WA6 0LT WA6 0LU WA6 0LX WA6 0ND WA6 0NG WA6 0NJ WA6 0NL WA6 0NN |
| Frodsham Road | WA6 9BY WA6 9DA WA6 9DB |
| Hapsford Lane | WA6 0JP WA6 0JR |
| Helsby Road | WA6 9BP WA6 9BU WA6 9FH |
| Hob Lane | WA6 0LW |
| Kingswood Park | WA6 6EH WA6 6EJ |
| Manley Common | WA6 9EP WA6 9ET |
| Manley Lane | WA6 0PA WA6 0PD WA6 9JA |
| Manley Quarry | WA6 9HU WA6 9HZ |
| Manley Road | WA6 6HT WA6 9DE WA6 9DF WA6 9DL WA6 9DN WA6 9DR WA6 9ED |
| Moor Lane | WA6 0JA WA6 0JU WA6 0JY WA6 0JZ |
| Moss Drive | WA6 9JJ |
| Moss Lane | WA6 9JH WA6 9JL WA6 9JN |
| Nemos Close | WA6 9QG |
| New Pale Cottages | WA6 9EU |
| New Pale Road | WA6 6JF |
| Peck Mill Lane | WA6 0LJ |
| Post Office Cottages | WA6 0LY |
| Primrose Lane | WA6 9BS |
| Quarry Lane | WA6 9HY |
| Rangeway Bank Cottages | WA6 9ES |
| Sugar Lane | WA6 9DZ WA6 9HR |
| Talbot Road | WA6 0JW |
| Tarvin Road | WA6 9AL WA6 9EL WA6 9EW |
| The Rock | WA6 9AP |
Transport near Gowy
- FAQ
- Price Paid By Year
- Property Type Price
Frequently asked questions about Gowy
What is the average price for a property for sale in Gowy?
The average price for a property for sale in Gowy is £371,122. This amount is 11% higher than the average price in Frodsham. There are 583 property listings for sale in Gowy.
What streets have the most expensive properties for sale in Gowy?
The streets with the most expensive properties for sale in Gowy are Moss Lane at an average of £947,000, Manley Common at an average of £725,000 and Manley Road at an average of £658,875.
What streets have the most affordable properties for sale in Gowy?
The streets with the most affordable properties for sale in Gowy are Moss Drive at an average of £100,000, Talbot Road at an average of £223,250 and Hob Lane at an average of £235,000.
Which train stations are available in or near Gowy?
Some of the train stations available in or near Gowy are Helsby, Mouldsworth and Ince and Elton.
Property Price Paid in Gowy by Year
The average sold property price by year was:
| Year | Average Sold Price | Price Change |
Sold Properties
|
|---|---|---|---|
| 2025 | £375,769 | -6% |
13 Properties |
| 2024 | £396,538 | 13% |
17 Properties |
| 2023 | £346,498 | -38% |
20 Properties |
| 2022 | £476,804 | 11% |
23 Properties |
| 2021 | £425,455 | -2% |
36 Properties |
| 2020 | £433,333 | 27% |
12 Properties |
| 2019 | £316,052 | -37% |
19 Properties |
| 2018 | £432,400 | 9% |
21 Properties |
| 2017 | £392,997 | 19% |
24 Properties |
| 2016 | £317,607 | 9% |
19 Properties |
| 2015 | £288,632 | -18% |
28 Properties |
| 2014 | £340,236 | 10% |
38 Properties |
| 2013 | £306,293 | 6% |
17 Properties |
| 2012 | £286,622 | 5% |
20 Properties |
| 2011 | £271,265 | -5% |
28 Properties |
| 2010 | £284,512 | 13% |
20 Properties |
| 2009 | £248,058 | -3% |
22 Properties |
| 2008 | £255,466 | -75% |
35 Properties |
| 2007 | £446,925 | 8% |
20 Properties |
| 2006 | £410,976 | 0,1% |
21 Properties |
| 2005 | £410,656 | 33% |
16 Properties |
| 2004 | £273,458 | -24% |
12 Properties |
| 2003 | £338,191 | 27% |
23 Properties |
| 2002 | £245,731 | -0,2% |
22 Properties |
| 2001 | £246,124 | -23% |
14 Properties |
| 2000 | £303,188 | 39% |
18 Properties |
| 1999 | £184,116 | 25% |
21 Properties |
| 1998 | £137,966 | 16% |
9 Properties |
| 1997 | £115,375 | 3% |
12 Properties |
| 1996 | £112,163 | -13% |
19 Properties |
| 1995 | £127,068 | - |
22 Properties |
Property Price per Property Type in Gowy
Here you can find historic sold price data in order to help with your property search.
The average Property Paid Price for specific property types in the last three years are:
| Property Type | Average Sold Price | Sold Properties |
|---|---|---|
| Semi Detached House | £282,722.00 | 11 Semi Detached Houses |
| Detached House | £584,375.00 | 18 Detached Houses |
| Terraced House | £268,285.00 | 7 Terraced Houses |
| Flat | £217,815.00 | 14 Flats |

