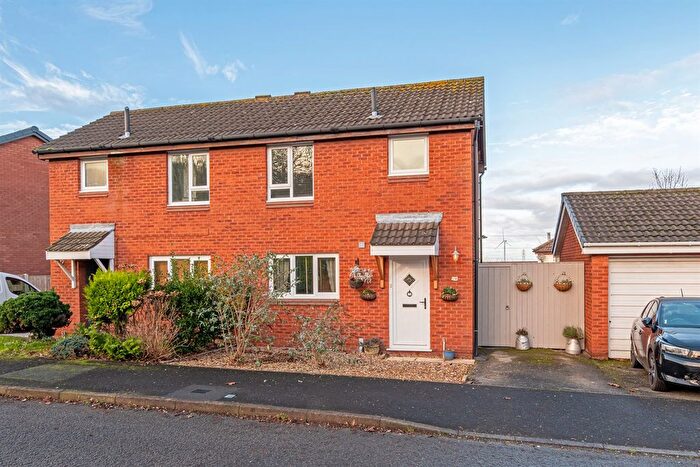
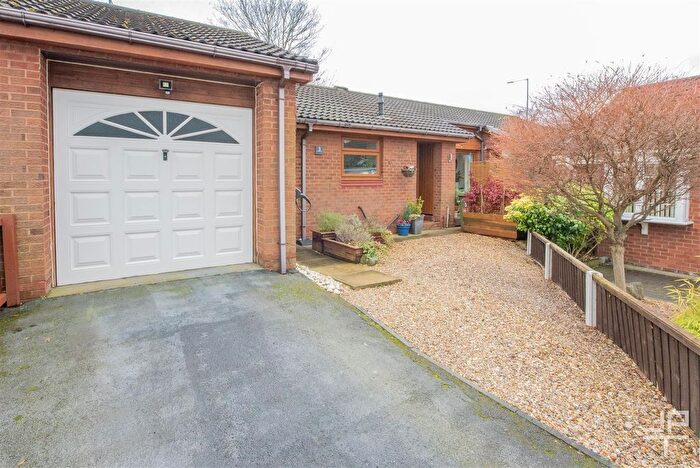
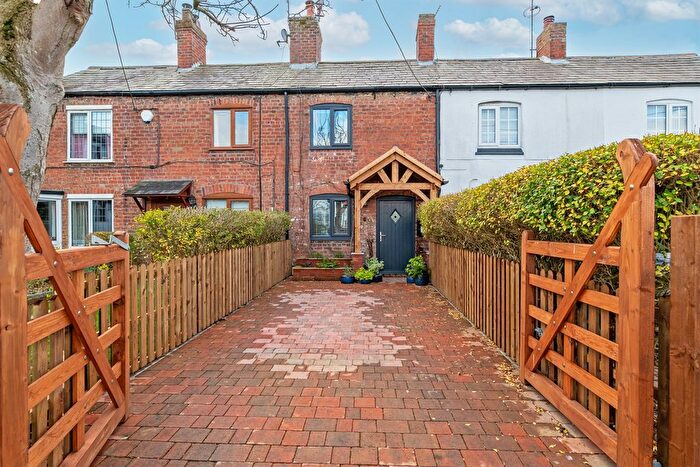
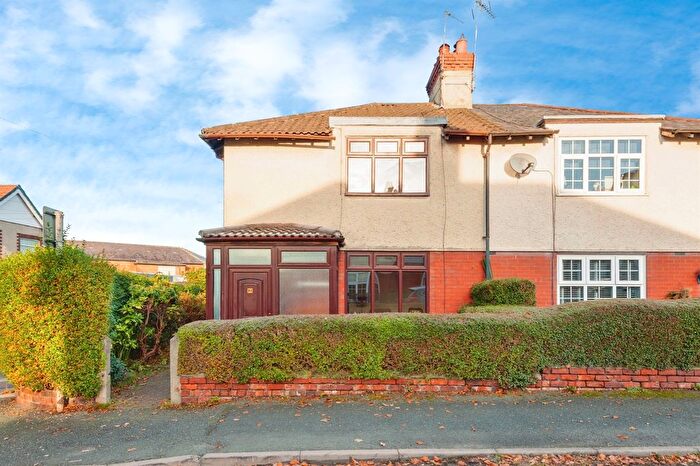
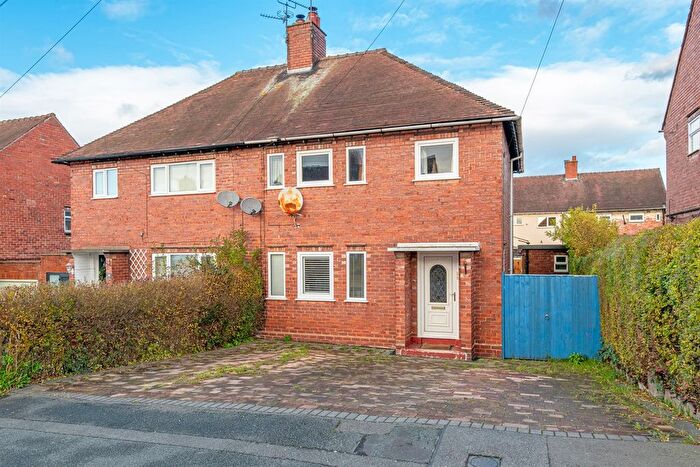
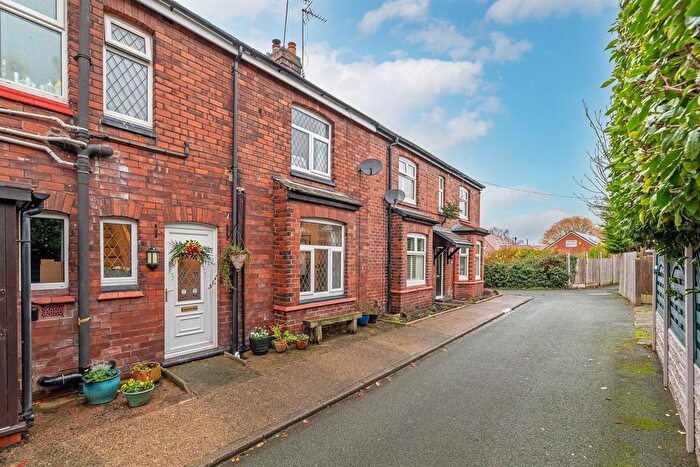
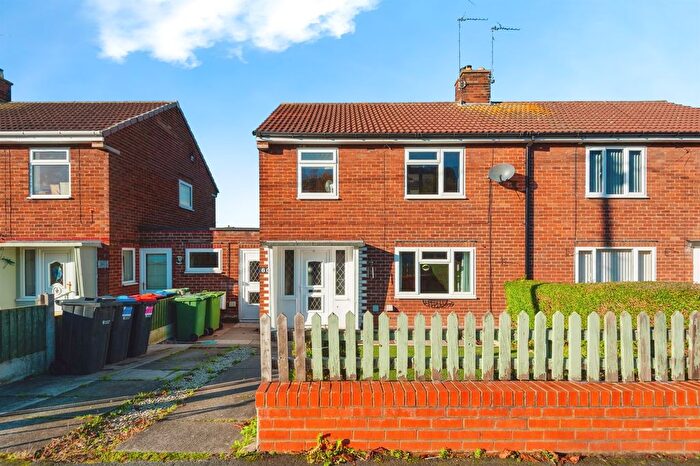
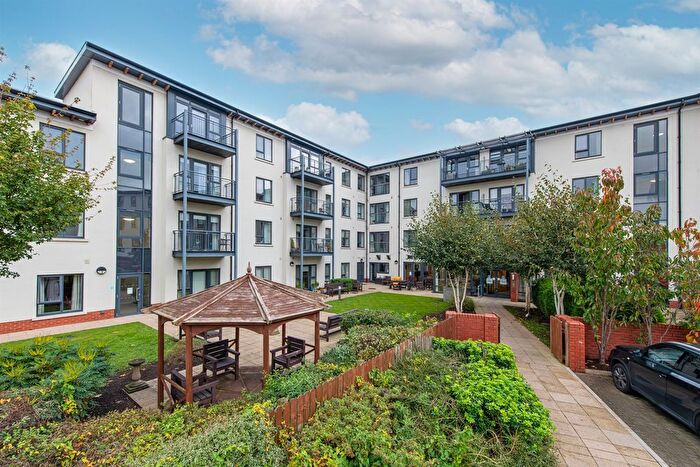
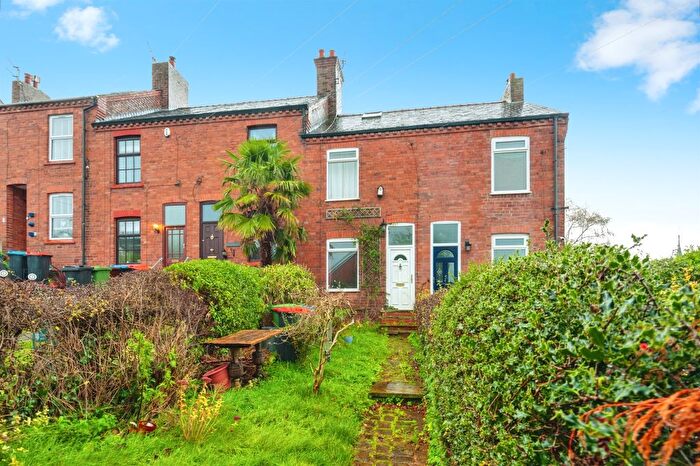
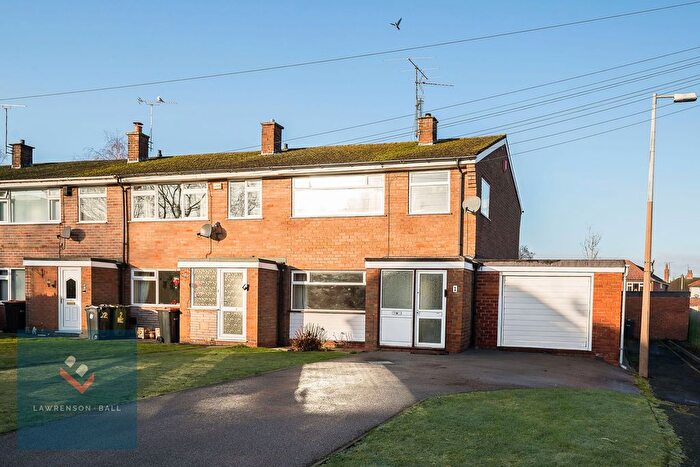
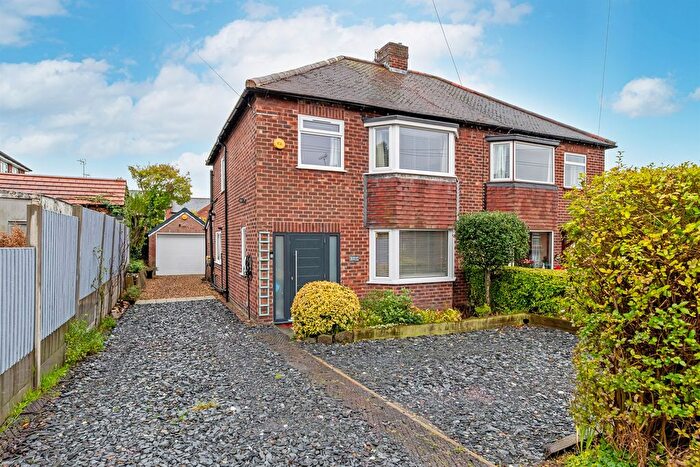
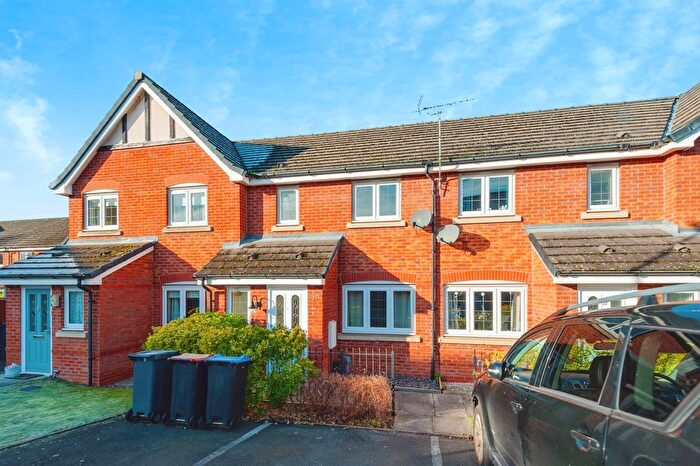
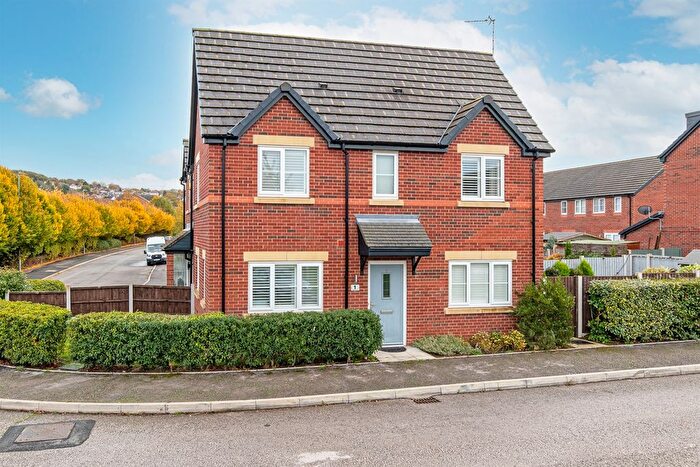
Houses for sale & to rent in Helsby, Frodsham
House Prices in Helsby
Properties in Helsby have an average house price of £273,725.00 and had 256 Property Transactions within the last 3 years¹.
Helsby is an area in Frodsham, Cheshire with 2,134 households², where the most expensive property was sold for £830,000.00.
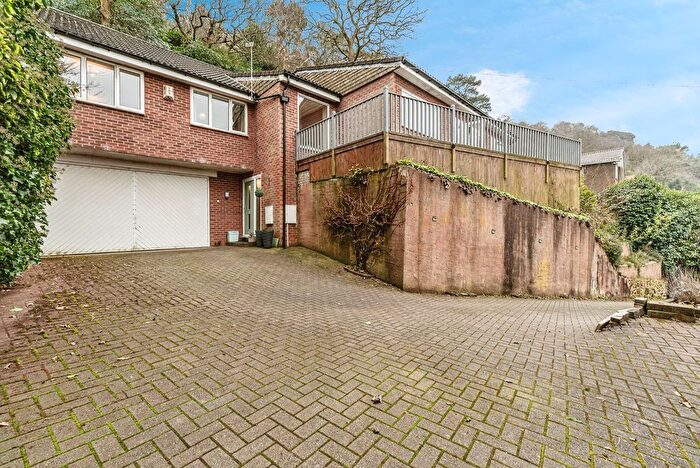
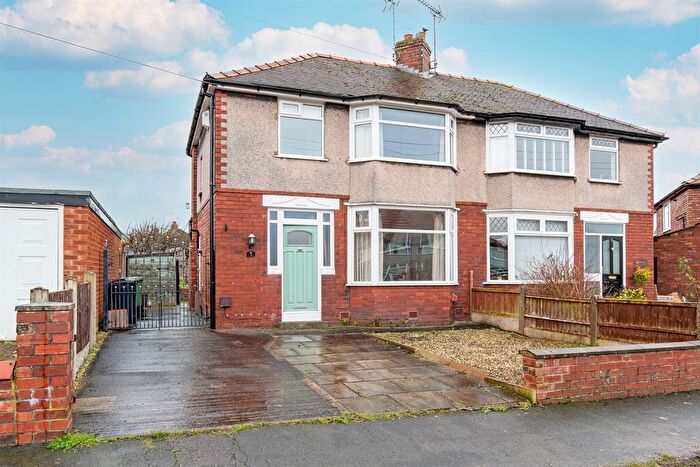
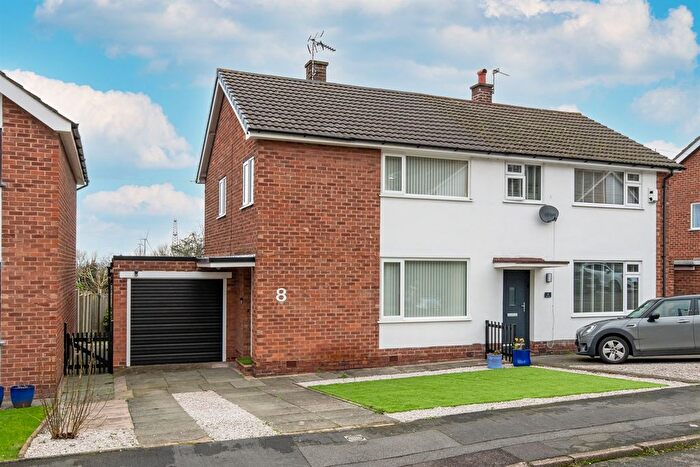
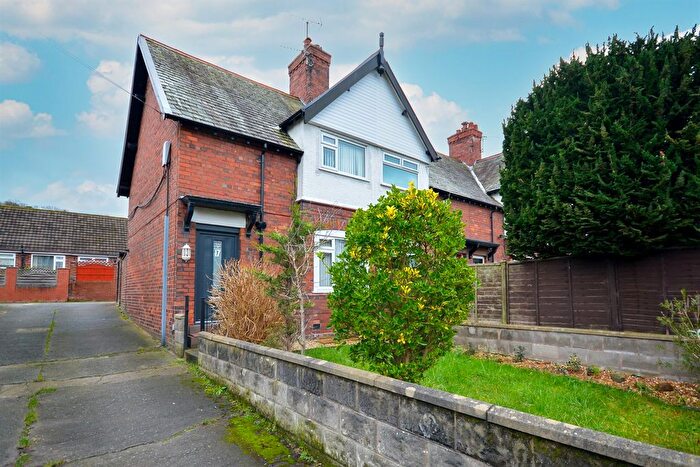
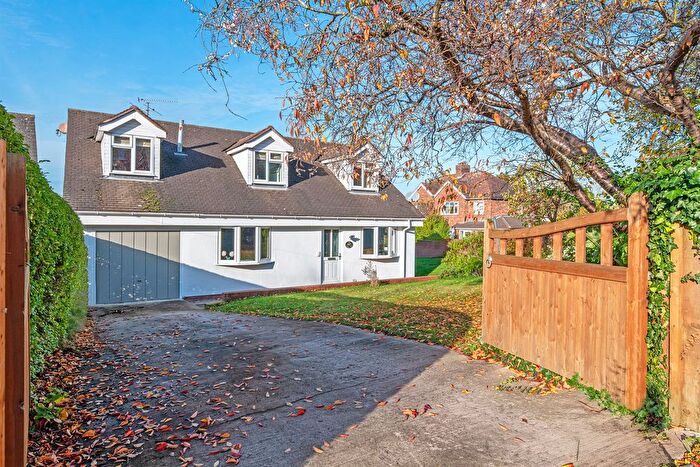
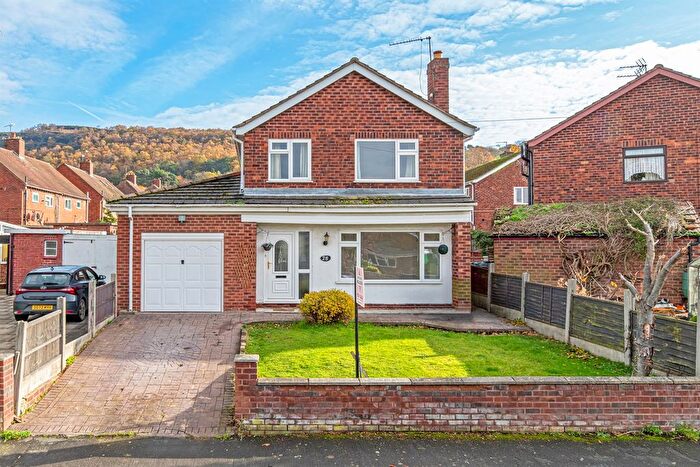
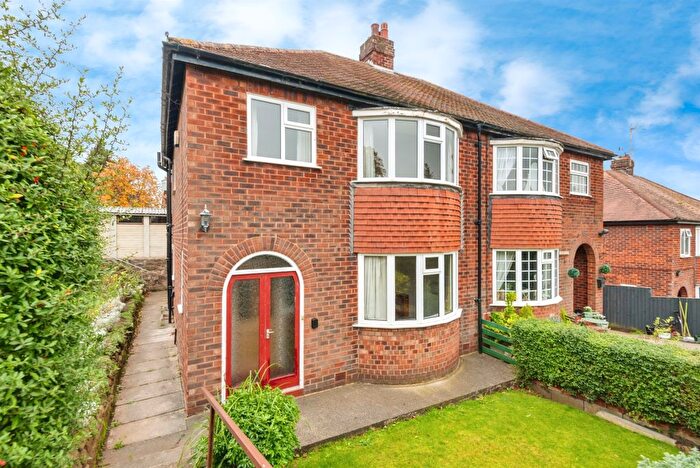
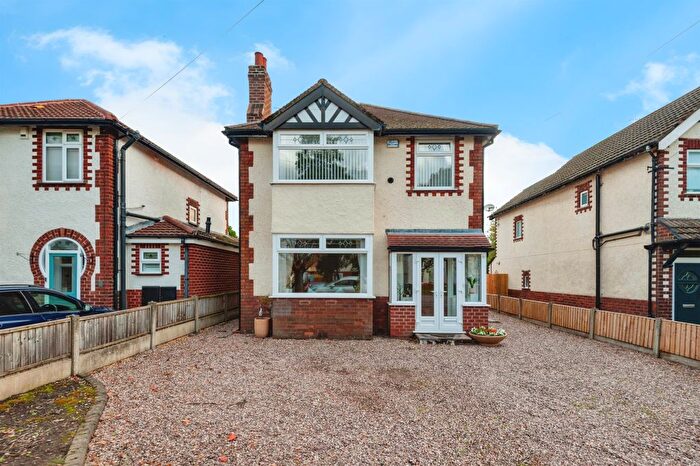
Properties for sale in Helsby
Previously listed properties in Helsby
Roads and Postcodes in Helsby
Navigate through our locations to find the location of your next house in Helsby, Frodsham for sale or to rent.
| Streets | Postcodes |
|---|---|
| Alvanley Drive | WA6 9QE |
| Alvanley Road | WA6 9PS WA6 9PU WA6 9PX WA6 9QD |
| Arbour Walk | WA6 0FN |
| Back Crossland Terrace | WA6 9LZ |
| Balmoral Drive | WA6 0AJ |
| Bank House Lane | WA6 0PS |
| Bank Mews | WA6 0PP |
| Barlow Drive | WA6 0AA |
| Barn Croft | WA6 0PJ |
| Bates Lane | WA6 9LE WA6 9LF WA6 9LH WA6 9LJ WA6 9LL WA6 9LN WA6 9AJ |
| Beech Tree Walk | WA6 9QA |
| Blue Bridge Lane | WA6 0HX |
| Bramley Walk | WA6 0EL |
| Bridgeside Drive | WA6 0BS |
| Britannia Gardens | WA6 0DT |
| Britannia Road | WA6 0DP |
| Cable Drive | WA6 0EH WA6 0FP WA6 0FW |
| Callender Gardens | WA6 0FF |
| Callender Way | WA6 0FX |
| Cambridge Gardens | WA6 9LW |
| Chapel View | WA6 0DN |
| Chester Road | WA6 0AD WA6 0AN WA6 0AP WA6 0AQ WA6 0AR WA6 0AS WA6 0AT WA6 0AU WA6 0AW WA6 0DA WA6 0DL WA6 0DW WA6 0EZ WA6 0PN WA6 0PW WA6 0PX WA6 0PY WA6 0QJ WA6 0QS WA6 0QT WA6 0QZ WA6 9NN WA6 0AB WA6 0DJ WA6 0HY WA6 0HZ WA6 0JD WA6 0PT |
| Churchfields | WA6 0QB |
| Conery Close | WA6 9PJ |
| Coppins Close | WA6 9QL |
| Crescent Drive | WA6 9QH WA6 9QQ WA6 9QN |
| Croft Road | WA6 0FT |
| Crosland Drive | WA6 0FJ |
| Crossland Terrace | WA6 9LY |
| Denbigh Close | WA6 0ED WA6 0EF |
| Dixon Drive | WA6 0FS |
| Dove Close | WA6 0QD |
| Faraday Close | WA6 0GA |
| Foxhill Grove | WA6 9LQ |
| Freshmeadow Lane | WA6 0QU |
| George Close | WA6 0FL |
| Greenway Close | WA6 0QX |
| Grove Bank | WA6 0QQ |
| Grove Terrace | WA6 0QG |
| Hale View Road | WA6 9PH |
| Hallastone Road | WA6 0PR |
| Hastings Drive | WA6 0GH |
| Hawkstone Grove | WA6 9PD |
| Helsby Park Homes | WA6 6XS |
| Hemlegh Vale | WA6 0DB |
| High View | WA6 9LP |
| Hill Road North | WA6 9AF WA6 9AG WA6 9AQ WA6 9AH |
| Hill Road South | WA6 9PT |
| Hill View Avenue | WA6 0ES |
| Hillside Close | WA6 9LB |
| Holly Court | WA6 0PH |
| Homeway | WA6 0DR |
| Hornsmill Way | WA6 0DE |
| Hunters Court | WA6 9LR |
| Irondish Close | WA6 9AY |
| Kings Drive | WA6 0BB WA6 0BQ |
| Land Associated With | WA6 9AD |
| Landscape Dene | WA6 9LG |
| Latham Avenue | WA6 0DY WA6 0EA WA6 0EB WA6 0EG WA6 0ER WA6 0DX WA6 0EU |
| Linden Drive | WA6 0DZ |
| Lionheart Court | WA6 0FR |
| Lodge Hollow | WA6 0BX |
| Longster Close | WA6 0QP |
| Lower Rake Lane | WA6 0HS WA6 0AH WA6 0HT WA6 0HU |
| Lower Robin Hood Lane | WA6 0BN WA6 0BU WA6 0BW WA6 0FQ |
| Marlborough Drive | WA6 9NB |
| Meadow Close | WA6 0QY |
| Meliden Grove | WA6 0EQ WA6 0EW |
| Mere View | WA6 0FG |
| Mill Rise | WA6 0PL |
| Milton Grove | WA6 0EN |
| Morton Avenue | WA6 0EP |
| Mountain View | WA6 0BA WA6 0BD WA6 0BE WA6 0BG WA6 0BH WA6 0BJ |
| Neston Close | WA6 0FH |
| Newfield Terrace | WA6 9NE |
| Old Chester Road | WA6 9JY WA6 9JZ WA6 9LA WA6 9NR WA6 9NW WA6 9PG WA6 9PL WA6 9PN WA6 9PQ WA6 9PW WA6 9NP |
| Old School Court | WA6 0QF |
| Orchard Place | WA6 0QE |
| Parker Drive | WA6 0FU |
| Parkfield Drive | WA6 0BL |
| Plovers Lane | WA6 0QA |
| Portland Place | WA6 9LD |
| Priestner Drive | WA6 0AE |
| Primrose Lane | WA6 0HF WA6 0HH WA6 0HJ |
| Proffits Lane | WA6 9JX |
| Pyrus Grove | WA6 0PQ |
| Queens Drive | WA6 0AX WA6 0AY WA6 0AZ |
| Rake House Mews | WA6 0AL |
| Rake Lane | WA6 9PA |
| Red Stone Hill | WA6 9PE |
| Robin Hood Lane | WA6 0DS WA6 0DU WA6 0EX WA6 0EY WA6 9ND WA6 9NF WA6 9NG WA6 9NH WA6 9NJ WA6 9NL |
| Rockfield Drive | WA6 9AR |
| Ruthin Walk | WA6 0EE |
| Rydal Grove | WA6 0ET |
| Saddler Close | WA6 0GB |
| Sandringham Avenue | WA6 9QJ |
| Sandy Lane | WA6 9BD |
| School Close | WA6 9AU |
| Sherwood Grove | WA6 0BF |
| Smithy Lane | WA6 0PU |
| Springfield Avenue | WA6 0BZ |
| Station Avenue | WA6 0AG |
| Stephens Grove | WA6 9NQ |
| Swireford Road | WA6 9BA |
| Tarvin Road | WA6 6XH WA6 6XL |
| Telegraph Way | WA6 0FY |
| The Beeches | WA6 0QL |
| The Heights | WA6 9PF |
| The Orchard | WA6 0QW |
| The Paddock | WA6 9PY |
| The Rock | WA6 9AS WA6 9BB WA6 9BQ |
| Umpire Close | WA6 0GS |
| Vale Gardens | WA6 0BT |
| Vicarage Lane | WA6 9AE WA6 9AB |
| Windsor Drive | WA6 9NA |
| Woodford Close | WA6 9BE |
| Woodhouse Close | WA6 9AX |
| Wroxham Close | WA6 0PZ |
| WA6 0FZ |
Transport near Helsby
- FAQ
- Price Paid By Year
- Property Type Price
Frequently asked questions about Helsby
What is the average price for a property for sale in Helsby?
The average price for a property for sale in Helsby is £273,725. This amount is 18% lower than the average price in Frodsham. There are 356 property listings for sale in Helsby.
What streets have the most expensive properties for sale in Helsby?
The streets with the most expensive properties for sale in Helsby are Alvanley Road at an average of £632,500, Proffits Lane at an average of £607,500 and Hillside Close at an average of £570,000.
What streets have the most affordable properties for sale in Helsby?
The streets with the most affordable properties for sale in Helsby are Springfield Avenue at an average of £68,000, Mere View at an average of £86,666 and Lionheart Court at an average of £118,000.
Which train stations are available in or near Helsby?
Some of the train stations available in or near Helsby are Helsby, Ince and Elton and Frodsham.
Property Price Paid in Helsby by Year
The average sold property price by year was:
| Year | Average Sold Price | Price Change |
Sold Properties
|
|---|---|---|---|
| 2025 | £260,175 | -9% |
74 Properties |
| 2024 | £282,859 | 3% |
93 Properties |
| 2023 | £275,447 | -3% |
89 Properties |
| 2022 | £282,411 | 14% |
88 Properties |
| 2021 | £244,104 | -1% |
115 Properties |
| 2020 | £246,056 | 10% |
73 Properties |
| 2019 | £221,936 | 7% |
129 Properties |
| 2018 | £207,418 | 6% |
112 Properties |
| 2017 | £194,493 | -2% |
153 Properties |
| 2016 | £198,234 | -5% |
105 Properties |
| 2015 | £208,619 | 6% |
127 Properties |
| 2014 | £197,115 | 24% |
95 Properties |
| 2013 | £150,269 | -12% |
59 Properties |
| 2012 | £168,304 | -8% |
67 Properties |
| 2011 | £182,319 | 3% |
62 Properties |
| 2010 | £176,591 | -2% |
48 Properties |
| 2009 | £180,063 | -1% |
53 Properties |
| 2008 | £181,718 | -13% |
82 Properties |
| 2007 | £204,918 | 13% |
133 Properties |
| 2006 | £178,317 | -5% |
117 Properties |
| 2005 | £186,431 | 5% |
111 Properties |
| 2004 | £177,423 | 15% |
98 Properties |
| 2003 | £150,262 | 11% |
115 Properties |
| 2002 | £134,409 | 30% |
105 Properties |
| 2001 | £94,643 | -11% |
100 Properties |
| 2000 | £104,787 | 26% |
87 Properties |
| 1999 | £78,034 | 10% |
110 Properties |
| 1998 | £70,184 | -2% |
96 Properties |
| 1997 | £71,526 | 9% |
71 Properties |
| 1996 | £64,935 | -6% |
92 Properties |
| 1995 | £68,703 | - |
81 Properties |
Property Price per Property Type in Helsby
Here you can find historic sold price data in order to help with your property search.
The average Property Paid Price for specific property types in the last three years are:
| Property Type | Average Sold Price | Sold Properties |
|---|---|---|
| Flat | £96,134.00 | 26 Flats |
| Semi Detached House | £250,435.00 | 80 Semi Detached Houses |
| Detached House | £387,583.00 | 90 Detached Houses |
| Terraced House | £210,950.00 | 60 Terraced Houses |

