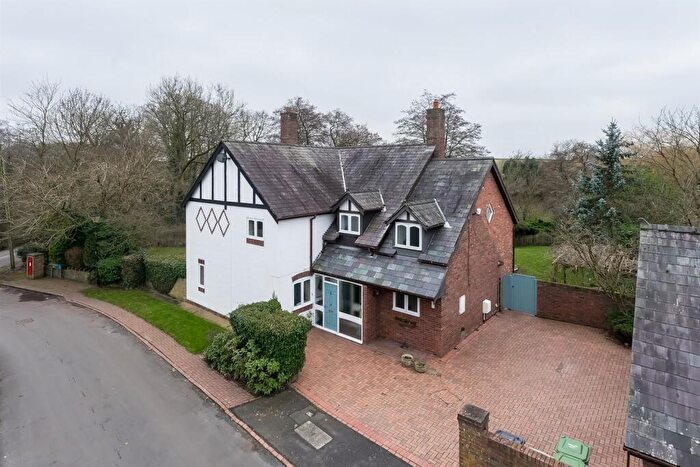
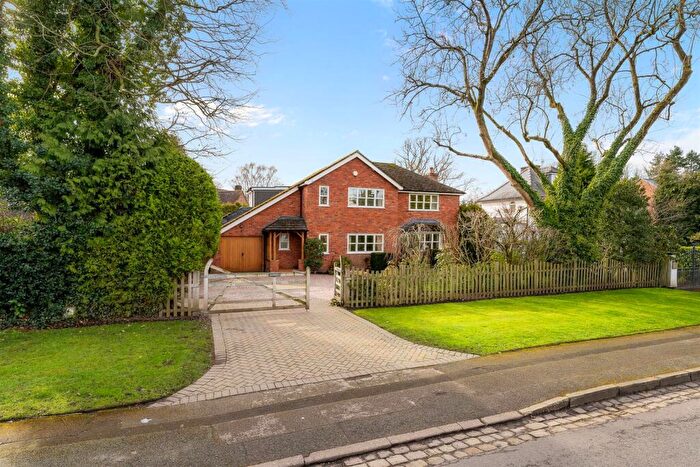
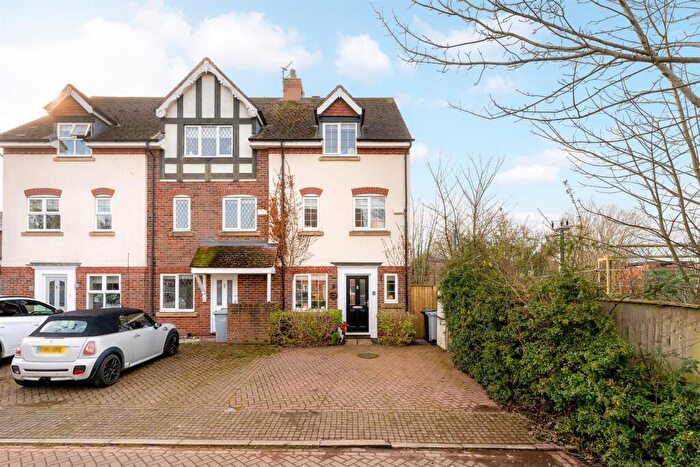
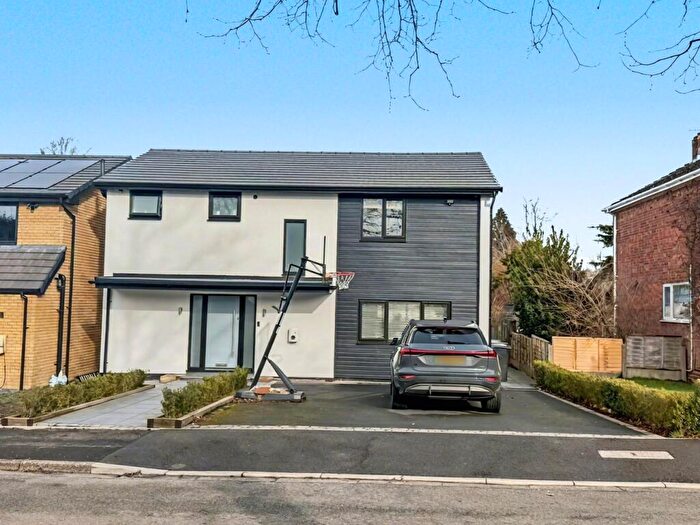
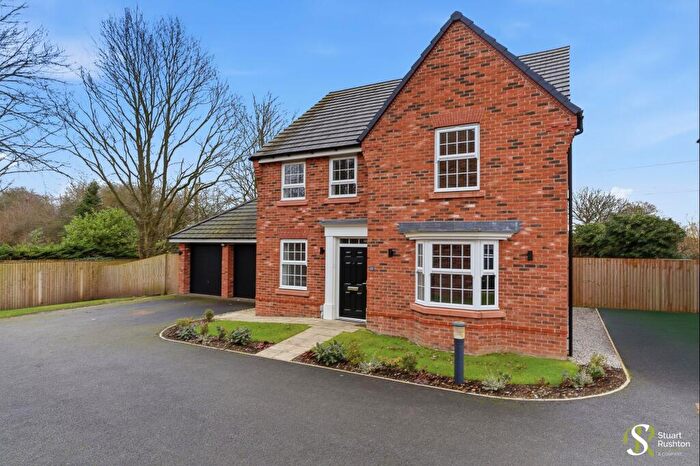
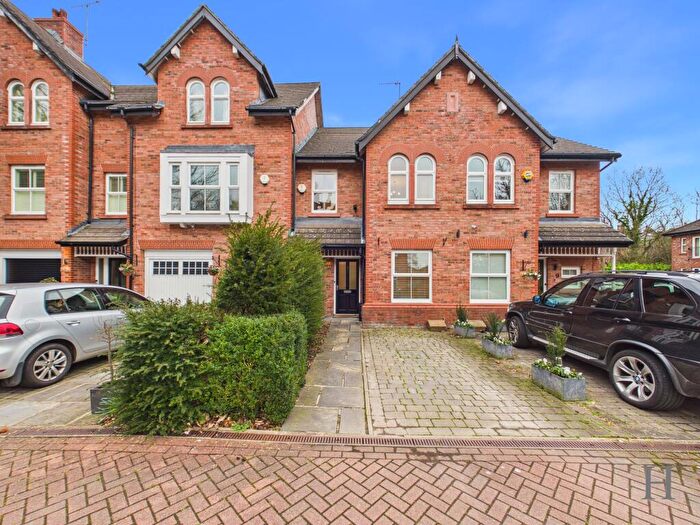
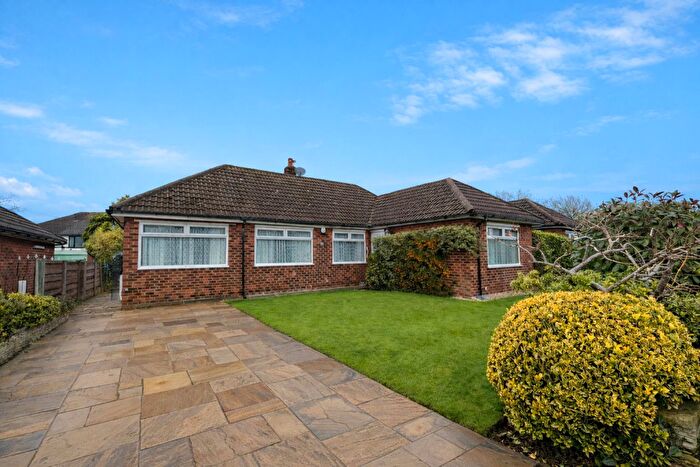
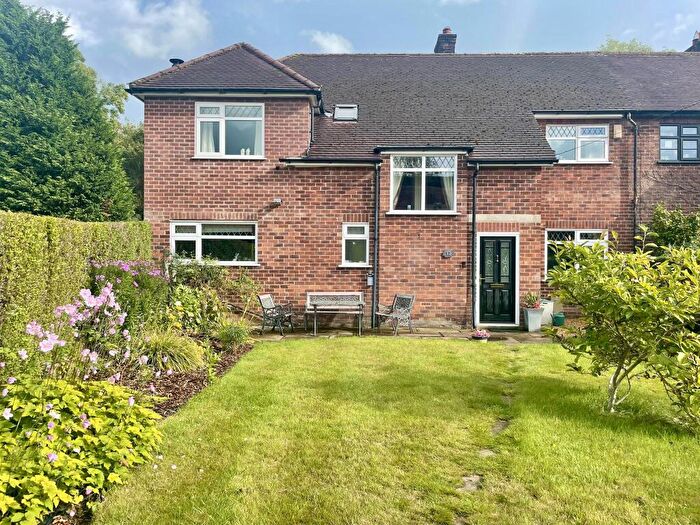
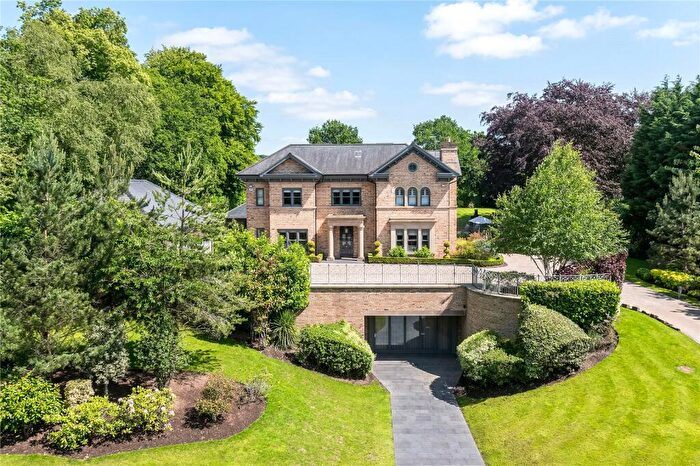
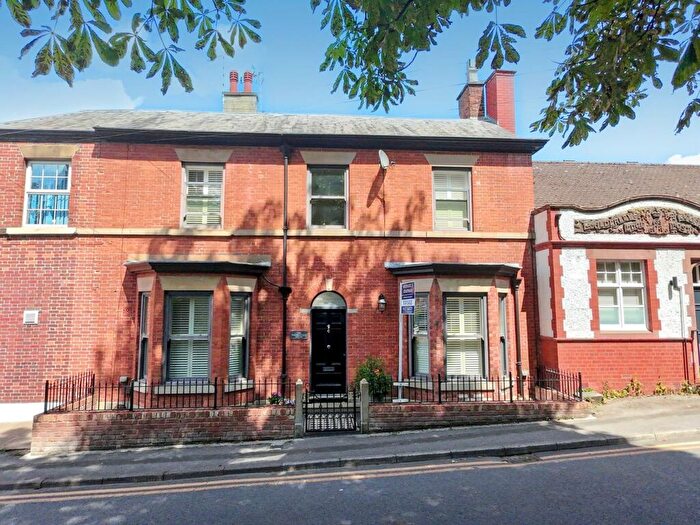
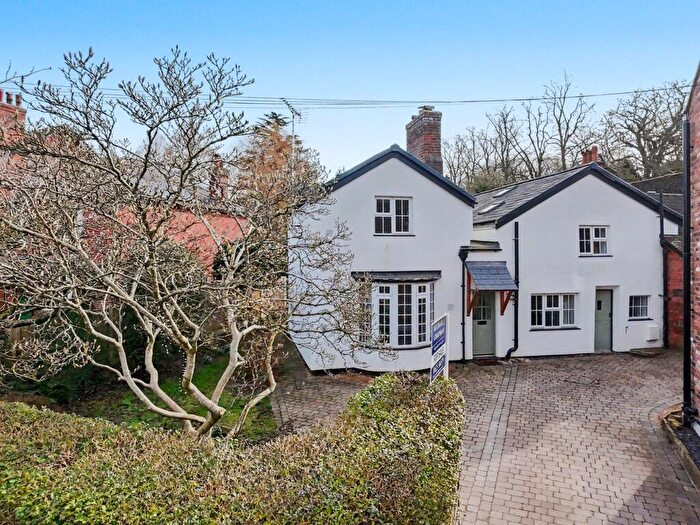
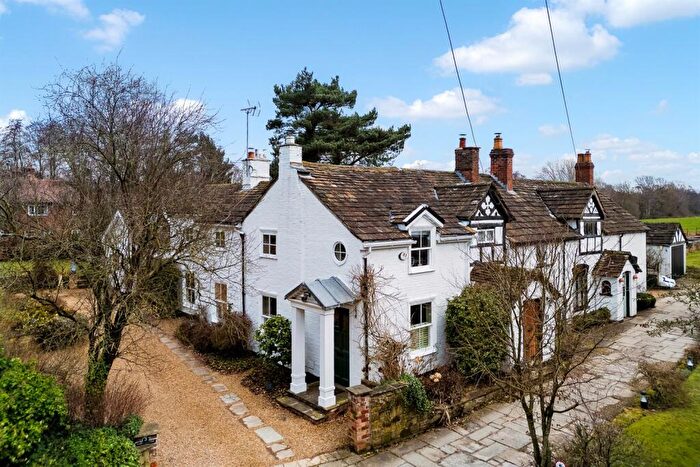
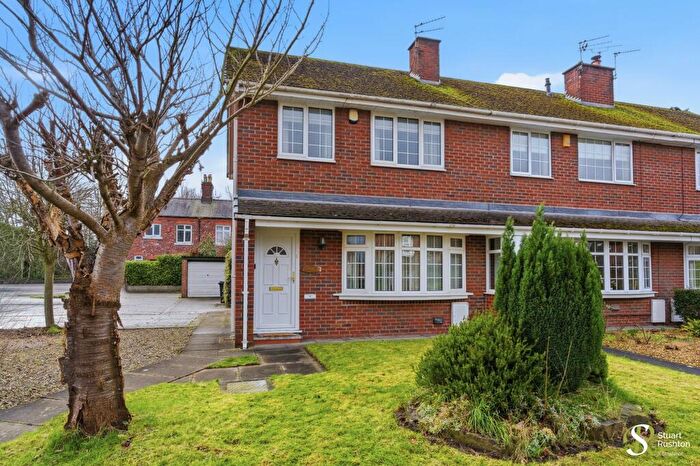
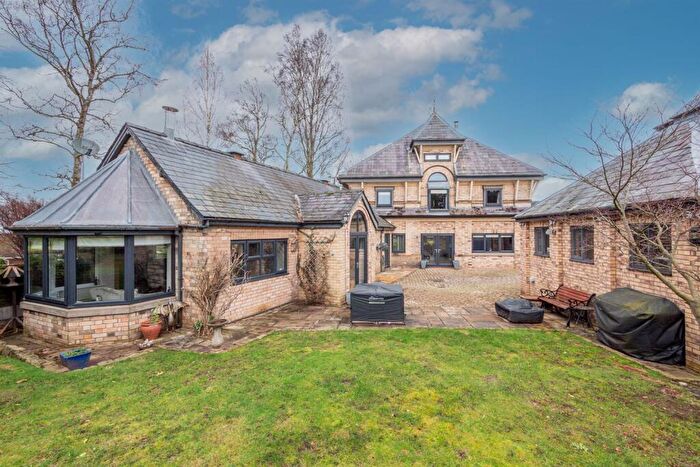
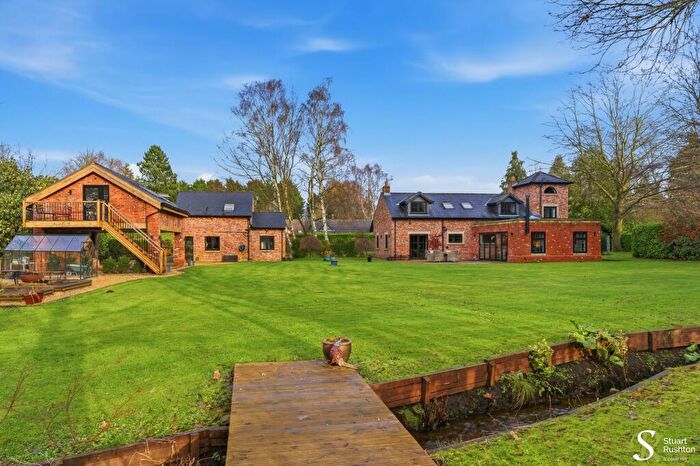
Houses for sale & to rent in Chelford, Macclesfield
House Prices in Chelford
Properties in Chelford have an average house price of £736,257.00 and had 128 Property Transactions within the last 3 years¹.
Chelford is an area in Macclesfield, Cheshire with 872 households², where the most expensive property was sold for £2,800,000.00.
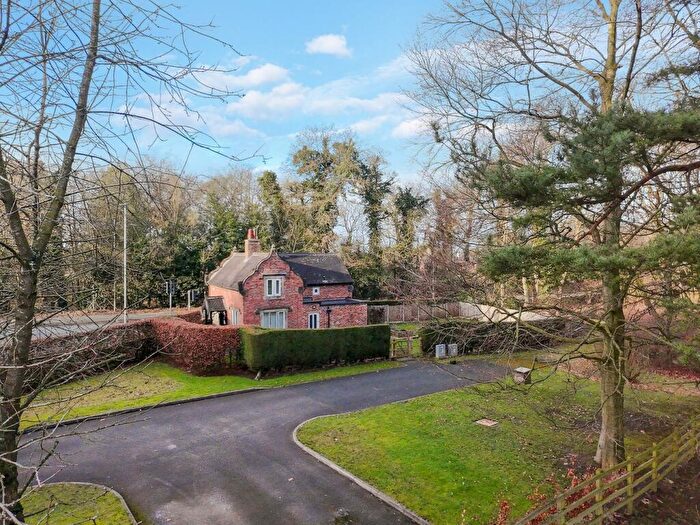
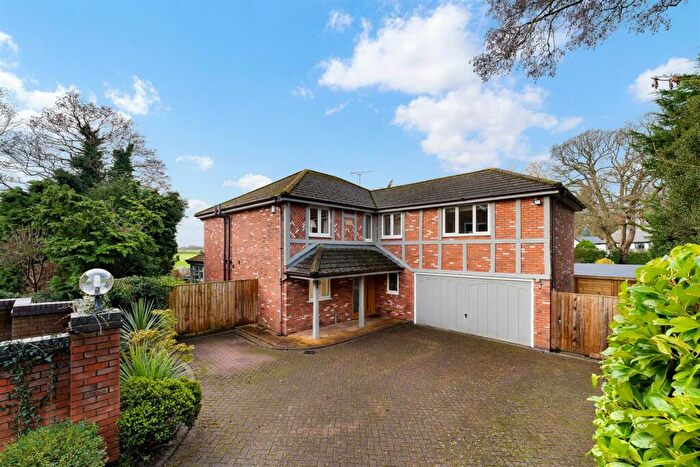
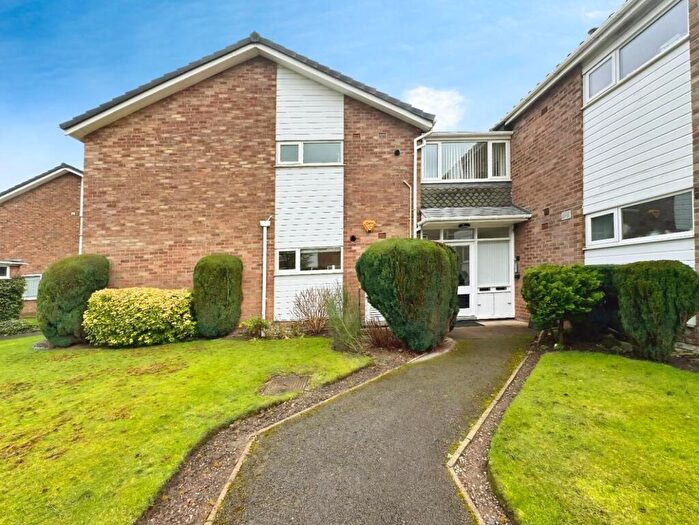
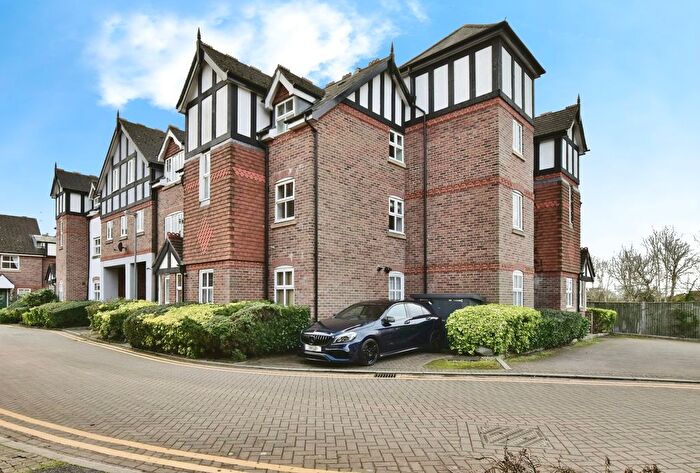
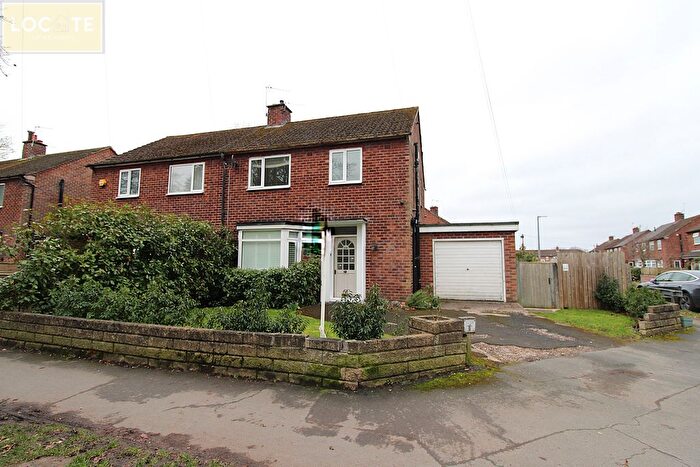
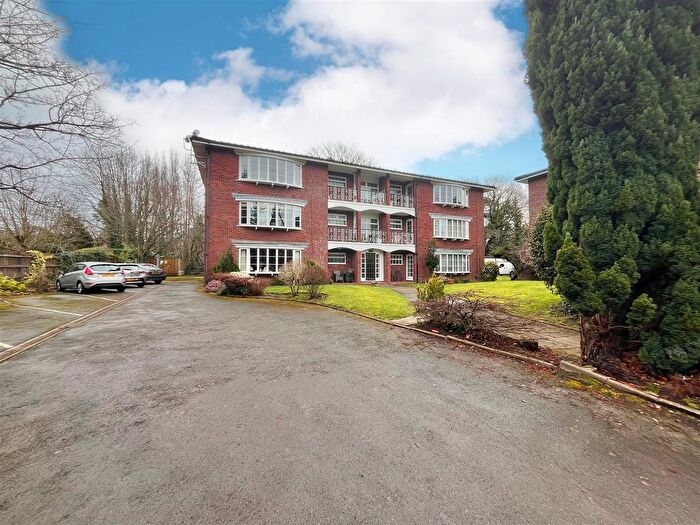
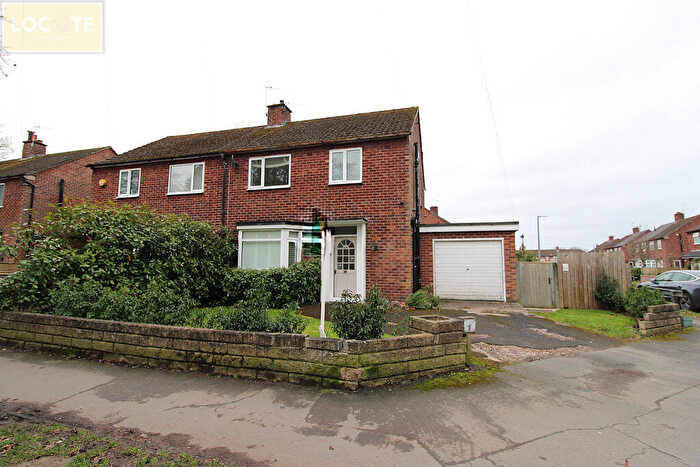
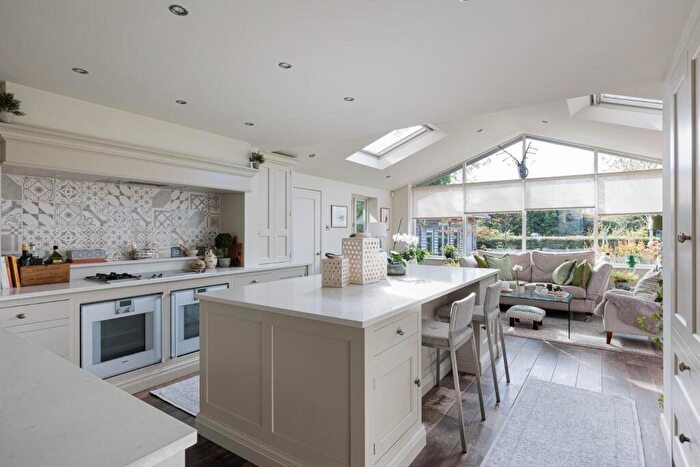
Properties for sale in Chelford
Roads and Postcodes in Chelford
Navigate through our locations to find the location of your next house in Chelford, Macclesfield for sale or to rent.
| Streets | Postcodes |
|---|---|
| Alderley Park | SK10 4TF SK10 4TG |
| Alderley Road | SK11 9AP |
| Artists Lane | SK10 4UA |
| Ashcroft Drive | SK11 9GF |
| Asquith Grove | SK10 4ZJ |
| Barncroft Close | SK11 9SW |
| Batemill Lane | SK11 9BW |
| Bollington Lane | SK10 4TB SK10 4UL |
| Bradford Lane | SK10 4TR SK10 4UE |
| Broomfield Close | SK11 9SL |
| Burnt Acre | SK11 9SS |
| Carter Lane | SK11 9BD |
| Cedar Square | SK10 4UP |
| Chapel Croft | SK11 9SU |
| Chelford Road | SK10 4RT SK10 4SY SK10 4SZ |
| Chillingham Close | SK11 9FZ SK11 9GA |
| Churchill Avenue | SK10 4UW |
| Cinder Lane | SK11 9BH |
| Clay Heyes | SK11 9ST |
| Common Farm Lane | SK11 9BQ SK11 9BJ |
| Congleton Lane | SK11 9AG |
| Congleton Road | SK10 4TP SK10 4TW SK10 4EL SK10 4JP SK10 4JS SK10 4JT SK10 4JW SK10 4JY SK10 4TD SK10 4UN SK10 4ZE SK10 4ZG |
| Dexter Place | SK11 9FU |
| Dixon Court | SK11 9AU |
| Dixon Drive | SK11 9BU SK11 9BX |
| Drumble Field | SK11 9BT |
| Eagles Road | SK10 4WD |
| Elmstead Road | SK11 9BS |
| Finlow Hill Lane | SK10 4UF |
| Galloway Road | SK11 9FX |
| Grangewood Drive | SK11 9BY |
| Heawood Hall | SK10 4TN |
| Highland Drive | SK11 9GB |
| Hitch Lowes | SK11 9SR |
| Hocker Lane | SK10 4SE |
| Holmes Chapel Road | SK11 9AF SK11 9AQ |
| Jersey Close | SK11 9FW |
| Knutsford Road | SK11 9AS SK11 9BB |
| Maisterson Drive | SK10 4HN |
| Manor House Drive | SK10 4ZH |
| Meadow End Road | SK11 9GE |
| Mere Court | SK11 9EB |
| Mill Lane | SK11 9BN |
| Millbank Close | SK11 9SJ |
| Nursery Lane | SK10 4TX |
| Oak Road | SK11 9AY |
| Orchard Crescent | SK10 4TZ |
| Osprey Close | SK10 4ZP |
| Oval Place | SK10 4YT |
| Pavilion Drive | SK10 4YU |
| Peover Lane | SK11 9AJ SK11 9AL SK11 9AW SK11 9BR SK11 9AN |
| Pepper Street | SK11 9BE SK11 9BG |
| Robin Close | SK11 9BA |
| Robin Lane | SK11 9AZ |
| Sand Lane | SK10 4TS |
| Serpentine Square | SK10 4HQ |
| Smallbrook Close | SK11 9GH |
| Snelson Lane | SK11 9BL SK11 9BP |
| Soss Moss | SK10 4TU SK10 4UJ |
| Station Road | SK11 9AX |
| Townfield Place | SK11 9GG |
| Vale Crescent | SK10 4LU |
| Welsh Row | SK10 4TT SK10 4TY |
| Wheat Moss | SK11 9SP |
| Woodfin Croft | SK11 9SN |
| Woodland Close | SK11 9BZ |
| Woodlands End | SK11 9BF |
| SK10 4TA SK11 9AH SK10 4UB SK10 4ZF |
Transport near Chelford
-
Chelford Station
-
Alderley Edge Station
-
Wilmslow Station
-
Goostrey Station
-
Mobberley Station
-
Knutsford Station
- FAQ
- Price Paid By Year
- Property Type Price
Frequently asked questions about Chelford
What is the average price for a property for sale in Chelford?
The average price for a property for sale in Chelford is £736,257. This amount is 105% higher than the average price in Macclesfield. There are 880 property listings for sale in Chelford.
What streets have the most expensive properties for sale in Chelford?
The streets with the most expensive properties for sale in Chelford are Bollington Lane at an average of £2,800,000, Artists Lane at an average of £2,775,000 and Hocker Lane at an average of £1,700,000.
What streets have the most affordable properties for sale in Chelford?
The streets with the most affordable properties for sale in Chelford are Dixon Court at an average of £203,250, Chillingham Close at an average of £312,500 and Jersey Close at an average of £349,999.
Which train stations are available in or near Chelford?
Some of the train stations available in or near Chelford are Chelford, Alderley Edge and Wilmslow.
Property Price Paid in Chelford by Year
The average sold property price by year was:
| Year | Average Sold Price | Price Change |
Sold Properties
|
|---|---|---|---|
| 2025 | £671,841 | -18% |
41 Properties |
| 2024 | £793,836 | 8% |
48 Properties |
| 2023 | £733,108 | -17% |
39 Properties |
| 2022 | £857,150 | 9% |
44 Properties |
| 2021 | £778,291 | 14% |
78 Properties |
| 2020 | £666,796 | 22% |
97 Properties |
| 2019 | £519,722 | - |
120 Properties |
| 2018 | £519,928 | 11% |
98 Properties |
| 2017 | £464,530 | -11% |
34 Properties |
| 2016 | £515,913 | -0,1% |
40 Properties |
| 2015 | £516,500 | 10% |
17 Properties |
| 2014 | £467,039 | 12% |
32 Properties |
| 2013 | £409,179 | -1% |
36 Properties |
| 2012 | £411,847 | 10% |
23 Properties |
| 2011 | £370,284 | -12% |
19 Properties |
| 2010 | £415,815 | 12% |
19 Properties |
| 2009 | £365,428 | -11% |
21 Properties |
| 2008 | £406,250 | -19% |
12 Properties |
| 2007 | £482,327 | 28% |
38 Properties |
| 2006 | £346,649 | 18% |
30 Properties |
| 2005 | £285,177 | -10% |
31 Properties |
| 2004 | £315,009 | 2% |
31 Properties |
| 2003 | £307,603 | -17% |
26 Properties |
| 2002 | £360,011 | 2% |
38 Properties |
| 2001 | £351,923 | 13% |
35 Properties |
| 2000 | £304,578 | 37% |
30 Properties |
| 1999 | £191,795 | 0,2% |
32 Properties |
| 1998 | £191,398 | 4% |
47 Properties |
| 1997 | £184,433 | 24% |
37 Properties |
| 1996 | £139,928 | -6% |
28 Properties |
| 1995 | £147,718 | - |
25 Properties |
Property Price per Property Type in Chelford
Here you can find historic sold price data in order to help with your property search.
The average Property Paid Price for specific property types in the last three years are:
| Property Type | Average Sold Price | Sold Properties |
|---|---|---|
| Semi Detached House | £502,410.00 | 28 Semi Detached Houses |
| Detached House | £825,718.00 | 75 Detached Houses |
| Terraced House | £641,269.00 | 13 Terraced Houses |
| Flat | £825,666.00 | 12 Flats |

