
Houses for sale in Mobberley, Alderley Edge
House Prices in Mobberley
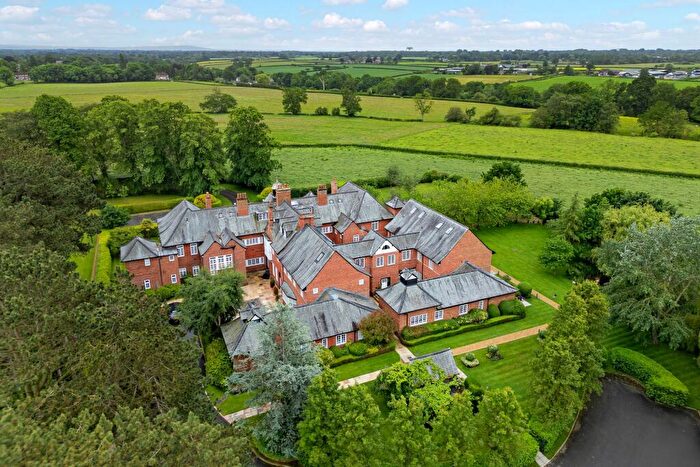
Properties in Mobberley have an average house price of £727k and had 32 Property Transactions within the last 3 years¹.
Mobberley is an area in Alderley Edge, Cheshire with 177 households², where the most expensive property was sold for £1.35M.
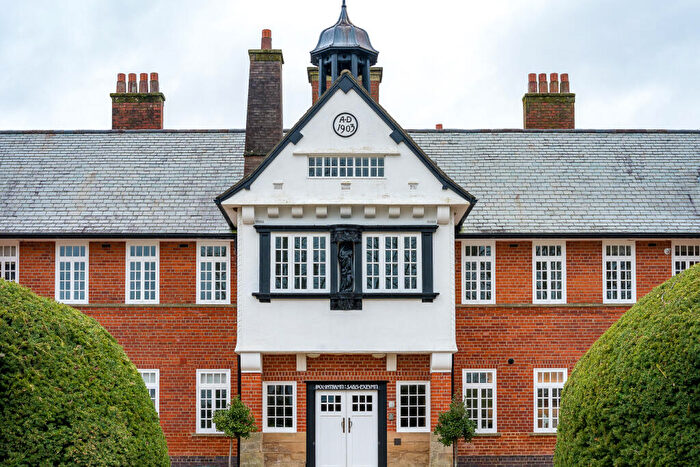
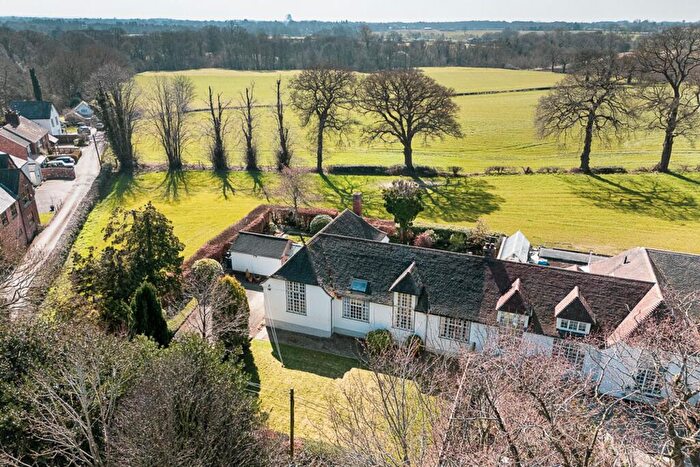
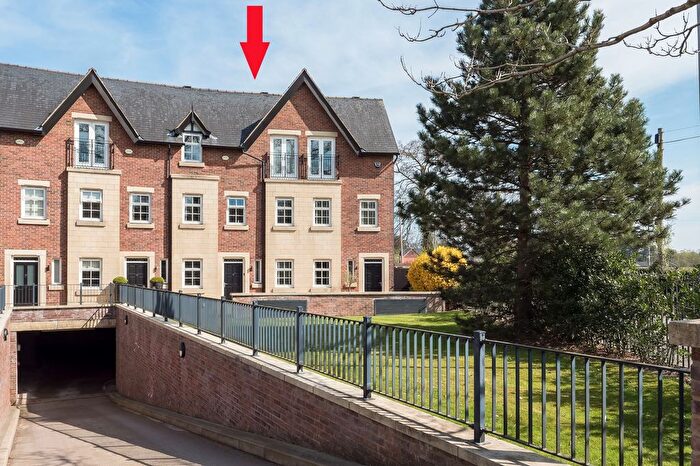
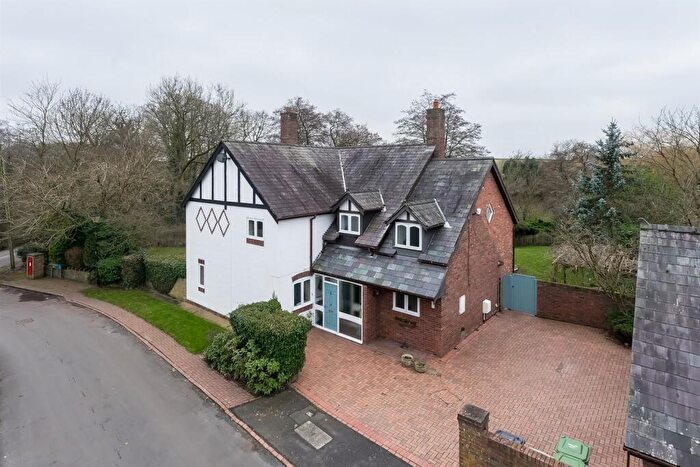
Properties for sale in Mobberley
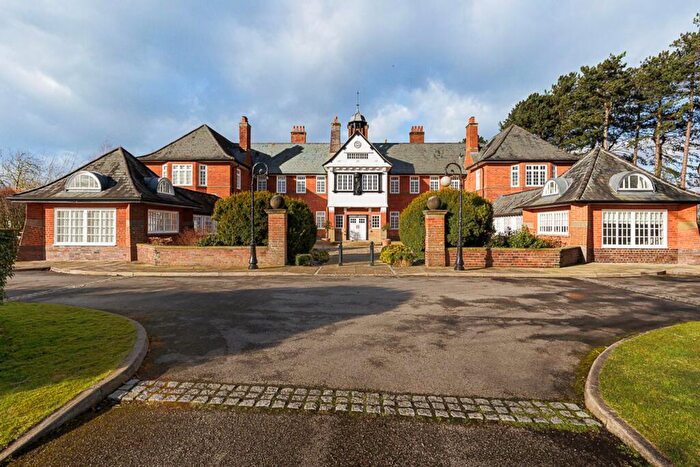
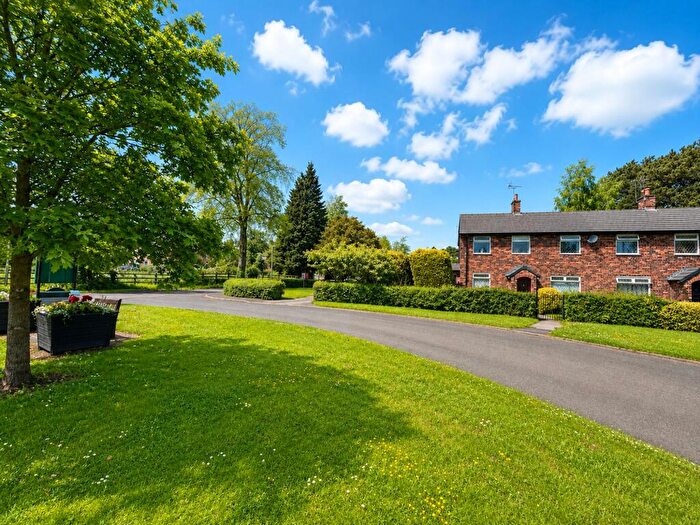
![]()
If you are looking to sell your house, let it out, or receive a property valuation, an expert can help you.
Click the button below to get started.
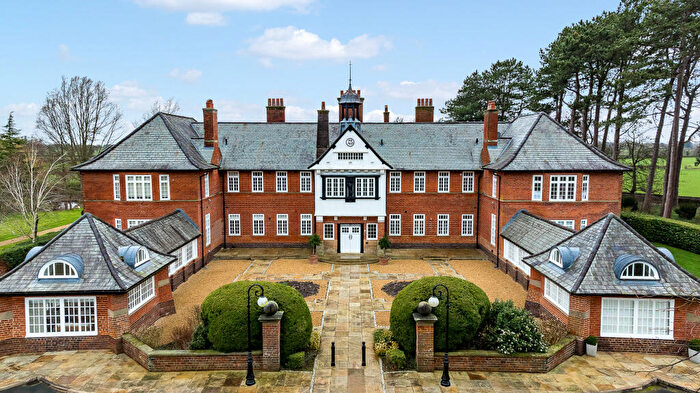
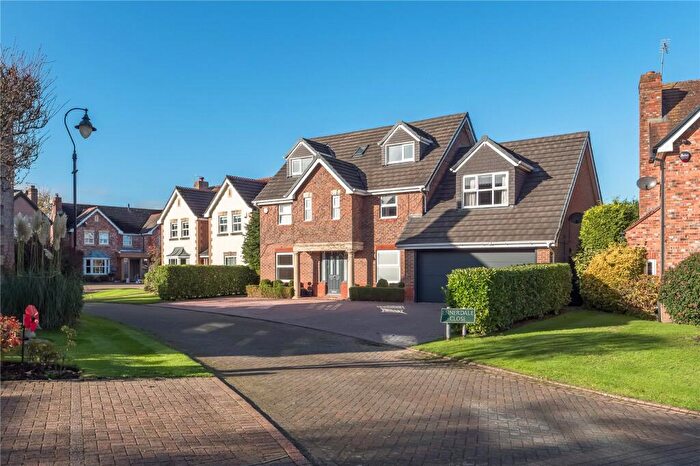
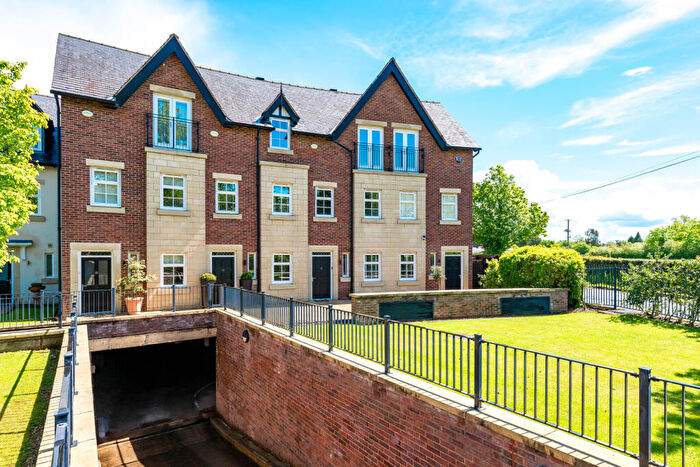
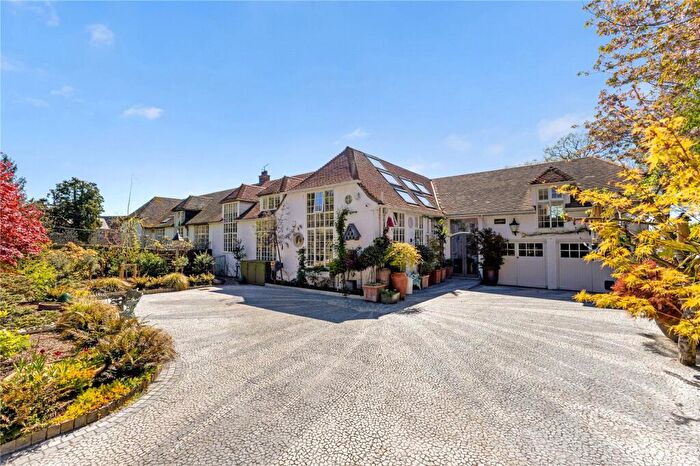
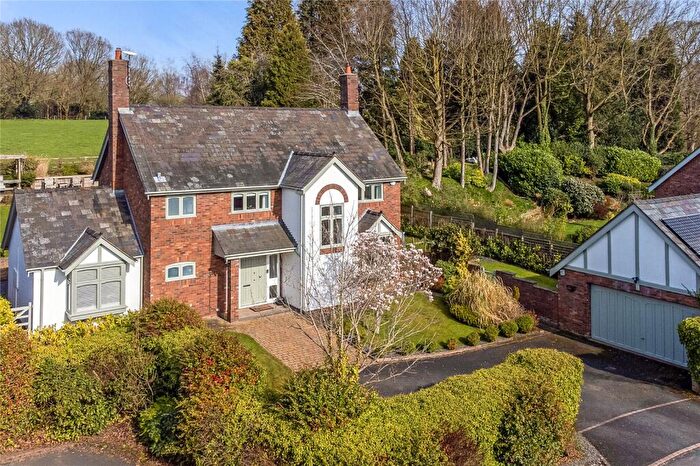
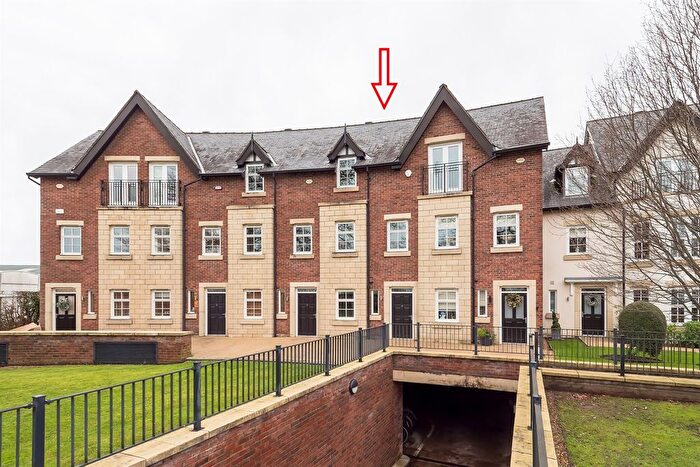
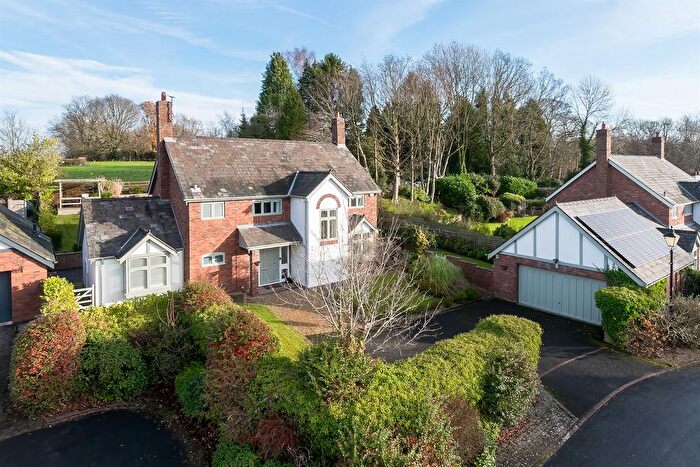
Previously listed properties in Mobberley
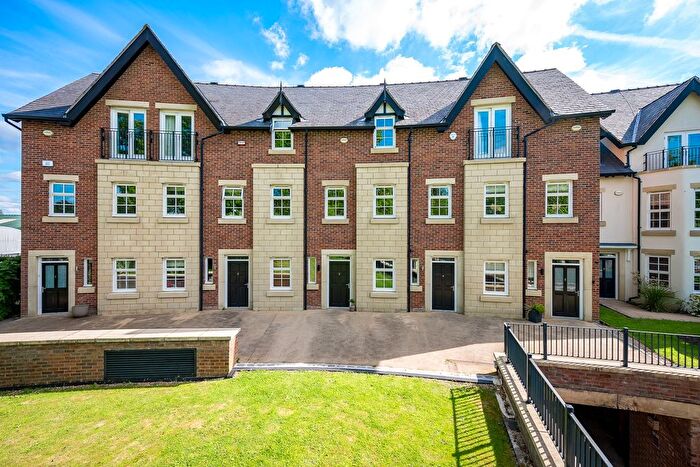


![]()
If you are looking to sell your house, let it out, or receive a property valuation, an expert can help you.
Click the button below to get started.


Roads and Postcodes in Mobberley
Navigate through our locations to find the location of your next house in Mobberley, Alderley Edge for sale or to rent.
| Streets | Postcodes |
|---|---|
| Ancoats Lane | SK9 7TT |
| Buttermere Drive | SK9 7WA |
| Chelford Road | SK9 7TL |
| Coniston Close | SK9 7WD |
| Derwent Way | SK9 7WE |
| Edge View Crescent | SK9 7TB |
| Edge View Lane | SK9 7SU |
| Ennerdale Close | SK9 7WF |
| Heathgate Cottages | SK9 7TU |
| Merrymans Lane | SK9 7TN SK9 7TP |
| Mill Lane | SK9 7UD SK9 7TD SK9 7TY |
| Sandlebridge Rise | SK9 7TE |
| Ullswater Drive | SK9 7WB |
| Warford Crescent | SK9 7TW |
| Warford Hall Drive | SK9 7TR |
| Warford Lane | SK9 7TX |
Property price trends in Mobberley
According to the latest Land Registry data, the average home in Mobberley sold for £741,250 in 2025. That figure comes from 265 sales logged over the past 30 years.
Prices have continued to climb over the last three years. Compared with 2022, when the typical sale came in around £660,000, that's a rise of roughly 12.3%.
Looking back five years, average prices are up about 95% since 2020, a gain of around £361,157 in cash terms.
Zoom out to the past decade for the fuller picture. Back in 2015, homes here averaged £612,720, so the typical sold price has climbed about 21% since then, roughly 1.9% a year. Stretch the view to fifteen years and that annual pace edges up closer to 3.5%.
Frequently asked questions about Mobberley
What is the average price for a property for sale in Mobberley?
The average price for a property for sale in Mobberley is £727,078. This amount is 0.53% lower than the average price in Alderley Edge. There are 83 property listings for sale in Mobberley.
What streets have the most expensive properties for sale in Mobberley?
The streets with the most expensive properties for sale in Mobberley are Sandlebridge Rise at an average of £1,115,000, Warford Hall Drive at an average of £1,100,000 and Chelford Road at an average of £1,030,000.
What streets have the most affordable properties for sale in Mobberley?
The streets with the most affordable properties for sale in Mobberley are Edge View Crescent at an average of £520,833, Warford Crescent at an average of £542,875 and Mill Lane at an average of £596,416.
Which train stations are available in or near Mobberley?
Some of the train stations available in or near Mobberley are Chelford, Alderley Edge and Wilmslow.
Property Price Paid in Mobberley by Year
The average sold property price by year was:
| Year | Average Sold Price | Price Change |
Sold Properties
|
|---|---|---|---|
| 2025 | £741,250 | -3% |
10 Properties |
| 2024 | £760,363 | 10% |
11 Properties |
| 2023 | £680,909 | 3% |
11 Properties |
| 2022 | £660,000 | 10% |
9 Properties |
| 2021 | £592,153 | 36% |
13 Properties |
| 2020 | £380,093 | -68% |
8 Properties |
| 2019 | £640,000 | -15% |
5 Properties |
| 2018 | £738,750 | 46% |
2 Properties |
| 2017 | £398,750 | -38% |
4 Properties |
| 2016 | £551,642 | -11% |
7 Properties |
Property Price per Property Type in Mobberley
Here you can find historic sold price data in order to help with your property search.
The average Property Paid Price for specific property types in the last three years are:
| Property Type | Average Sold Price | Sold Properties |
|---|---|---|
| Semi Detached House | £647,611.00 | 9 Semi Detached Houses |
| Terraced House | £508,937.00 | 8 Terraced Houses |
| Flat | £567,500.00 | 3 Flats |
| Detached House | £972,000.00 | 12 Detached Houses |
