
Houses for sale & to rent in SK11 7EB, Hollins Terrace, Macclesfield East, Macclesfield
House Prices in SK11 7EB, Hollins Terrace, Macclesfield East
Properties in SK11 7EB have no sales history available within the last 3 years. SK11 7EB is a postcode in Hollins Terrace located in Macclesfield East, an area in Macclesfield, Cheshire, with 3 households².
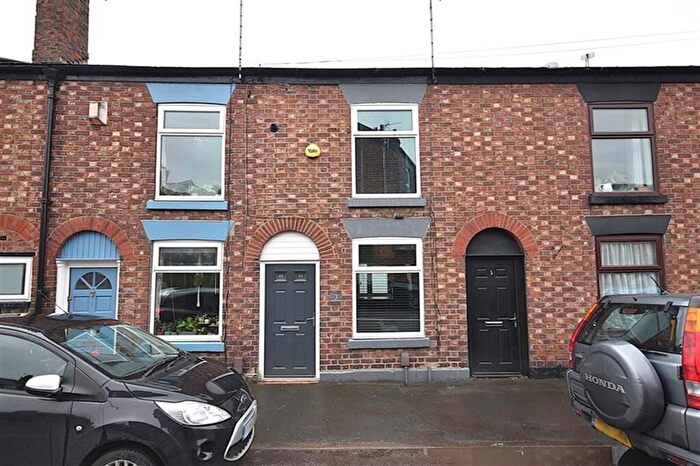
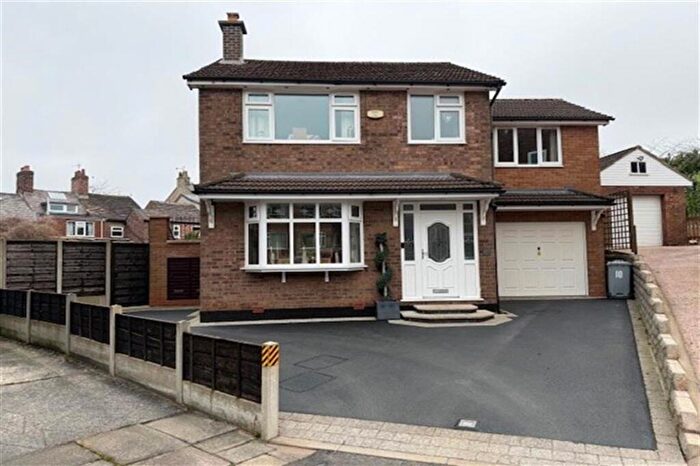
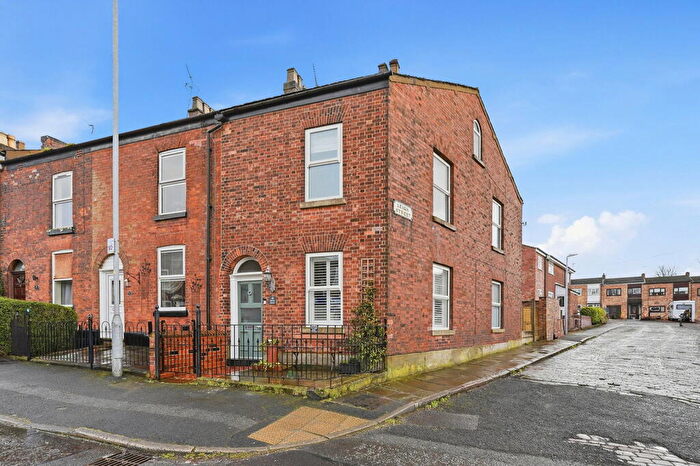
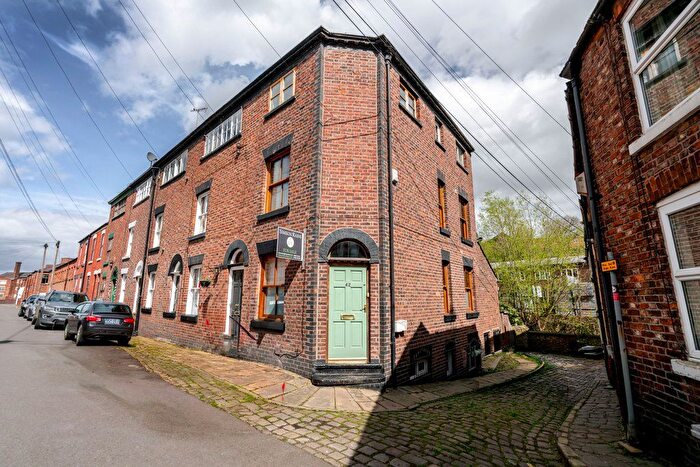
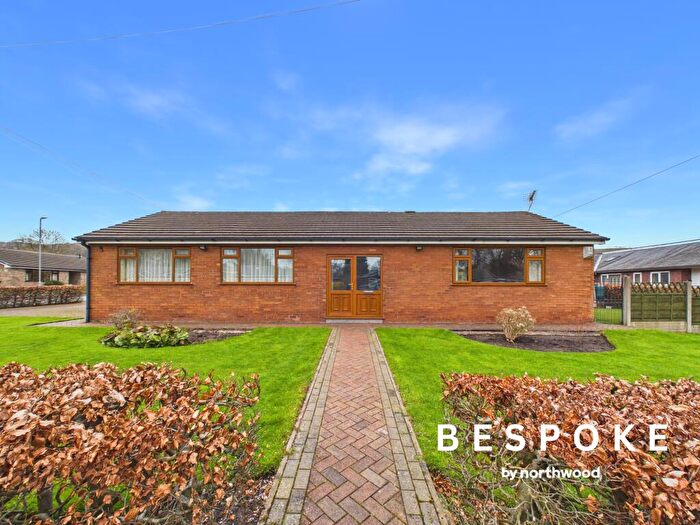
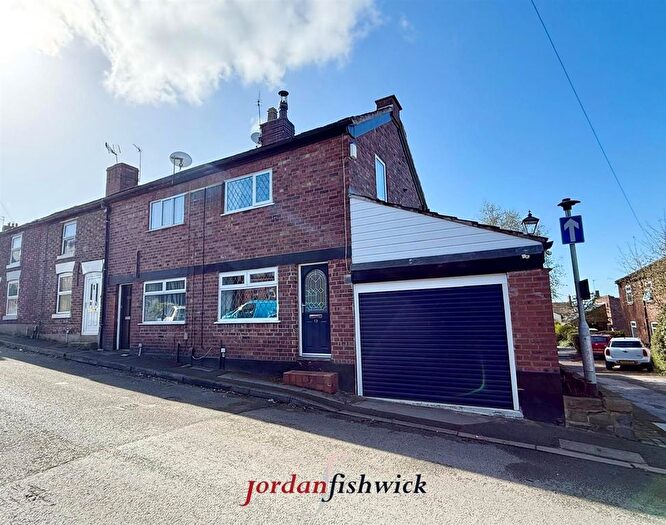
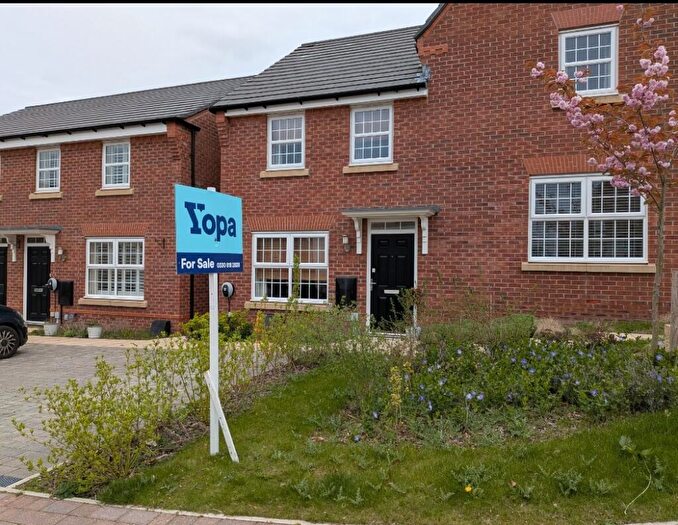
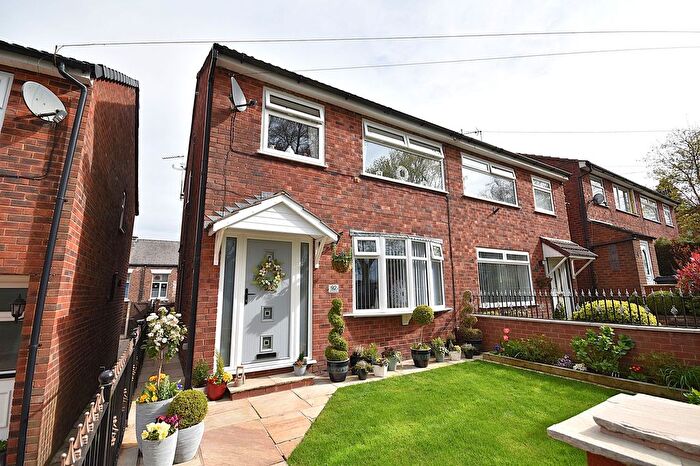
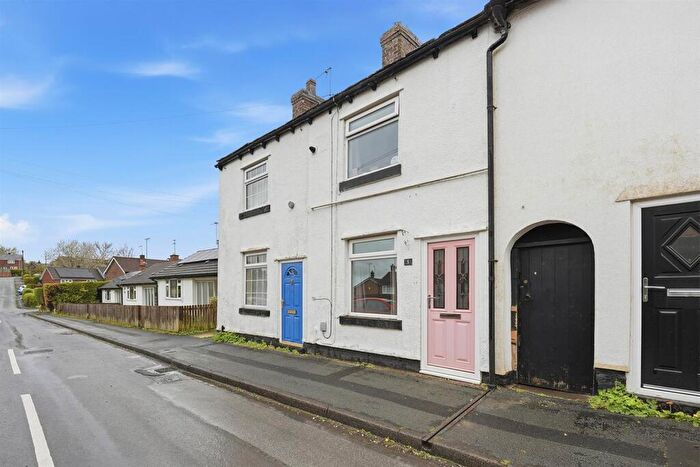
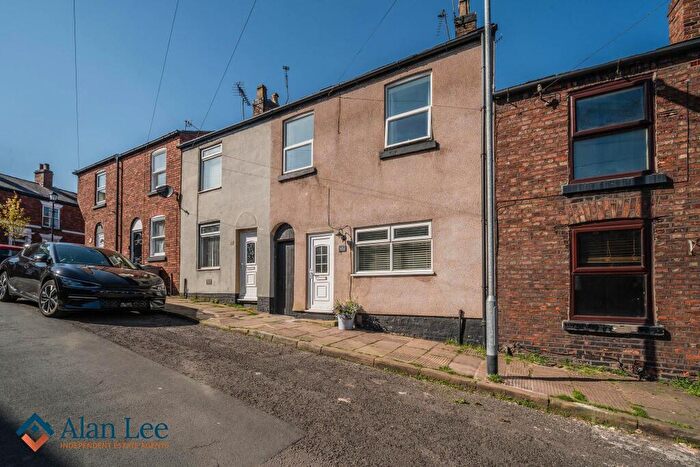
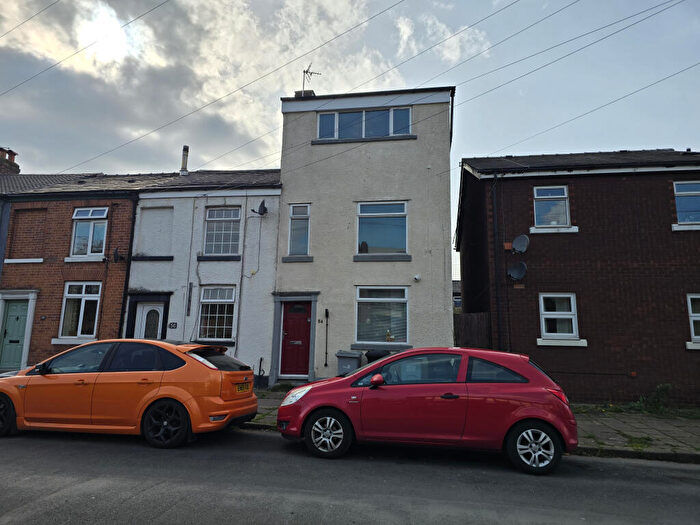
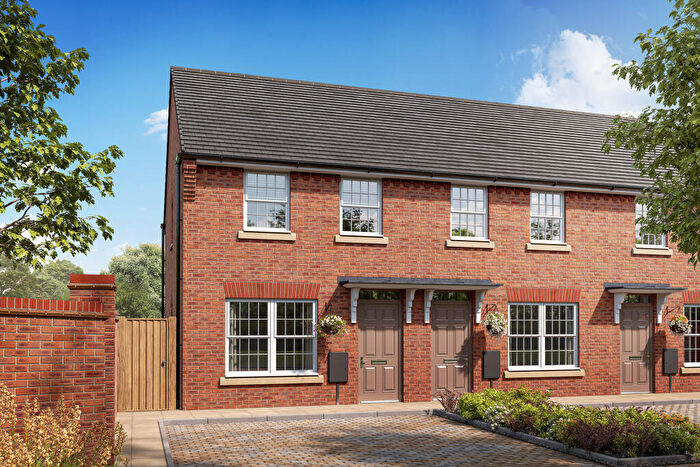
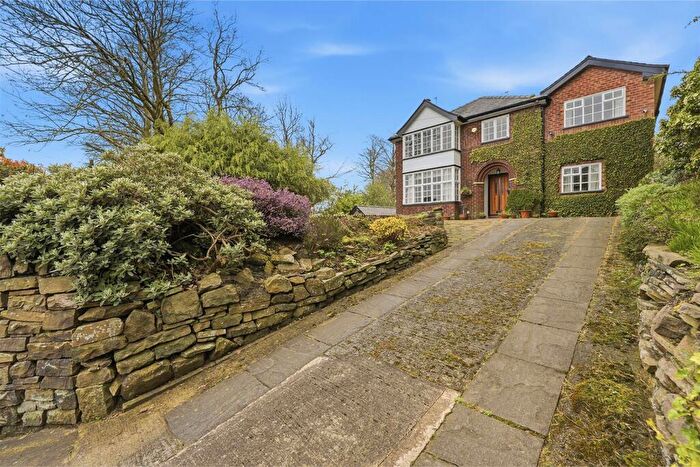
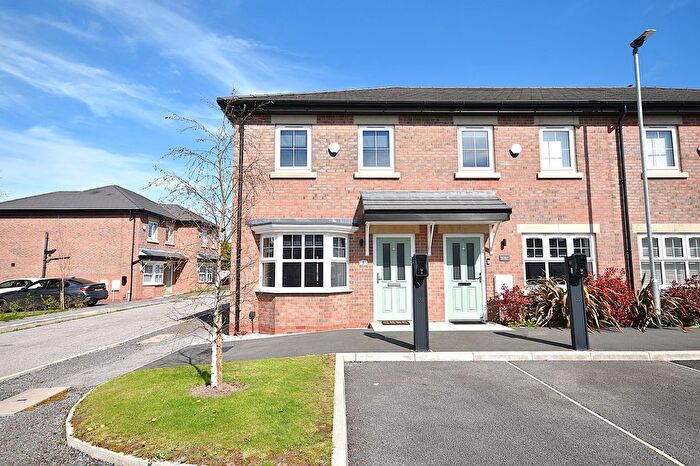
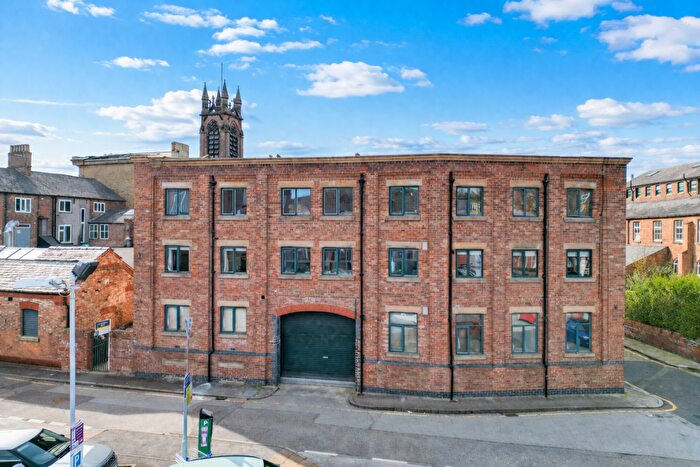
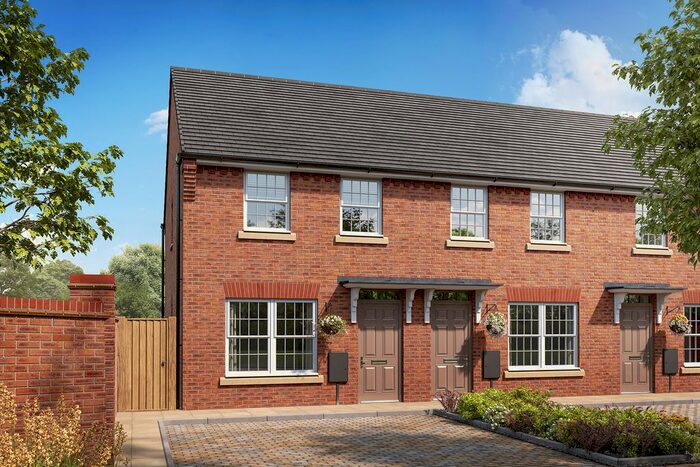
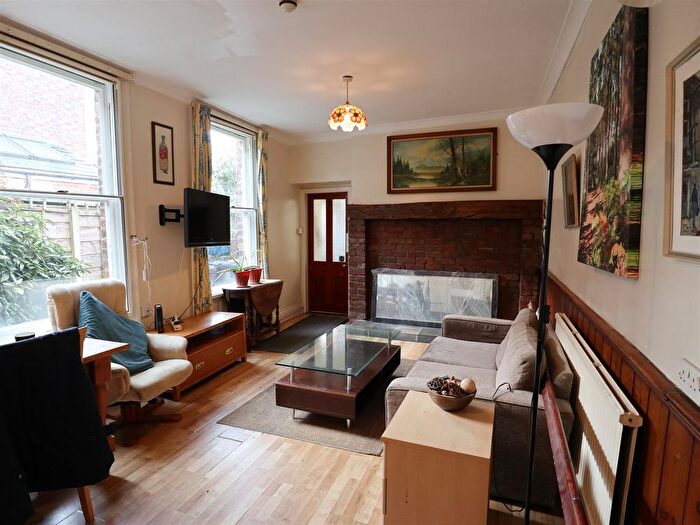
Properties for sale near SK11 7EB, Hollins Terrace

![]()
If you are looking to sell your house, let it out, or receive a property valuation, an expert can help you.
Click the button below to get started.

Price Paid in Hollins Terrace, SK11 7EB, Macclesfield East
7 Hollins Terrace, SK11 7EB, Macclesfield East Macclesfield
Property 7 has been sold 2 times. The last time it was sold was in 19/09/2008 and the sold price was £154,000.00.
This is a Terraced House which was sold as a freehold in 19/09/2008
| Date | Price | Property Type | Tenure | Classification |
|---|---|---|---|---|
| 19/09/2008 | £154,000.00 | Terraced House | freehold | Established Building |
| 22/09/2006 | £140,000.00 | Terraced House | freehold | Established Building |
9 Hollins Terrace, SK11 7EB, Macclesfield East Macclesfield
Property 9 has been sold 1 time. The last time it was sold was in 26/07/2006 and the sold price was £60,000.00.
This is a Terraced House which was sold as a freehold in 26/07/2006
| Date | Price | Property Type | Tenure | Classification |
|---|---|---|---|---|
| 26/07/2006 | £60,000.00 | Terraced House | freehold | Established Building |
10 Hollins Terrace, SK11 7EB, Macclesfield East Macclesfield
Property 10 has been sold 1 time. The last time it was sold was in 22/03/2000 and the sold price was £33,000.00.
This is a Terraced House which was sold as a freehold in 22/03/2000
| Date | Price | Property Type | Tenure | Classification |
|---|---|---|---|---|
| 22/03/2000 | £33,000.00 | Terraced House | freehold | Established Building |
Transport near SK11 7EB, Hollins Terrace

House price paid reports for SK11 7EB, Hollins Terrace
Click on the buttons below to see price paid reports by year or property price:
- Price Paid By Year
Property Price Paid in SK11 7EB, Hollins Terrace by Year
The average sold property price by year was:
| Year | Average Sold Price | Price Change |
Sold Properties
|
|---|---|---|---|
| 2008 | £154,000 | 35% |
1 Property |
| 2006 | £100,000 | 67% |
2 Properties |
| 2000 | £33,000 | - |
1 Property |