
Houses for sale in SK10 5TE, Cester Bridge, Sutton, Macclesfield
House Prices in SK10 5TE, Cester Bridge, Sutton
Properties in SK10 5TE have no sales history available within the last 3 years. SK10 5TE is a postcode in Cester Bridge located in Sutton, an area in Macclesfield, Cheshire, with 3 households².
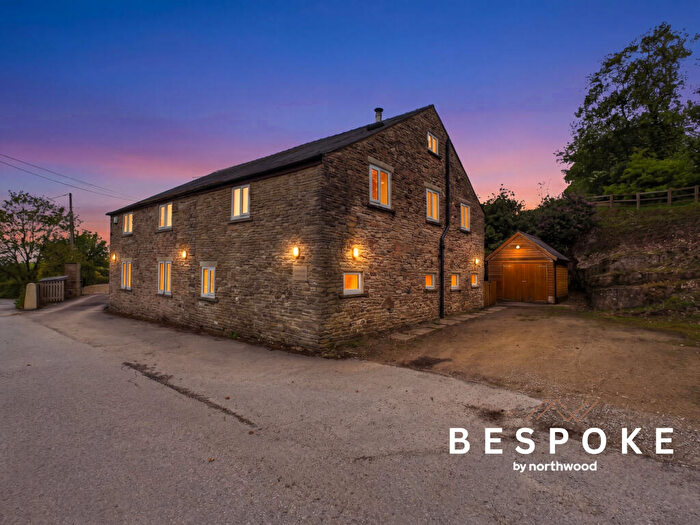
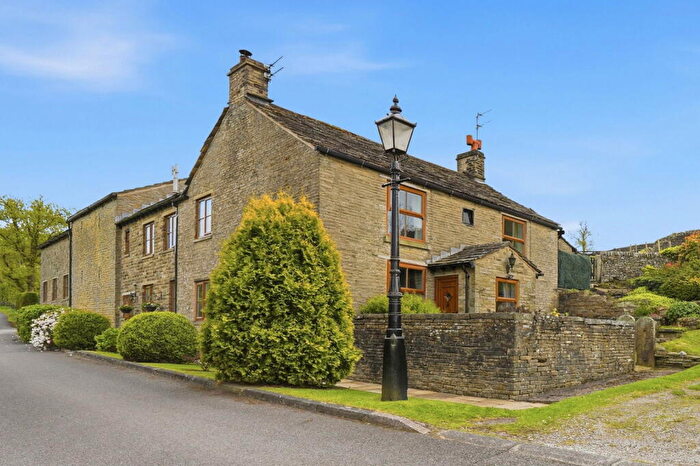
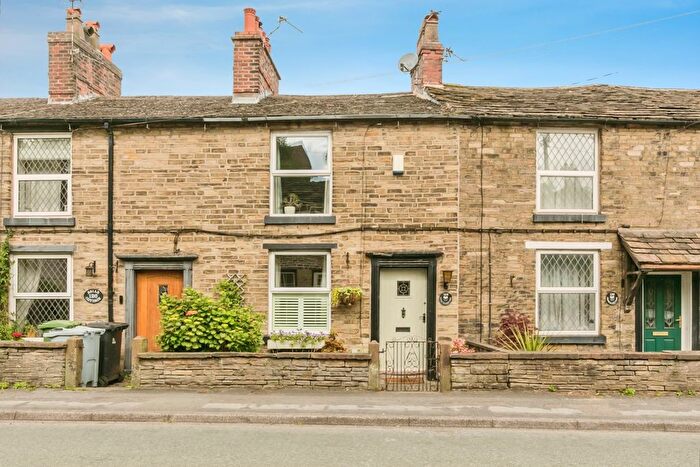
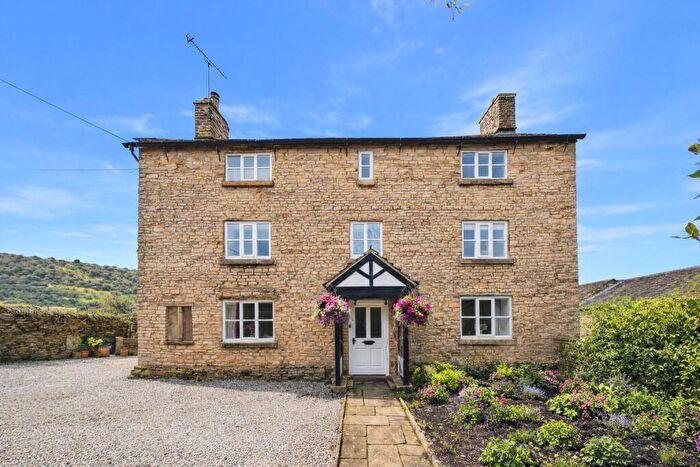
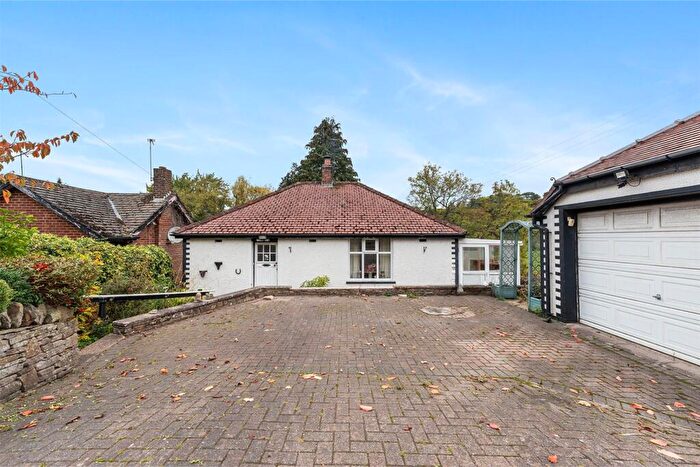
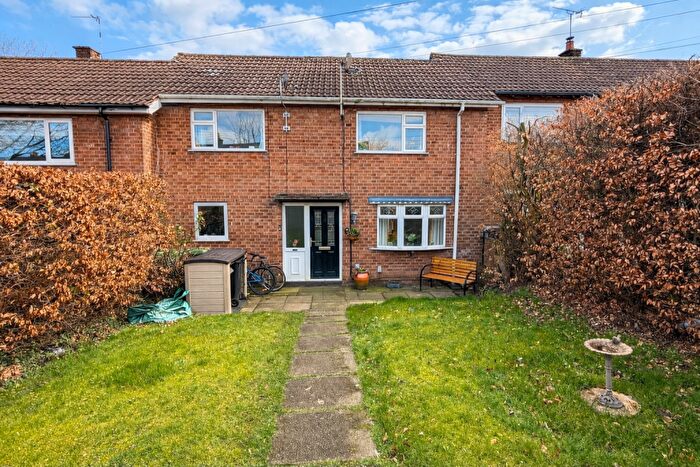
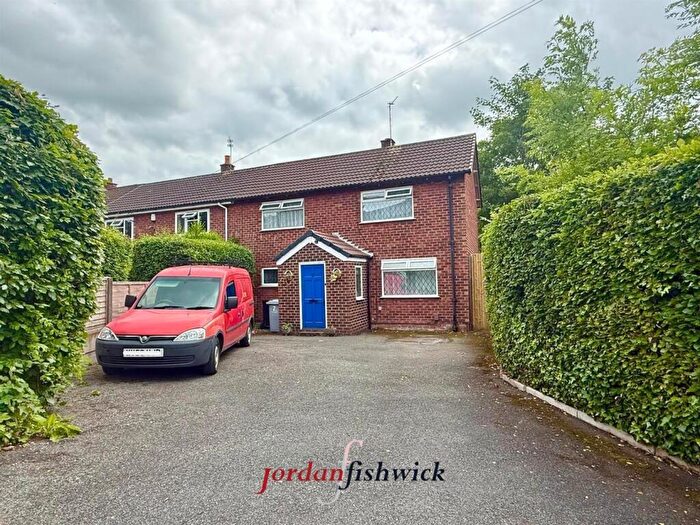
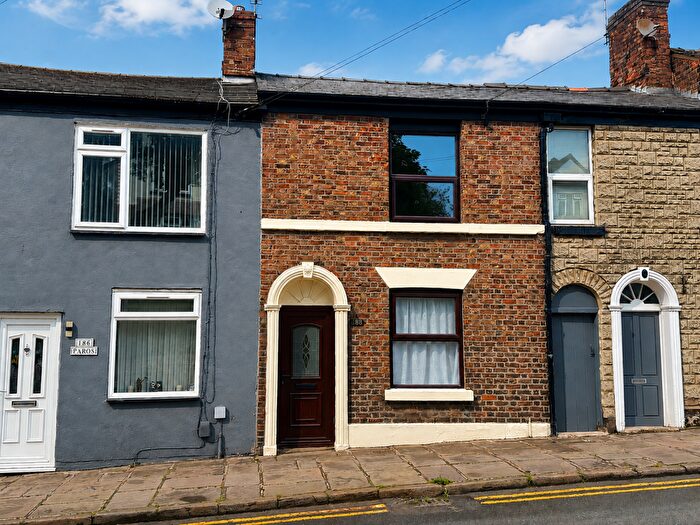
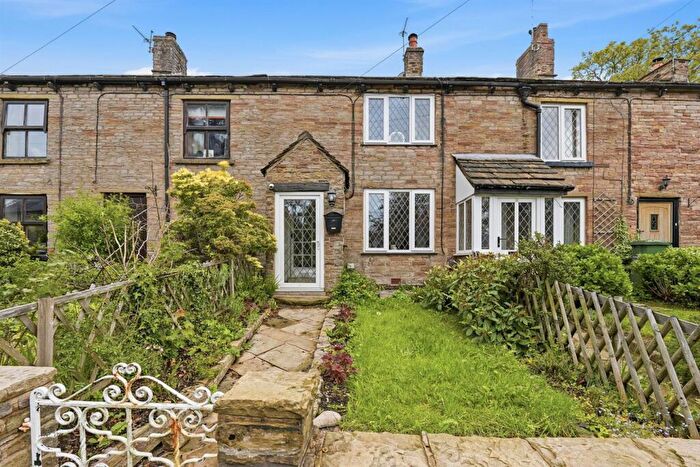
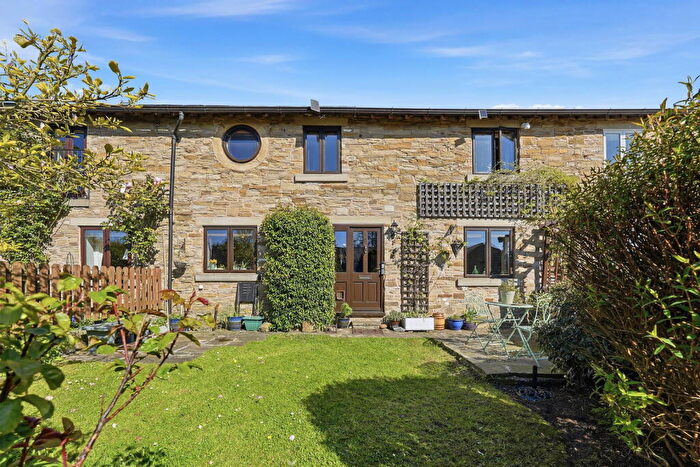
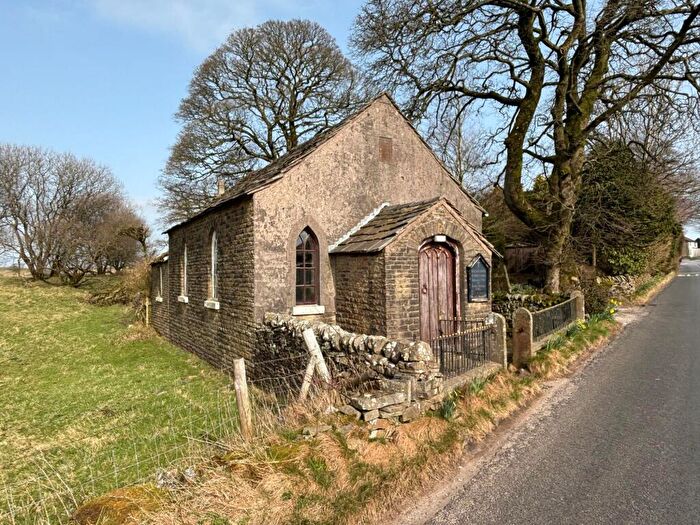
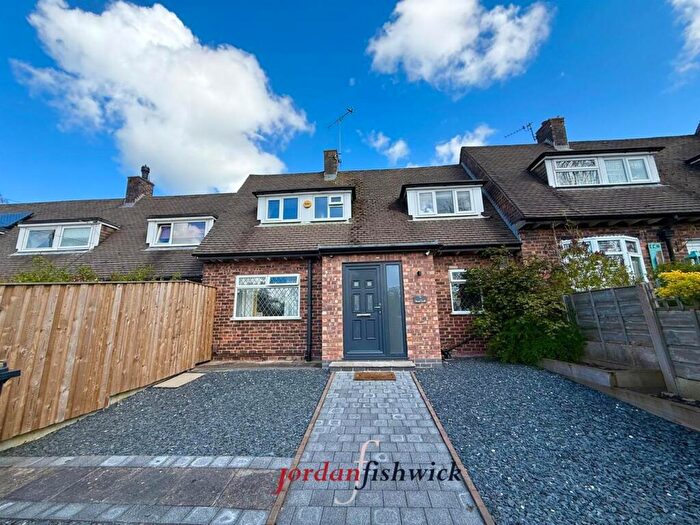
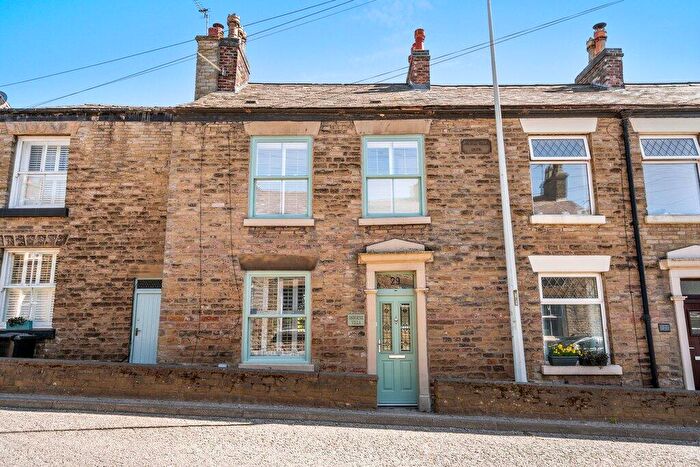
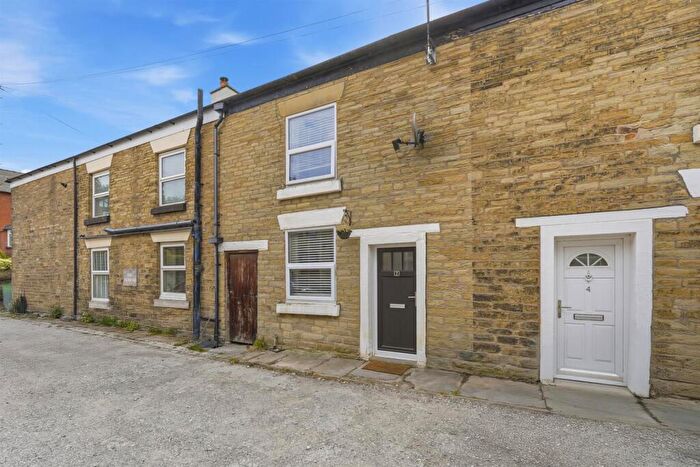
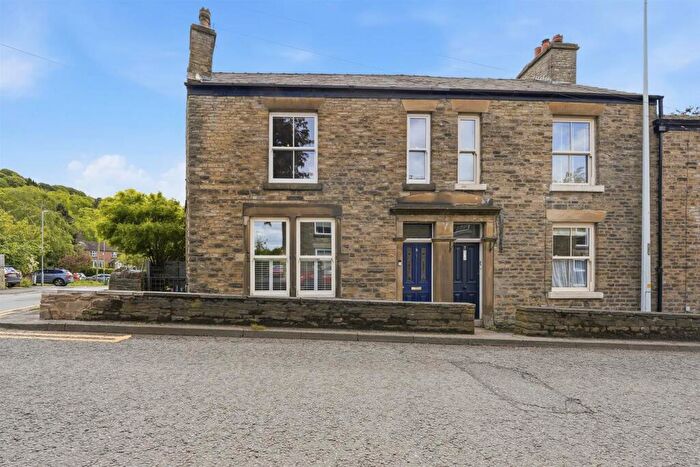
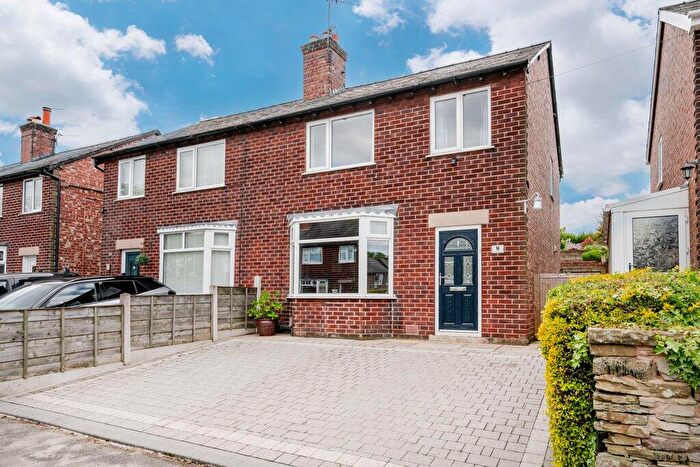
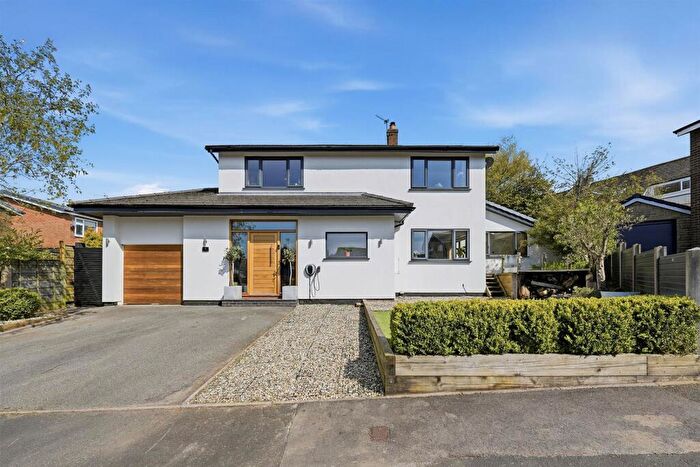
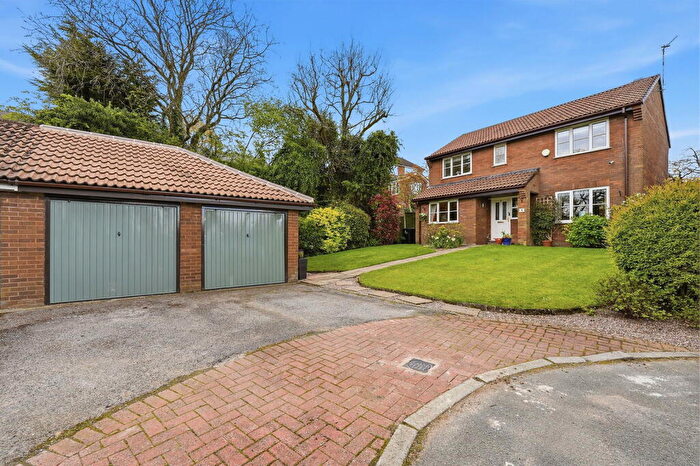
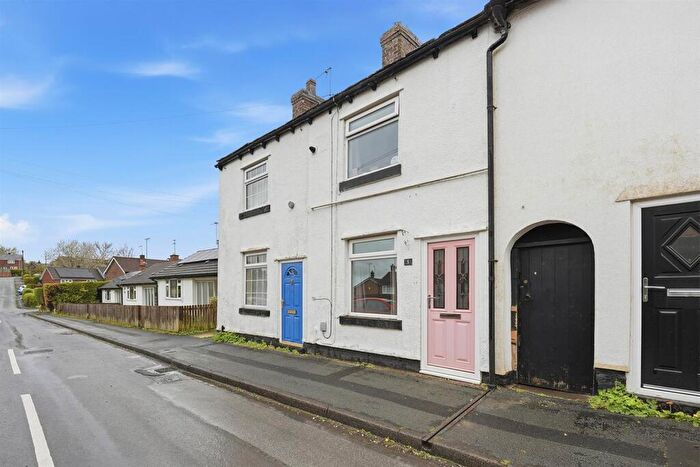
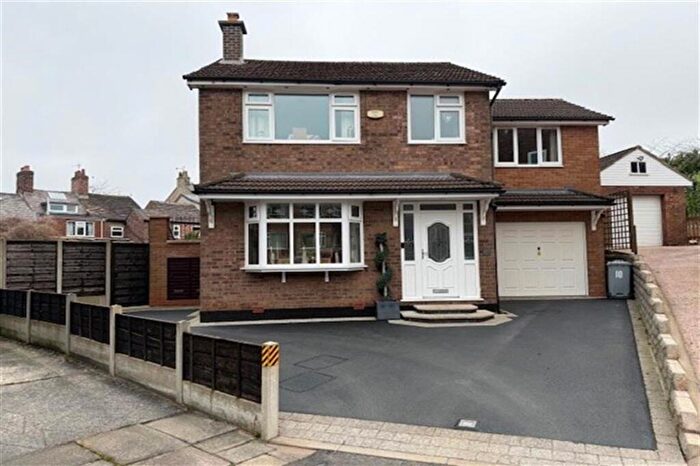
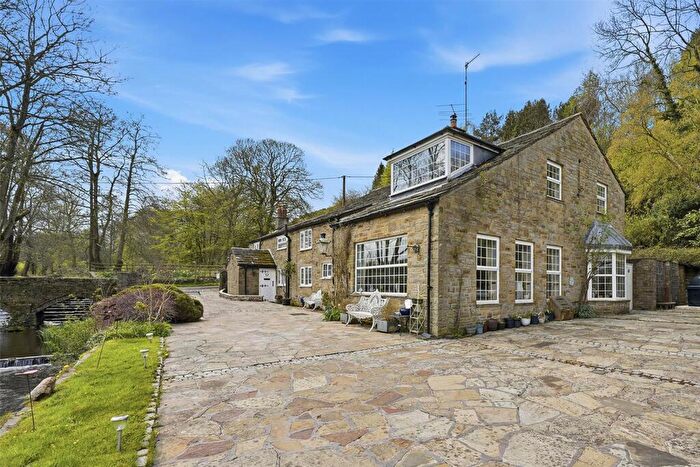
Properties for sale near SK10 5TE, Cester Bridge
![]()
If you are looking to sell your house, let it out, or receive a property valuation, an expert can help you.
Click the button below to get started.
Price Paid in Cester Bridge, SK10 5TE, Sutton
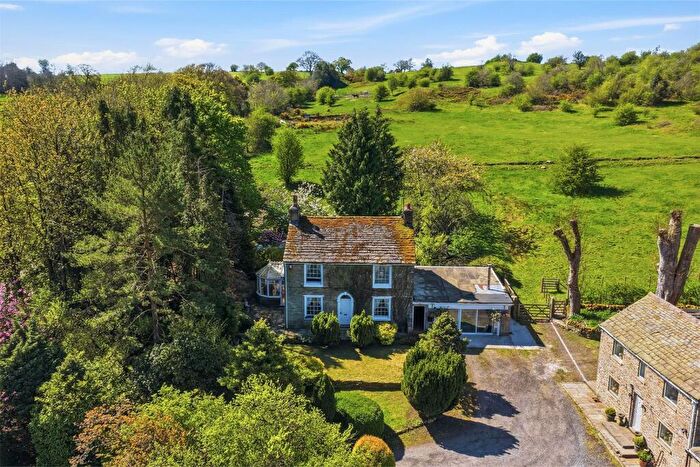
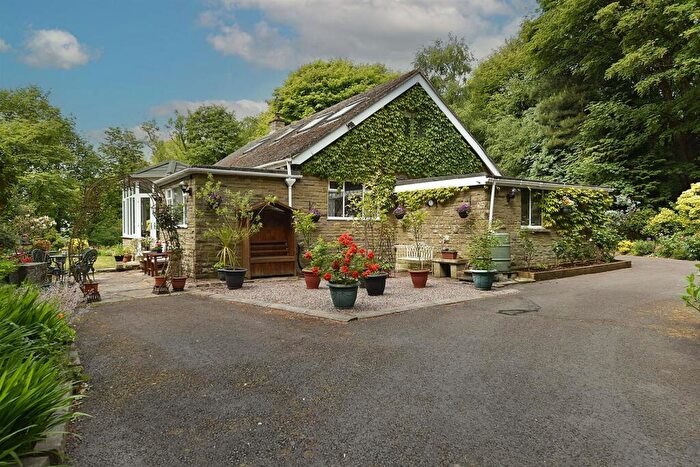
CESTERBRIDGE HOUSE Cester Bridge, SK10 5TE, Sutton Macclesfield
Property CESTERBRIDGE HOUSE has been sold 2 times. The last time it was sold was in 16/10/2020 and the sold price was £915,000.00.
This detached house, sold as a freehold on 16/10/2020, is a 243 sqm detached house with an EPC rating of F.
| Date | Price | Property Type | Tenure | Classification |
|---|---|---|---|---|
| 16/10/2020 | £915,000.00 | Detached House | freehold | Established Building |
| 24/03/2017 | £725,000.00 | Detached House | freehold | Established Building |
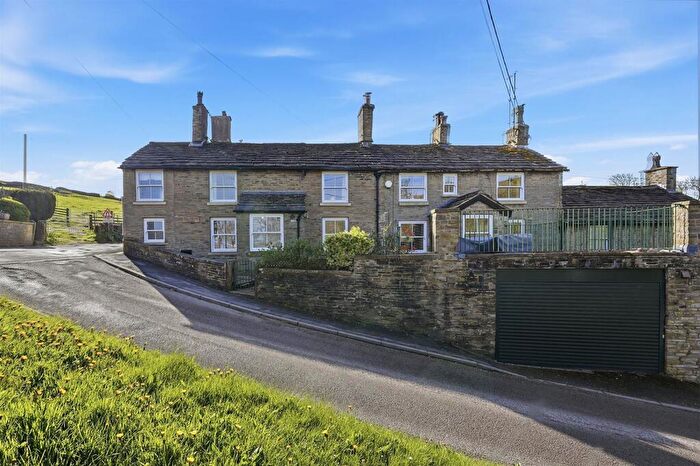
HILLSIDE Cester Bridge, SK10 5TE, Sutton Macclesfield
Property HILLSIDE has been sold 2 times. The last time it was sold was in 07/05/2010 and the sold price was £266,000.00.
This is a Semi Detached House which was sold as a freehold in 07/05/2010
| Date | Price | Property Type | Tenure | Classification |
|---|---|---|---|---|
| 07/05/2010 | £266,000.00 | Semi Detached House | freehold | Established Building |
| 27/09/1996 | £90,000.00 | Semi Detached House | freehold | Established Building |
Property price trends in SK10 5TE, Cester Bridge
According to the latest Land Registry data, the average home in SK10 5TE, Cester Bridge sold for £915,000 in 2020. That figure comes from 4 sales logged over the past 24 years.
Prices have continued to climb over the last three years. Compared with 2017, when the typical sale came in around £725,000, that's a rise of roughly 26.2%.
Zoom out to the past decade for the fuller picture. Back in 2010, homes here averaged £266,000, so the typical sold price has climbed about 244% since then, roughly 13.1% a year.
Property Price Paid in SK10 5TE, Cester Bridge by Year
The average sold property price by year was:
| Year | Average Sold Price | Price Change |
Sold Properties
|
|---|---|---|---|
| 2020 | £915,000 | 21% |
1 Property |
| 2017 | £725,000 | 63% |
1 Property |
| 2010 | £266,000 | 66% |
1 Property |
| 1996 | £90,000 | - |
1 Property |
