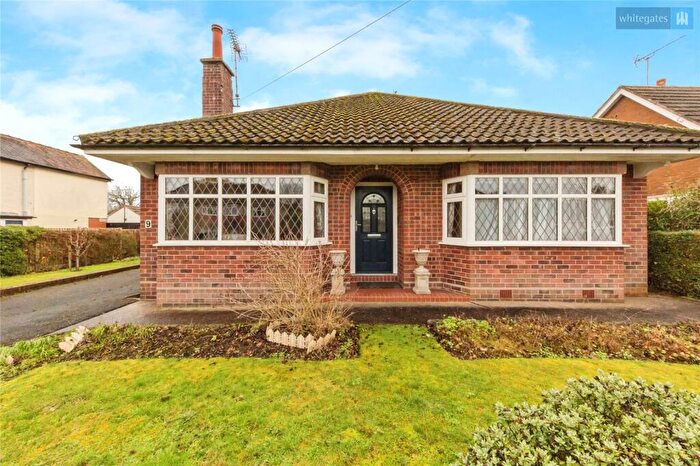
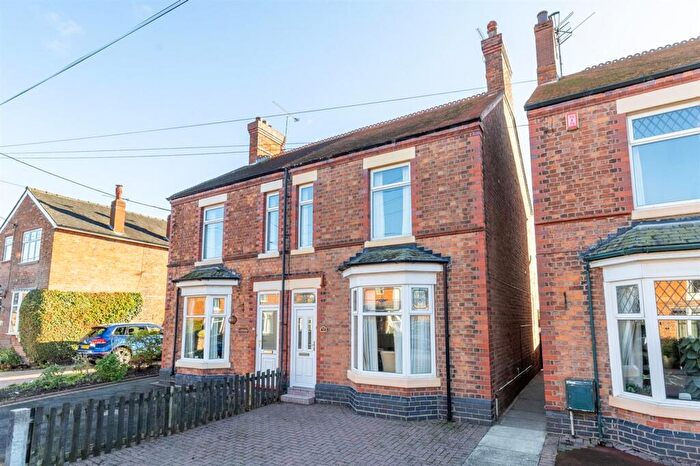
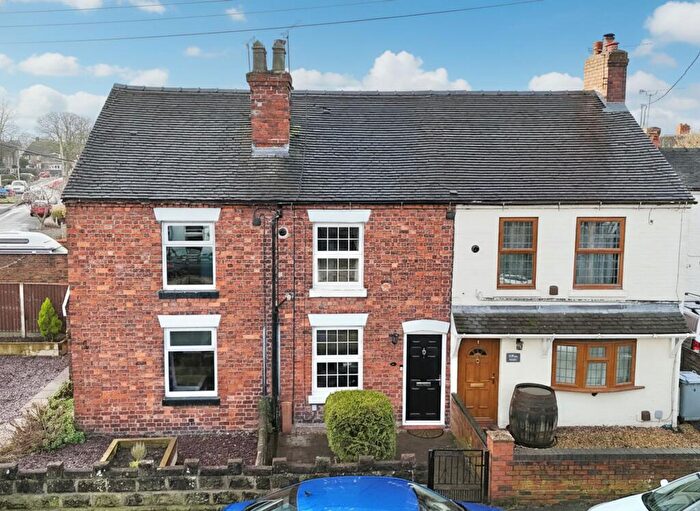
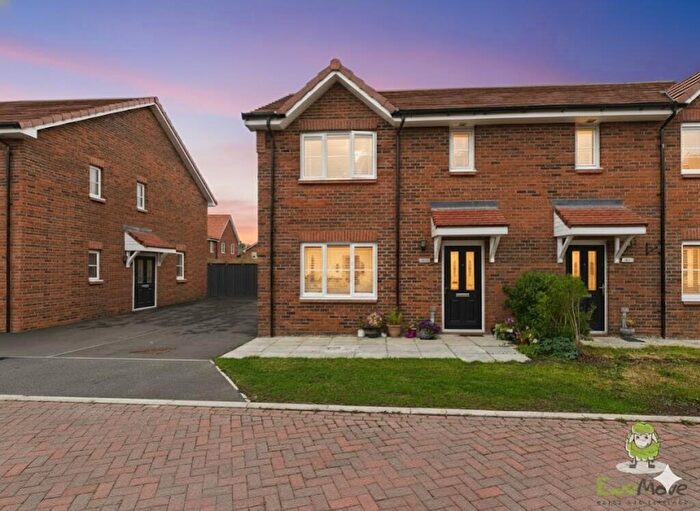
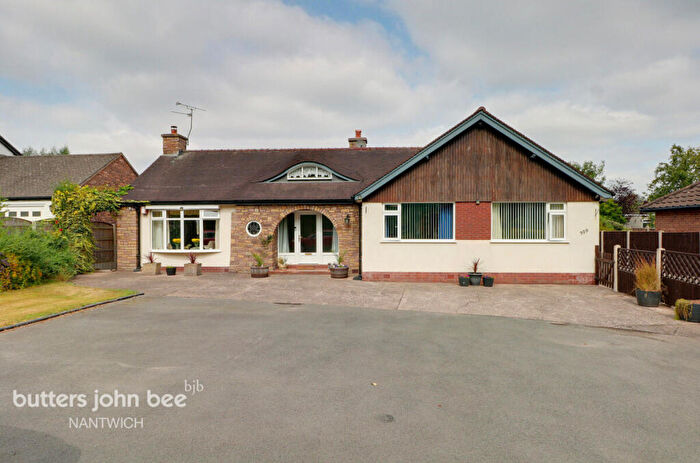
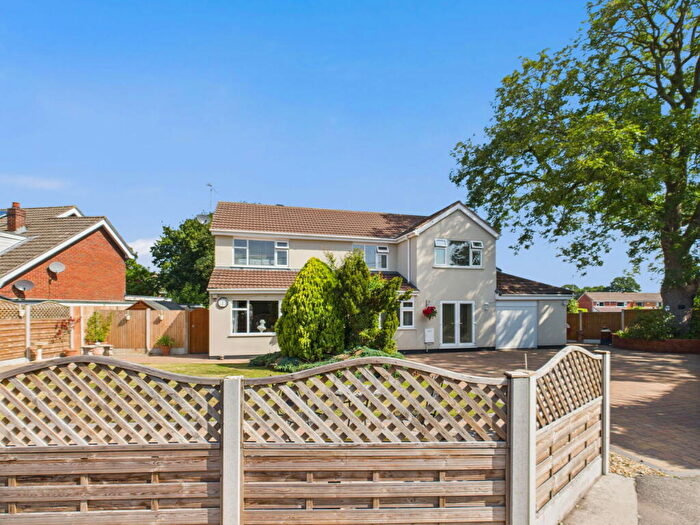
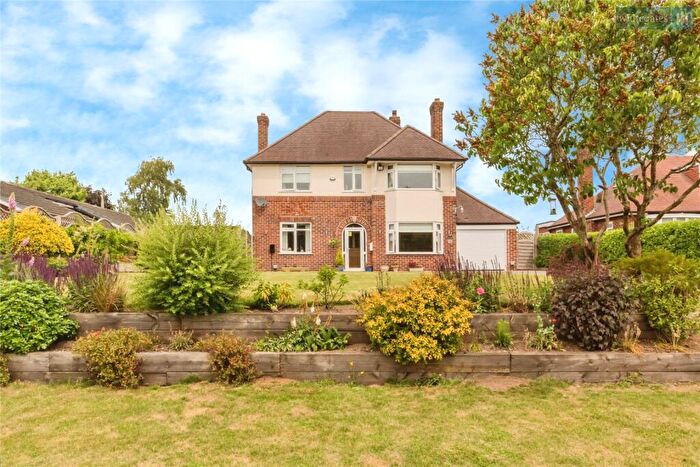
Houses for sale & to rent in Willaston And Rope, Nantwich
House Prices in Willaston And Rope
Properties in Willaston And Rope have an average house price of £310,033.00 and had 178 Property Transactions within the last 3 years¹.
Willaston And Rope is an area in Nantwich, Cheshire with 1,167 households², where the most expensive property was sold for £1,050,000.00.
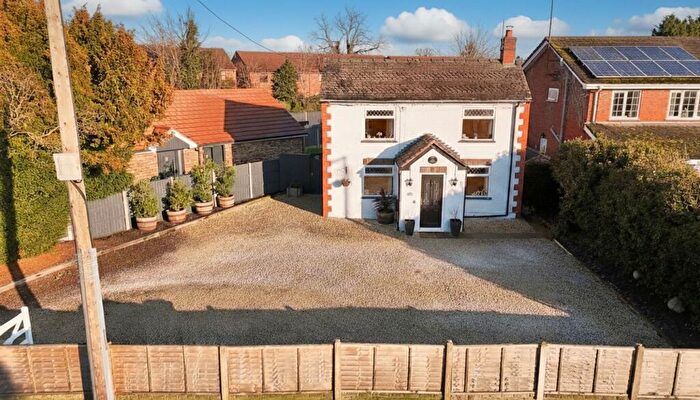
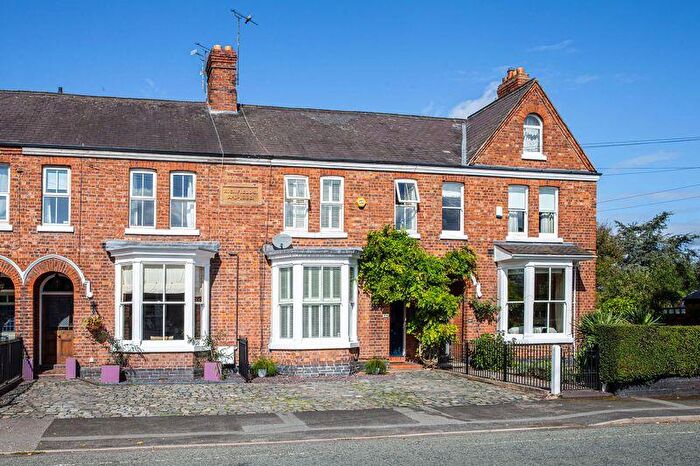
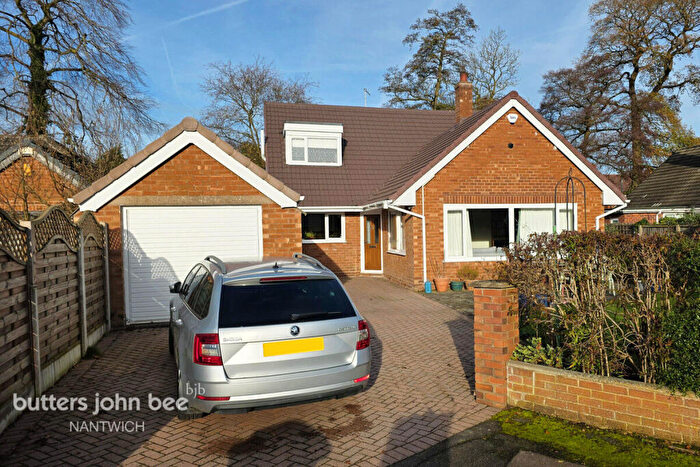
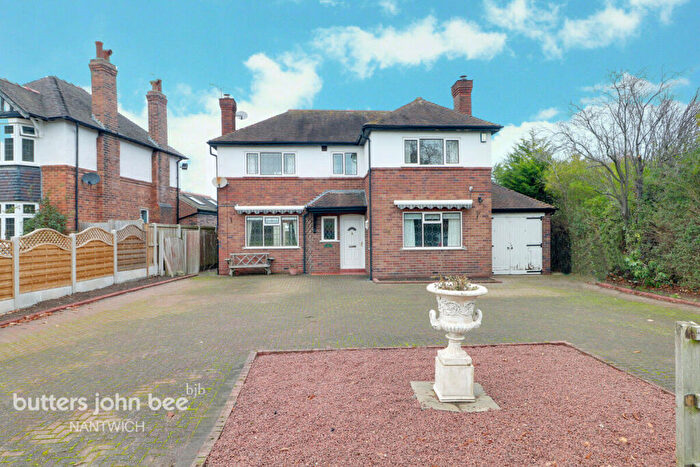
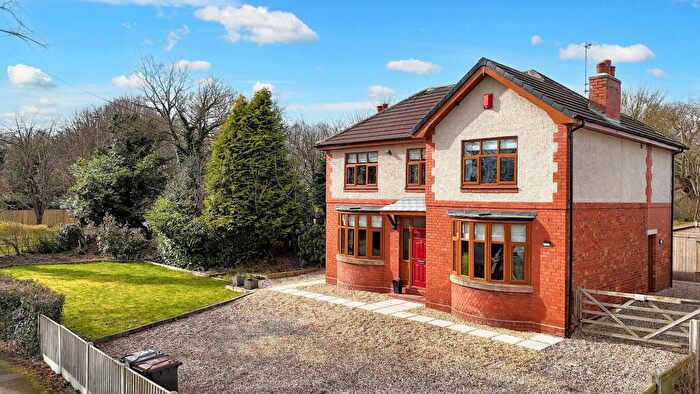
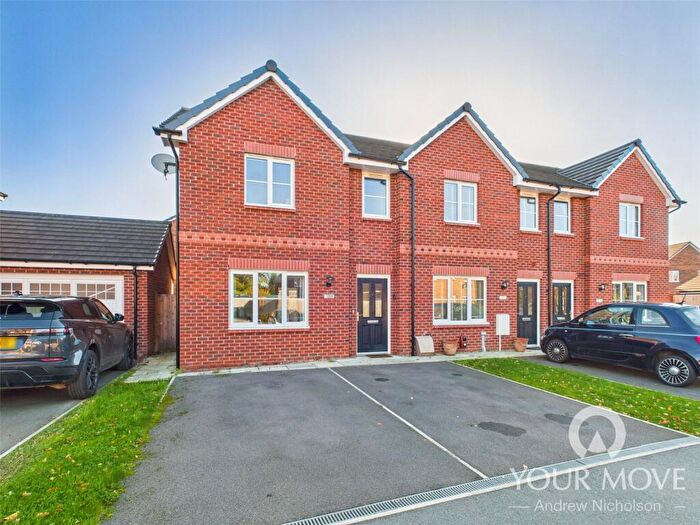
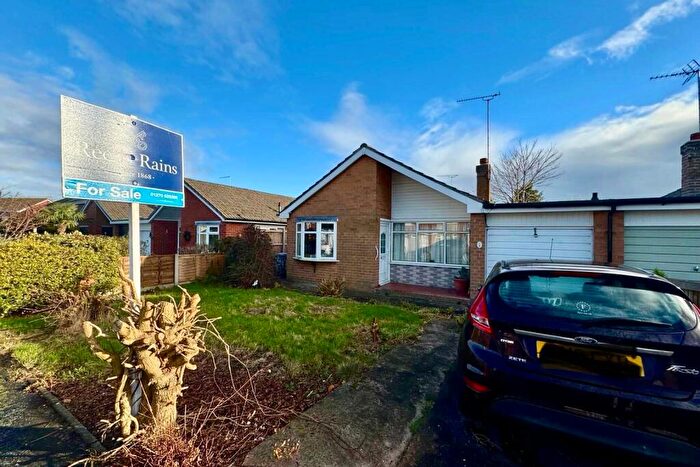
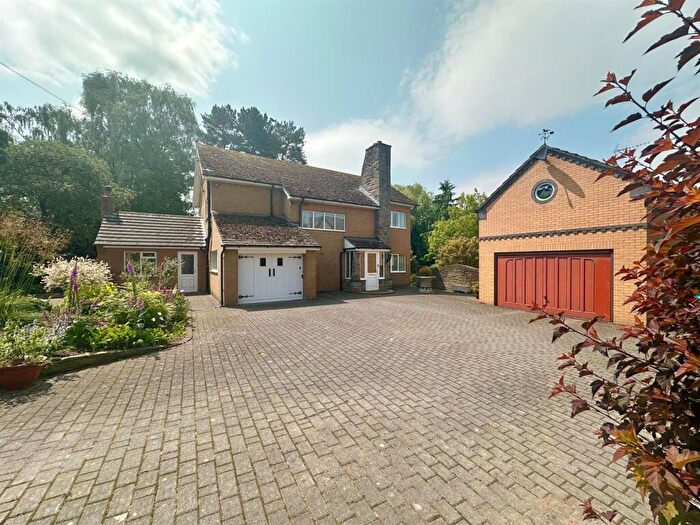
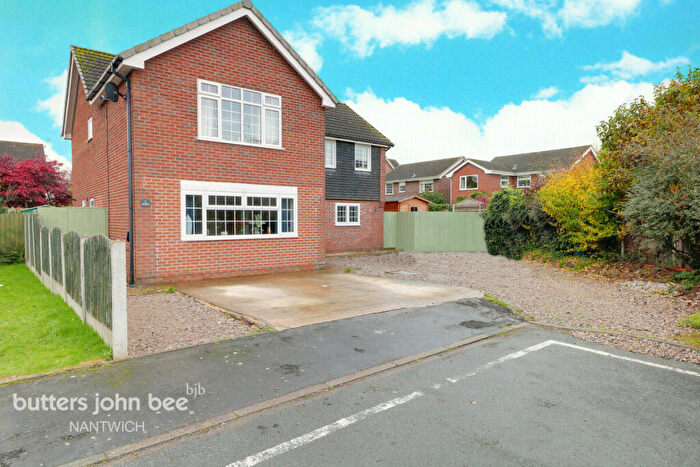
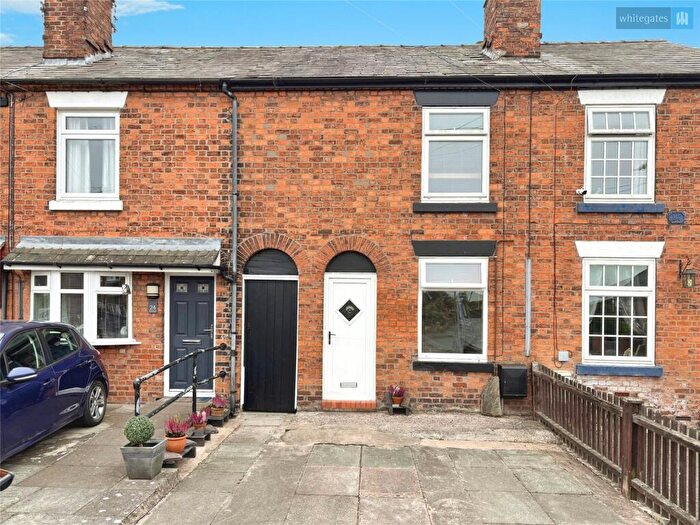
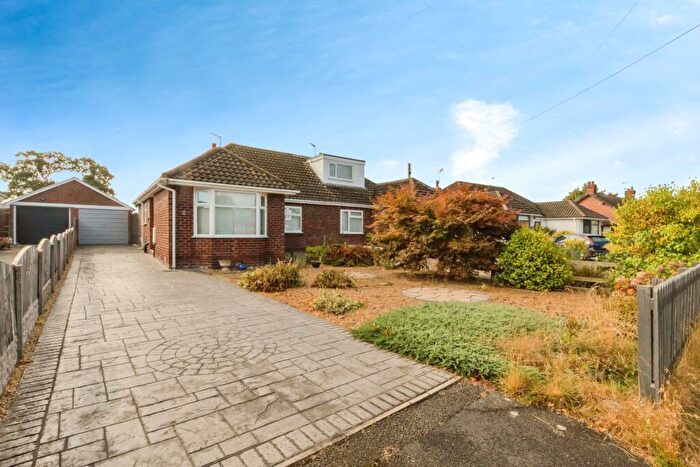
Properties for sale in Willaston And Rope
Roads and Postcodes in Willaston And Rope
Navigate through our locations to find the location of your next house in Willaston And Rope, Nantwich for sale or to rent.
| Streets | Postcodes |
|---|---|
| Amys Meadow | CW5 6LG |
| Arden Close | CW5 7TN |
| Ashlea Drive | CW5 7HZ |
| Balmoral Place | CW5 7HN |
| Bannacks Close | CW5 6RP |
| Basset Close | CW5 6RJ |
| Bayley Road | CW5 6RL |
| Bebbington Way | CW5 7TH |
| Beech Tree Close | CW5 6PR |
| Boden Drive | CW5 7HP |
| Brassey Way | CW5 6RW |
| Brogden Drive | CW5 6SX |
| Cedar Court | CW5 6RB |
| Cheerbrook Road | CW5 7EN |
| Cheney Close | CW5 7TQ |
| Circle Avenue | CW5 7HX |
| Coppice Road | CW5 6QA CW5 6QD |
| Cubitt Close | CW5 6SY |
| Dairyfields Road | CW5 7TD |
| Derwent Close | CW5 6QQ |
| Eastern Road | CW5 7HS CW5 7HT CW5 7HU |
| Gerards Gardens | CW5 6EN |
| Gladstone Street | CW5 6QN |
| Glover Drive | CW5 7TL |
| Green Lane | CW5 7HY CW5 7JB |
| Greenbank Close | CW5 6QR |
| Heald Way | CW5 6SQ CW5 6SR |
| Hollybush Crescent | CW5 6PP |
| Howells Place | CW5 7TJ |
| Illidge Close | CW5 7SR |
| John Gresty Drive | CW5 6RH |
| Kensington Drive | CW5 7HL |
| Lomax Road | CW5 6RN |
| Magpie Lane | CW5 6GS |
| Masonic Gardens | CW5 7TR |
| Meadow Grange | CW5 7ER |
| Meadow View | CW5 6EQ |
| Moorfields | CW5 6QY CW5 6QZ |
| Murrayfield Drive | CW5 6QE CW5 6QF |
| Newcastle Road | CW5 7EL CW5 7TE |
| Oak Bank Close | CW5 7JA |
| Orchard Street | CW5 6QW |
| Pace Avenue | CW5 7TG |
| Park Mills Close | CW5 6RQ |
| Park Road | CW5 6PL CW5 6PN CW5 6PW |
| Potter Close | CW5 7HQ |
| Riddles Avenue | CW5 6ST |
| Rope Hall Lane | CW5 7TS |
| Shannon Close | CW5 6QG |
| Stephenson Street | CW5 6SS |
| The Fields | CW5 7EW |
| The Paddock | CW5 7HJ |
| The Spinney | CW5 6RA |
| Trevithick Place | CW5 6SU |
| Tricketts Lane | CW5 6PY CW5 6PZ |
| Tricketts Mews | CW5 6PS |
| Victoria Mill Drive | CW5 6RR |
| Wistaston Road | CW5 6PT CW5 6PU CW5 6PX CW5 6QJ CW5 6QL CW5 6QP CW5 6QS CW5 6QT CW5 6QU |
| Wybunbury Road | CW5 7JE CW5 7JF |
Transport near Willaston And Rope
-
Nantwich Station
-
Crewe Station
-
Wrenbury Station
-
Sandbach Station
-
Alsager Station
-
Winsford Station
-
Kidsgrove Station
- FAQ
- Price Paid By Year
- Property Type Price
Frequently asked questions about Willaston And Rope
What is the average price for a property for sale in Willaston And Rope?
The average price for a property for sale in Willaston And Rope is £310,033. This amount is 2% lower than the average price in Nantwich. There are 196 property listings for sale in Willaston And Rope.
What streets have the most expensive properties for sale in Willaston And Rope?
The streets with the most expensive properties for sale in Willaston And Rope are The Paddock at an average of £777,500, Gerards Gardens at an average of £575,000 and Newcastle Road at an average of £527,500.
What streets have the most affordable properties for sale in Willaston And Rope?
The streets with the most affordable properties for sale in Willaston And Rope are Bebbington Way at an average of £110,000, Orchard Street at an average of £164,785 and Victoria Mill Drive at an average of £197,416.
Which train stations are available in or near Willaston And Rope?
Some of the train stations available in or near Willaston And Rope are Nantwich, Crewe and Wrenbury.
Property Price Paid in Willaston And Rope by Year
The average sold property price by year was:
| Year | Average Sold Price | Price Change |
Sold Properties
|
|---|---|---|---|
| 2025 | £295,872 | -4% |
61 Properties |
| 2024 | £307,966 | -6% |
60 Properties |
| 2023 | £327,365 | 7% |
57 Properties |
| 2022 | £304,498 | 11% |
87 Properties |
| 2021 | £271,872 | 13% |
135 Properties |
| 2020 | £236,324 | -13% |
114 Properties |
| 2019 | £267,807 | 4% |
87 Properties |
| 2018 | £258,319 | 10% |
62 Properties |
| 2017 | £233,118 | -9% |
82 Properties |
| 2016 | £253,845 | 5% |
68 Properties |
| 2015 | £240,329 | 14% |
60 Properties |
| 2014 | £205,836 | 6% |
51 Properties |
| 2013 | £193,908 | 12% |
49 Properties |
| 2012 | £170,474 | -10% |
41 Properties |
| 2011 | £187,627 | -16% |
31 Properties |
| 2010 | £217,307 | -2% |
39 Properties |
| 2009 | £220,661 | 10% |
55 Properties |
| 2008 | £198,429 | -6% |
29 Properties |
| 2007 | £210,437 | 8% |
75 Properties |
| 2006 | £193,454 | 4% |
57 Properties |
| 2005 | £186,368 | 14% |
57 Properties |
| 2004 | £160,338 | 3% |
72 Properties |
| 2003 | £154,993 | 26% |
65 Properties |
| 2002 | £114,382 | 6% |
75 Properties |
| 2001 | £107,128 | 6% |
122 Properties |
| 2000 | £100,482 | 4% |
115 Properties |
| 1999 | £96,094 | -8% |
72 Properties |
| 1998 | £103,599 | 21% |
85 Properties |
| 1997 | £82,262 | 30% |
58 Properties |
| 1996 | £57,776 | 3% |
41 Properties |
| 1995 | £55,811 | - |
22 Properties |
Property Price per Property Type in Willaston And Rope
Here you can find historic sold price data in order to help with your property search.
The average Property Paid Price for specific property types in the last three years are:
| Property Type | Average Sold Price | Sold Properties |
|---|---|---|
| Semi Detached House | £259,423.00 | 66 Semi Detached Houses |
| Detached House | £423,197.00 | 73 Detached Houses |
| Terraced House | £186,474.00 | 36 Terraced Houses |
| Flat | £152,500.00 | 3 Flats |

