
Houses for sale in Nantwich, Cheshire
House Prices in Nantwich
Properties in Nantwich have an average house price of £318k and had 1,640 Property Transactions within the last 3 years.¹
Nantwich is an area in Cheshire with 14,599 households², where the most expensive property was sold for £1.8M.
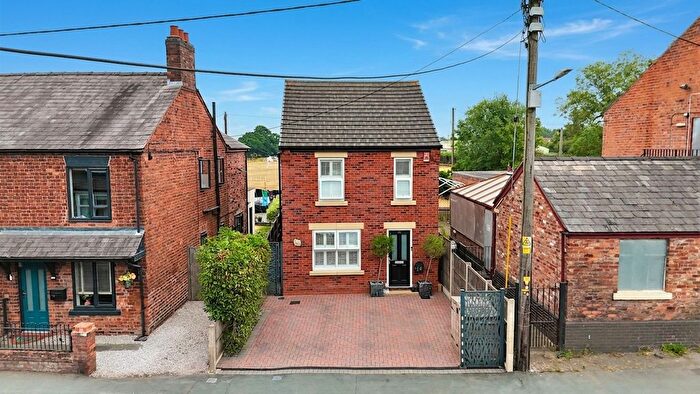
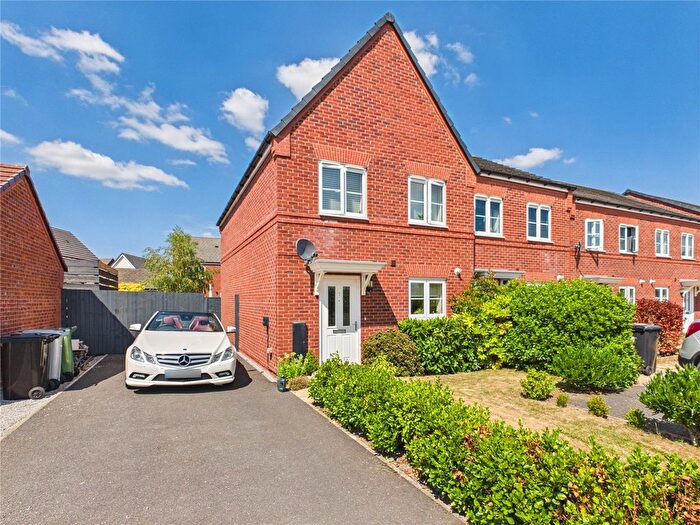
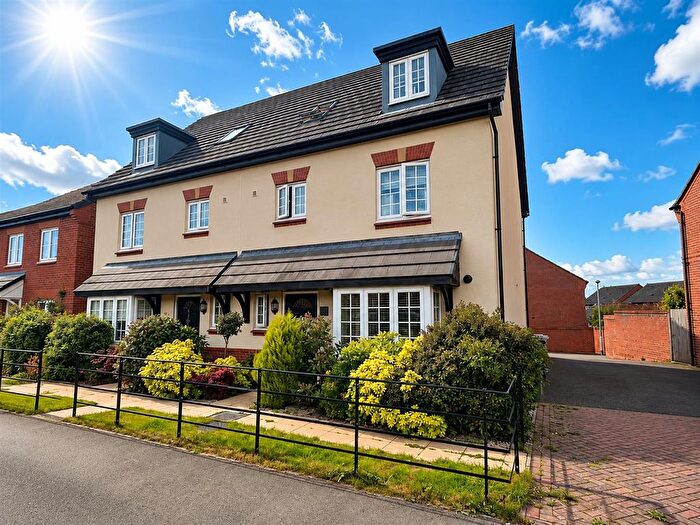
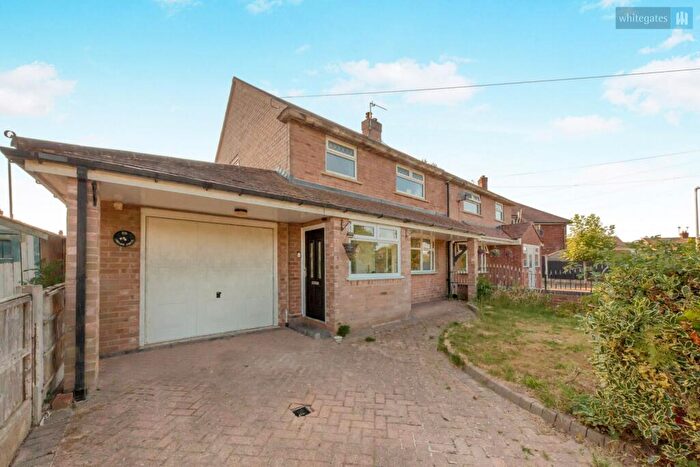
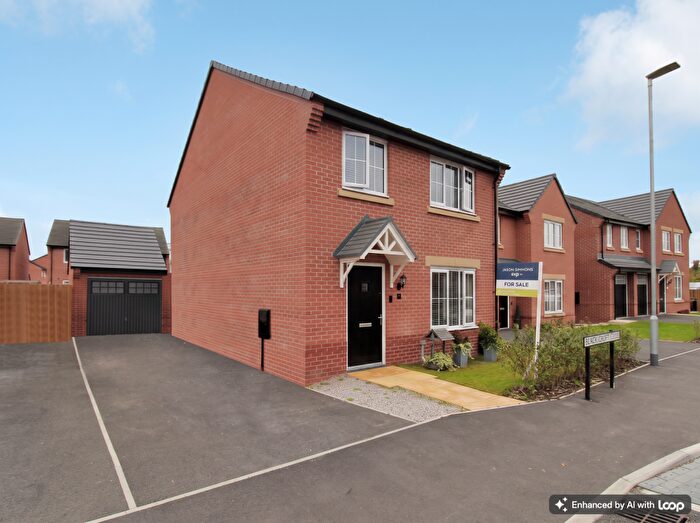
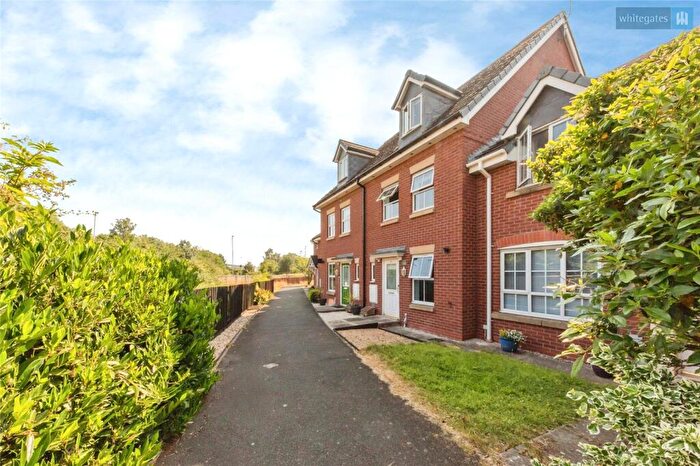
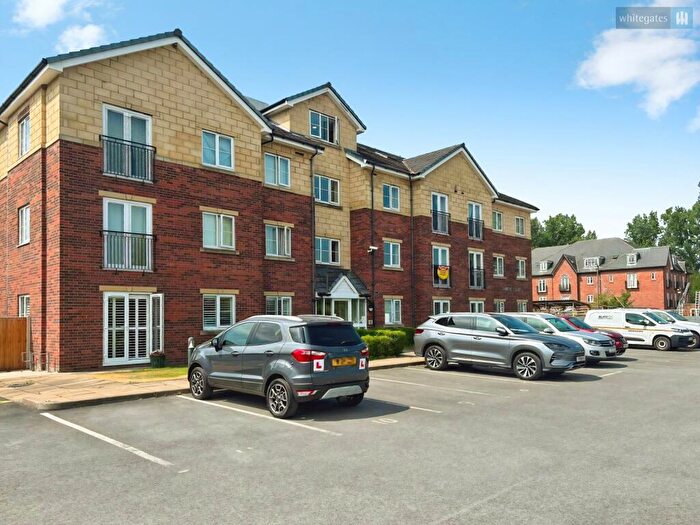
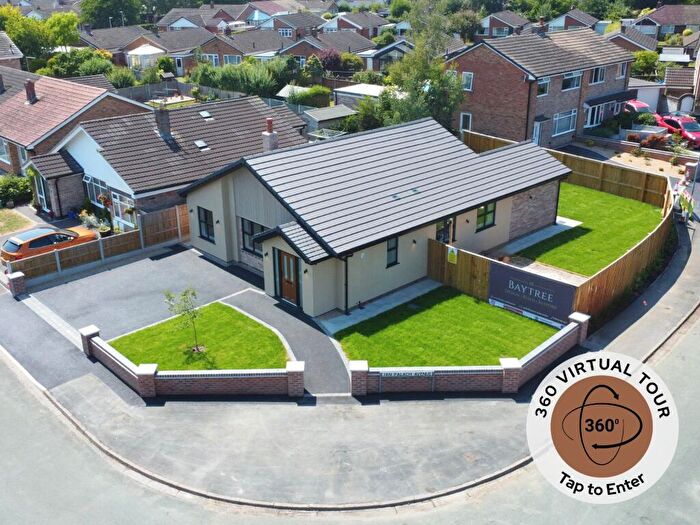
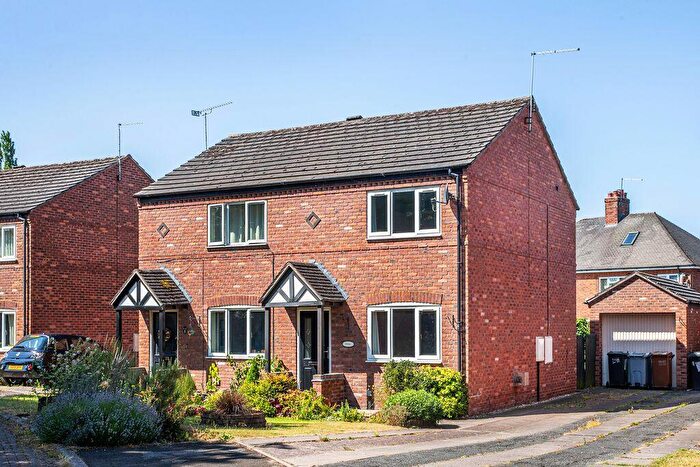
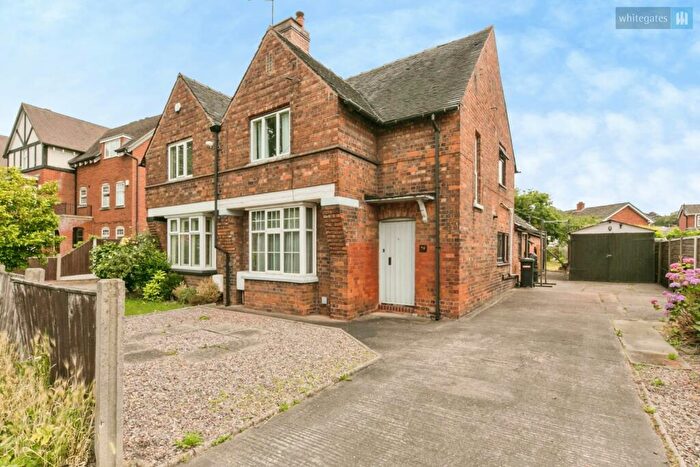
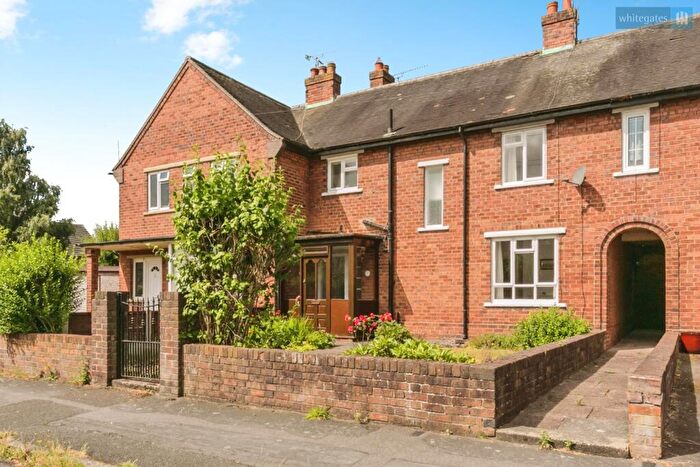
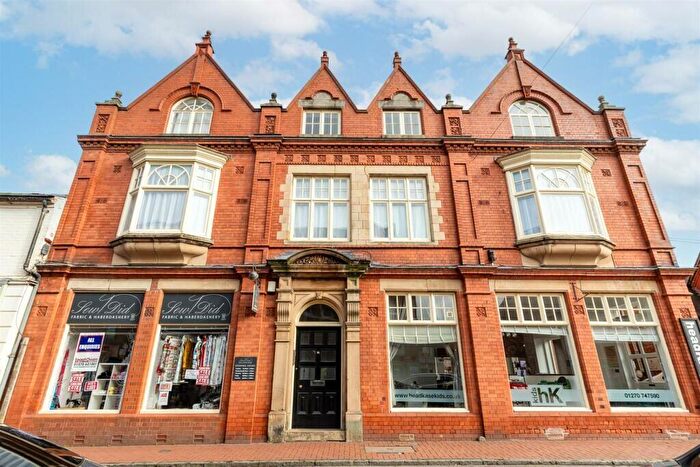
Properties for sale in Nantwich
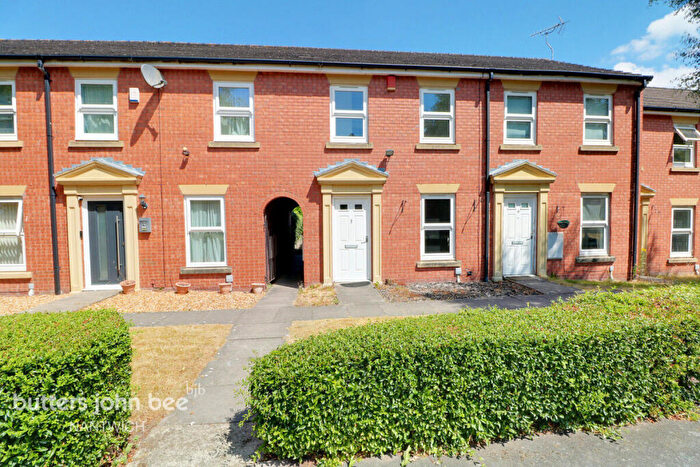
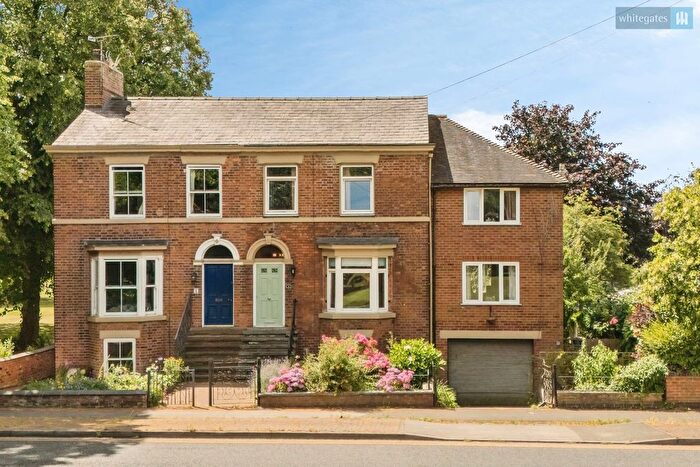
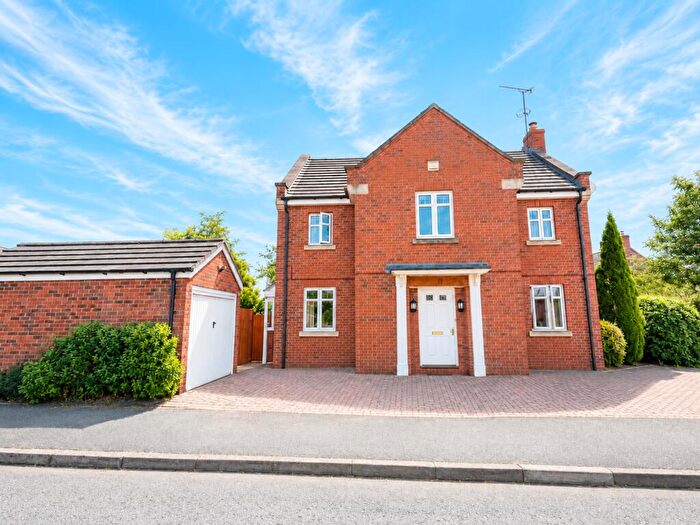
![]()
If you are looking to sell your house, let it out, or receive a property valuation, an expert can help you.
Click the button below to get started.
Neighbourhoods in Nantwich
Navigate through our locations to find the location of your next house in Nantwich, Cheshire for sale or to rent.
Property price trends in Nantwich
According to the latest Land Registry data, the average home in Nantwich sold for £309,694 in 2026. That figure comes from a substantial record of 19,263 sales logged over the past 31 years.
Prices have held fairly steady over the last three years. Compared with 2023, when the typical sale came in around £306,954, values are broadly unchanged.
Looking back five years, average prices are up about 3.2% since 2021, a gain of around £9,490 in cash terms.
Zoom out to the past decade for the fuller picture. Back in 2016, homes here averaged £242,958, so the typical sold price has climbed about 27.5% since then, roughly 2.5% a year. Stretch the view to fifteen years and that annual pace edges up closer to 2.8%.
Frequently asked questions about Nantwich
What is the average price for a property for sale in Nantwich?
The average price for a property for sale in Nantwich is £318,090. This amount is 1% lower than the average price in Cheshire. There are more than 10,000 property listings for sale in Nantwich.
What locations have the most expensive properties for sale in Nantwich?
The locations with the most expensive properties for sale in Nantwich are Audlem at an average of £482,226, Wybunbury at an average of £441,100 and Wistaston at an average of £427,583.
What locations have the most affordable properties for sale in Nantwich?
The locations with the most affordable properties for sale in Nantwich are Shavington at an average of £210,000, Nantwich North And West at an average of £247,456 and Nantwich South And Stapeley at an average of £298,599.
Which train stations are available in or near Nantwich?
Some of the train stations available in or near Nantwich are Nantwich, Crewe and Wrenbury.
Property Price Paid in Nantwich by Year
The average sold property price by year was:
| Year | Average Sold Price | Price Change |
Sold Properties
|
|---|---|---|---|
| 2026 | £309,694 | -2% |
34 Properties |
| 2025 | £314,721 | -5% |
567 Properties |
| 2024 | £331,847 | 8% |
553 Properties |
| 2023 | £306,954 | -1% |
486 Properties |
| 2022 | £309,583 | 3% |
636 Properties |
| 2021 | £300,204 | 9% |
898 Properties |
| 2020 | £274,580 | 4% |
695 Properties |
| 2019 | £263,874 | -3% |
804 Properties |
| 2018 | £271,175 | 6% |
722 Properties |
| 2017 | £255,254 | 5% |
699 Properties |
Property Price per Property Type in Nantwich
Here you can find historic sold price data in order to help with your property search.
The average Property Paid Price for specific property types in the last three years are:
| Property Type | Average Sold Price | Sold Properties |
|---|---|---|
| Semi Detached House | £278,695.00 | 435 Semi Detached Houses |
| Detached House | £470,500.00 | 571 Detached Houses |
| Terraced House | £235,938.00 | 405 Terraced Houses |
| Flat | £158,186.00 | 229 Flats |
Transport in Nantwich
Please see below transportation links in this area:
