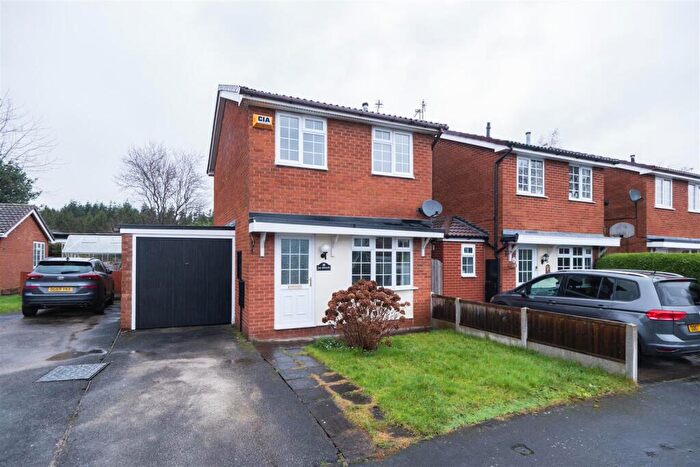
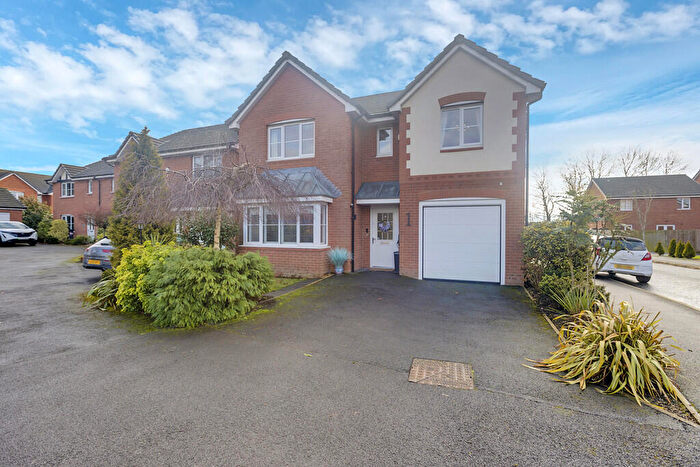
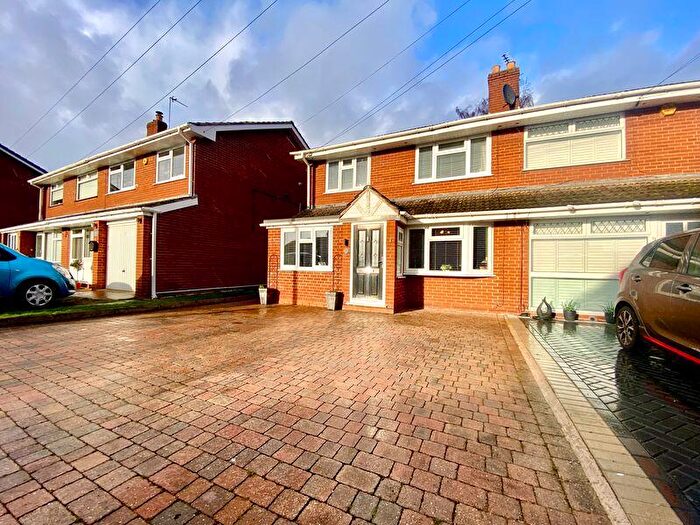
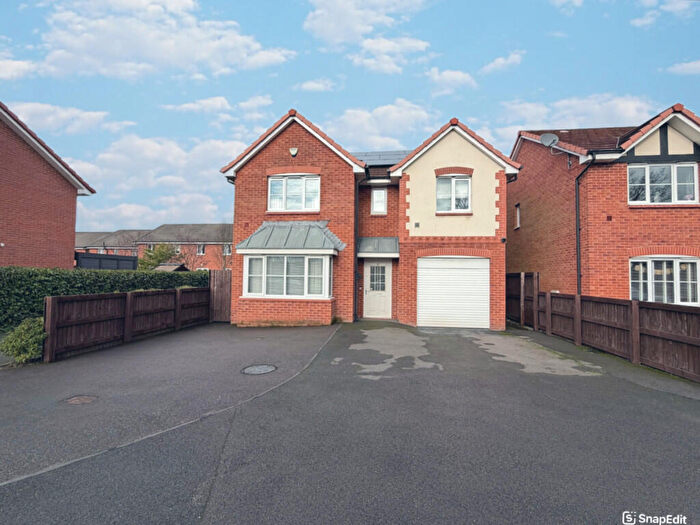
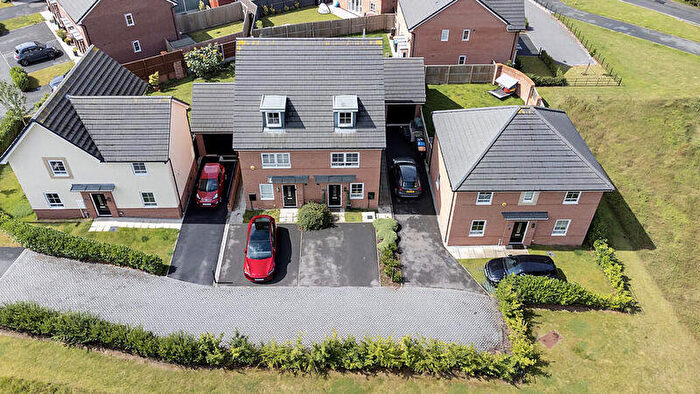
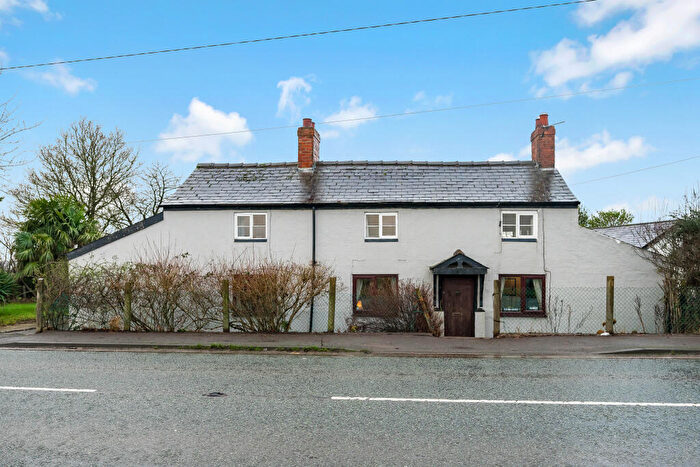
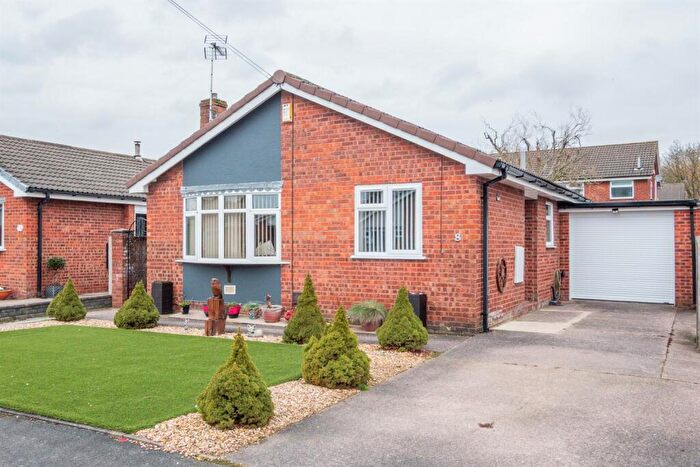
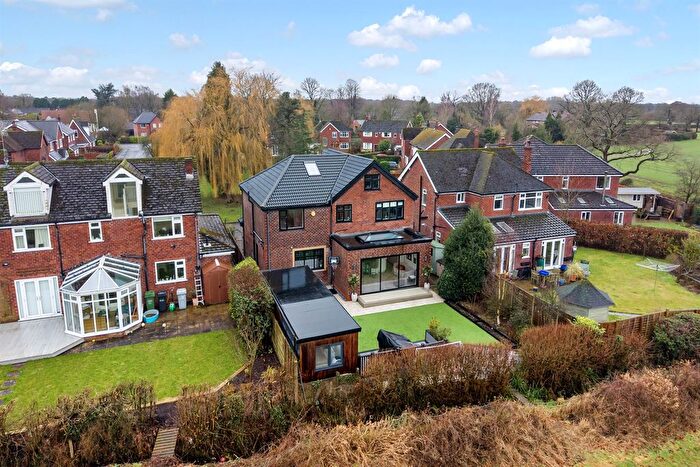
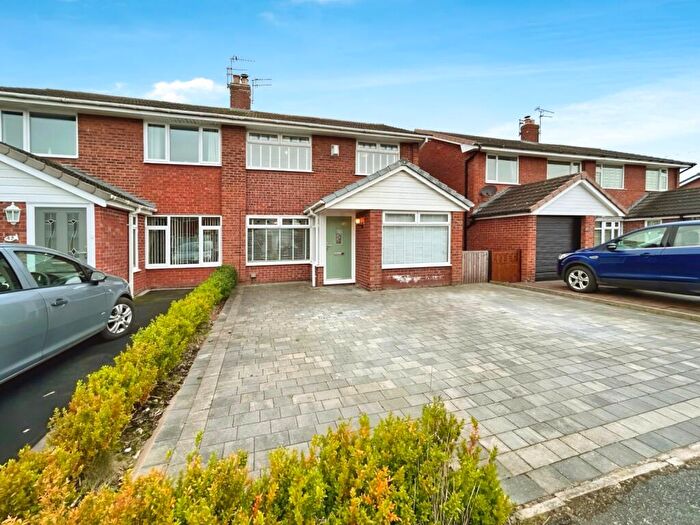
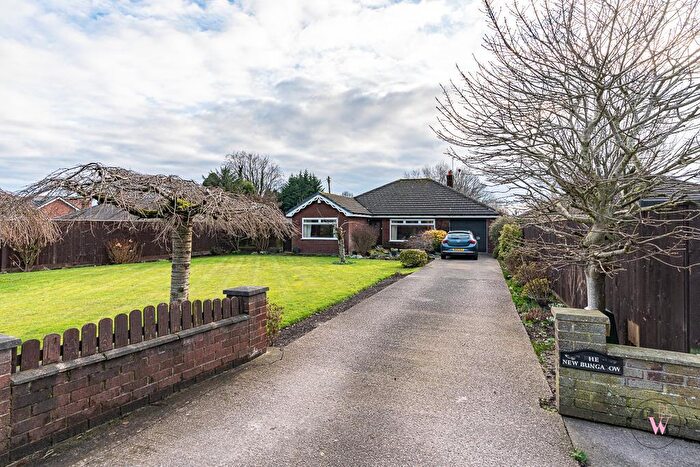
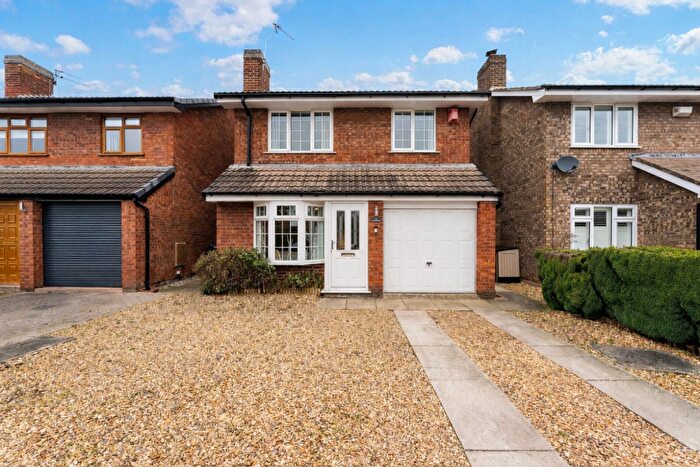
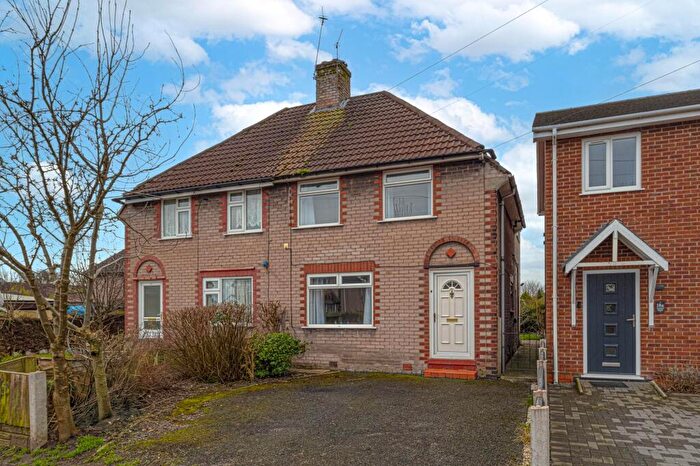
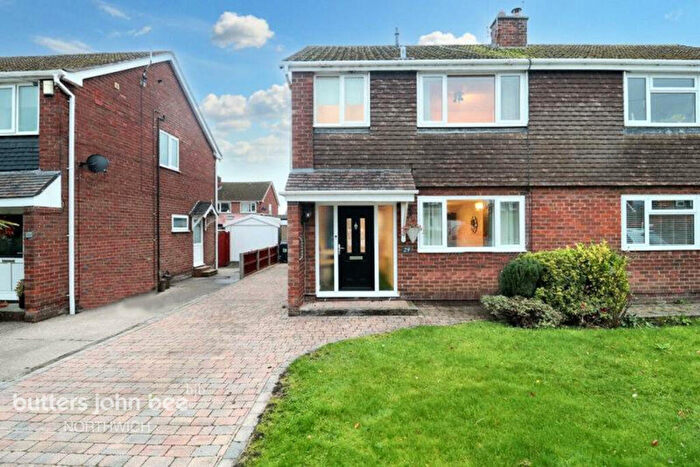
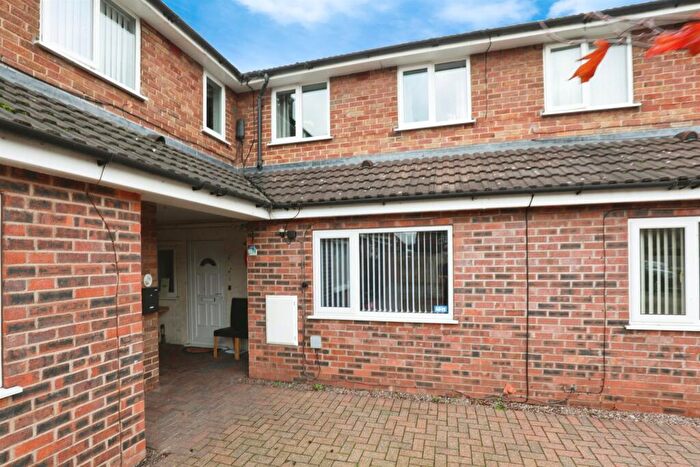
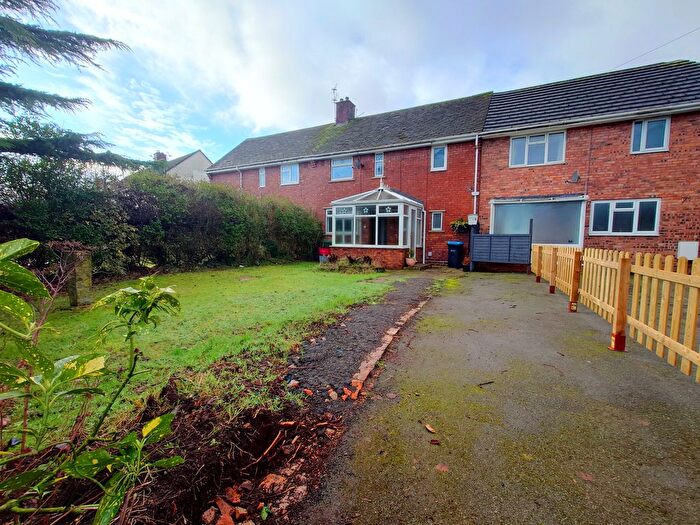
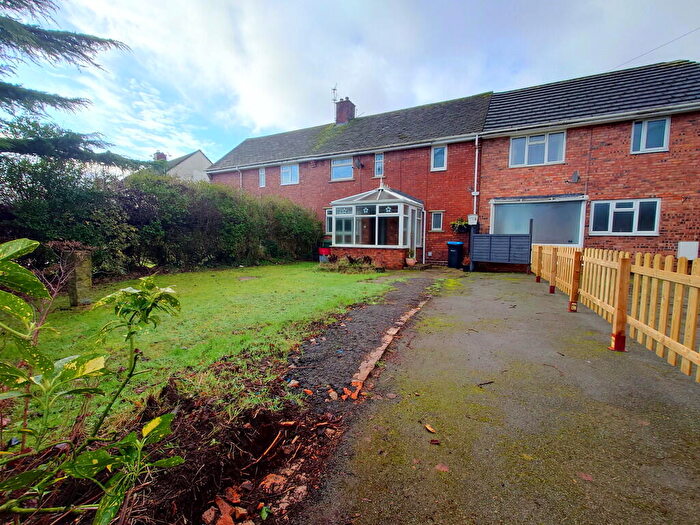
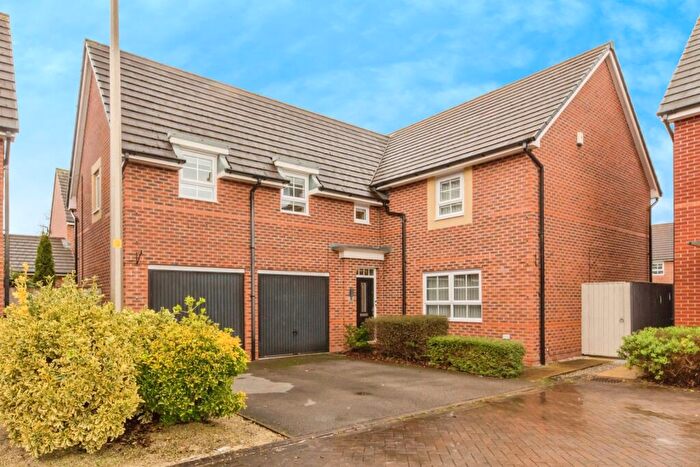
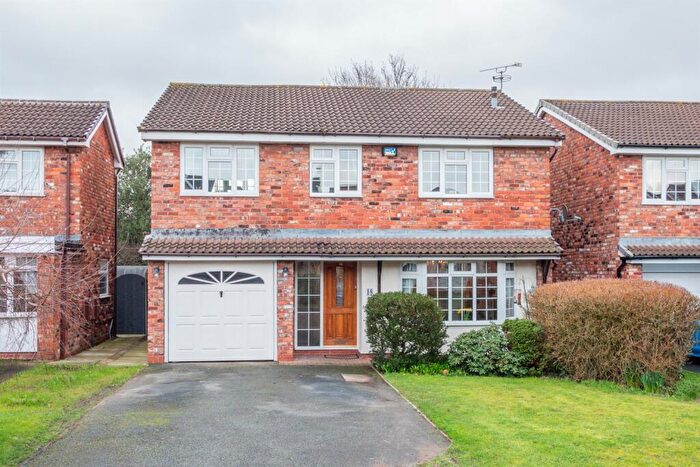
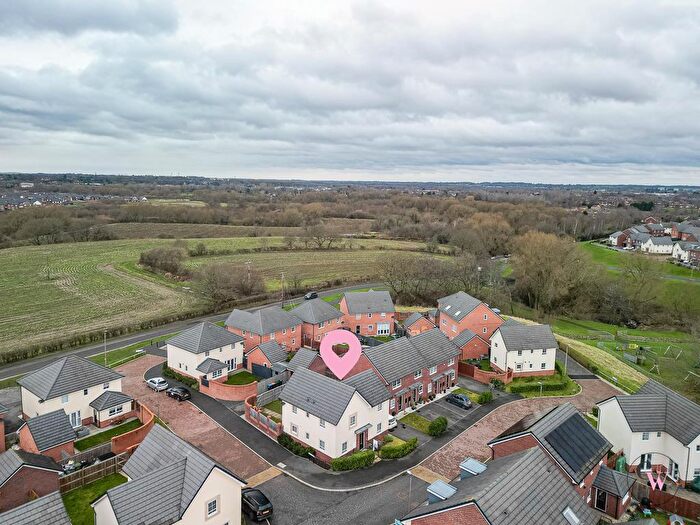
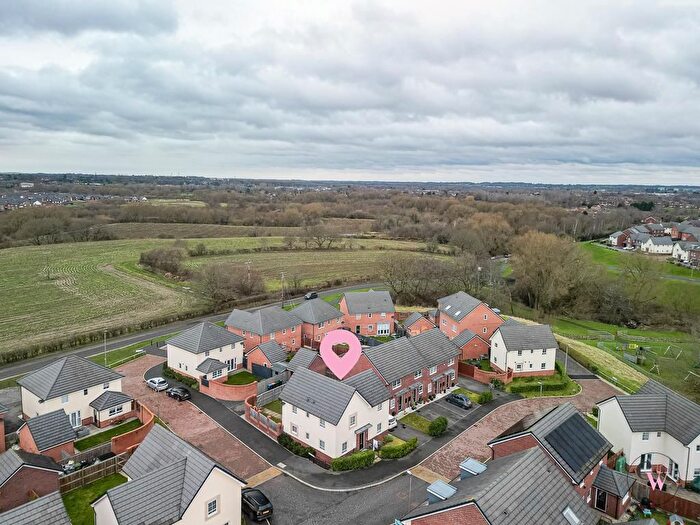
Houses for sale & to rent in Shakerley, Northwich
House Prices in Shakerley
Properties in Shakerley have an average house price of £301,356.00 and had 128 Property Transactions within the last 3 years¹.
Shakerley is an area in Northwich, Cheshire with 1,035 households², where the most expensive property was sold for £1,250,000.00.
Properties for sale in Shakerley
Roads and Postcodes in Shakerley
Navigate through our locations to find the location of your next house in Shakerley, Northwich for sale or to rent.
| Streets | Postcodes |
|---|---|
| Aitchison Road | CW9 7PB |
| Arthur Street | CW9 7PR |
| Bateman Road | CW9 7PD |
| Birch Grove | CW9 7SS |
| Birches Lane | CW9 7SL CW9 7SN CW9 7SX CW9 7SU |
| Broseley Way | CW9 7YH |
| Cedar Close | CW9 7XA |
| Cherish Road | CW9 7FP |
| Cheshire Avenue | CW9 7YL CW9 7YN |
| Cheshire Business Park | CW9 7UA |
| Cinder Lane | CW9 7SP |
| Common Lane | CW9 7TB CW9 7TE |
| Egerton Terrace | CW9 7TA |
| Fitton Street | CW9 7PW |
| Fryer Road | CW9 7QF |
| Gibbon Drive | CW9 7QE |
| Gralam Grove | CW9 7YJ |
| Greenfields Close | CW9 7TJ |
| Greenside Drive | CW9 7SR |
| Griffiths Road | CW9 7NU |
| Grove Avenue | CW9 7QX |
| Hangmans Lane | CW9 7ST |
| Harris Road | CW9 7PE CW9 7PF |
| Herbert Street | CW9 7PP |
| Hesketh Drive | CW9 7QJ |
| Highfield Avenue | CW9 7QQ |
| Holford | CW9 7TD |
| Holford Avenue | CW9 7QN |
| Holmes Chapel Road | CW9 7SY CW9 7SZ |
| Hulse Lane | CW9 7TF |
| King Street | CW9 7RX CW9 7SE |
| Langford Road | CW9 7QP CW9 7QR CW9 7QU |
| Lions Den | CW9 7YF |
| Lodge Lane | CW9 7PH |
| Mainwaring Drive | CW9 7YY |
| Manchester Road | CW9 7NT CW9 7PJ CW9 7PL CW9 7PY CW9 7QA CW9 7QB CW9 7QD CW9 7XG |
| Moss Lane | CW9 7TG |
| Pack Horse Close | CW9 7FJ |
| Paulden Road | CW9 7PQ |
| Pavillion Way | CW9 7YE |
| Pennys Lane | CW9 7SJ |
| Roberts Road | CW9 7PG |
| Rose Tree Meadow | CW9 7PA CW9 7PS |
| Salary Row | CW9 7YD |
| School Lane | CW9 7PT |
| Silverlea Road | CW9 7FE |
| Smithy Lane | CW9 7PZ |
| St Johns Avenue | CW9 7QT |
| Station Road | CW9 7PN |
| Stubbs Lane | CW9 7PU CW9 7FQ |
| Sweet Water Court | CW9 7FG |
| The Evergreens | CW9 7PX |
| Thornley Green | CW9 7YB |
| Townshend Road | CW9 7QG CW9 7QL CW9 7QW CW9 7QY |
| Vale Royal Close | CW9 7YG |
| Village Close | CW9 7SW |
| Warren Avenue | CW9 7QS |
| Wells Avenue | CW9 7XR |
| Wilson Crescent | CW9 7QH |
| CW9 7SH CW9 7TH |
Transport near Shakerley
- FAQ
- Price Paid By Year
- Property Type Price
Frequently asked questions about Shakerley
What is the average price for a property for sale in Shakerley?
The average price for a property for sale in Shakerley is £301,356. This amount is 7% higher than the average price in Northwich. There are 1,380 property listings for sale in Shakerley.
What streets have the most expensive properties for sale in Shakerley?
The streets with the most expensive properties for sale in Shakerley are Holmes Chapel Road at an average of £737,166, Common Lane at an average of £548,468 and Hulse Lane at an average of £462,102.
What streets have the most affordable properties for sale in Shakerley?
The streets with the most affordable properties for sale in Shakerley are Langford Road at an average of £145,000, Salary Row at an average of £146,500 and Holford Avenue at an average of £147,000.
Which train stations are available in or near Shakerley?
Some of the train stations available in or near Shakerley are Lostock Gralam, Northwich and Plumley.
Property Price Paid in Shakerley by Year
The average sold property price by year was:
| Year | Average Sold Price | Price Change |
Sold Properties
|
|---|---|---|---|
| 2025 | £338,492 | 19% |
43 Properties |
| 2024 | £275,738 | -6% |
49 Properties |
| 2023 | £291,867 | 8% |
36 Properties |
| 2022 | £268,022 | -9% |
42 Properties |
| 2021 | £292,369 | 22% |
64 Properties |
| 2020 | £227,283 | 11% |
48 Properties |
| 2019 | £202,587 | -36% |
46 Properties |
| 2018 | £275,271 | 7% |
59 Properties |
| 2017 | £255,816 | 10% |
72 Properties |
| 2016 | £229,400 | 2% |
101 Properties |
| 2015 | £224,424 | -8% |
90 Properties |
| 2014 | £242,005 | 20% |
57 Properties |
| 2013 | £192,829 | 8% |
43 Properties |
| 2012 | £177,428 | 24% |
31 Properties |
| 2011 | £134,330 | -12% |
25 Properties |
| 2010 | £150,263 | -7% |
25 Properties |
| 2009 | £161,184 | -5% |
25 Properties |
| 2008 | £168,605 | -35% |
19 Properties |
| 2007 | £227,035 | 25% |
35 Properties |
| 2006 | £170,724 | -11% |
50 Properties |
| 2005 | £190,181 | 29% |
35 Properties |
| 2004 | £134,644 | 9% |
49 Properties |
| 2003 | £122,973 | 14% |
50 Properties |
| 2002 | £105,297 | 16% |
48 Properties |
| 2001 | £88,114 | 11% |
37 Properties |
| 2000 | £78,000 | 1% |
49 Properties |
| 1999 | £77,212 | 3% |
46 Properties |
| 1998 | £74,897 | 3% |
28 Properties |
| 1997 | £72,645 | 19% |
34 Properties |
| 1996 | £58,819 | 3% |
34 Properties |
| 1995 | £56,860 | - |
20 Properties |
Property Price per Property Type in Shakerley
Here you can find historic sold price data in order to help with your property search.
The average Property Paid Price for specific property types in the last three years are:
| Property Type | Average Sold Price | Sold Properties |
|---|---|---|
| Semi Detached House | £255,149.00 | 55 Semi Detached Houses |
| Detached House | £418,302.00 | 49 Detached Houses |
| Terraced House | £173,197.00 | 23 Terraced Houses |
| Flat | £60,000.00 | 1 Flat |

