
Houses for sale in High Legh, Northwich
House Prices in High Legh
Properties in High Legh have an average house price of £770k and had 16 Property Transactions within the last 3 years¹.
High Legh is an area in Northwich, Cheshire with 138 households², where the most expensive property was sold for £1.58M.
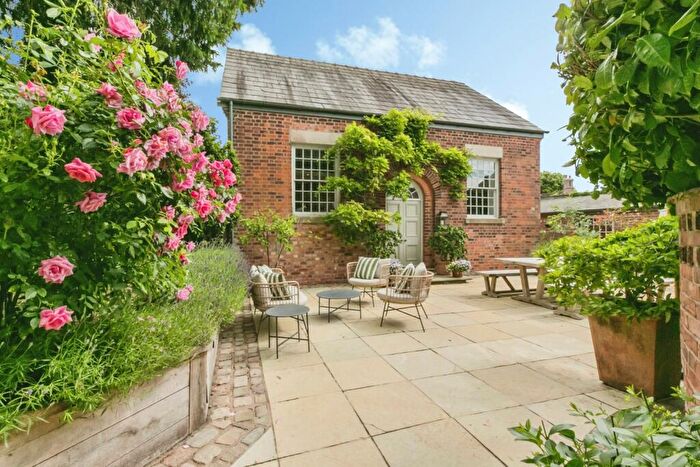
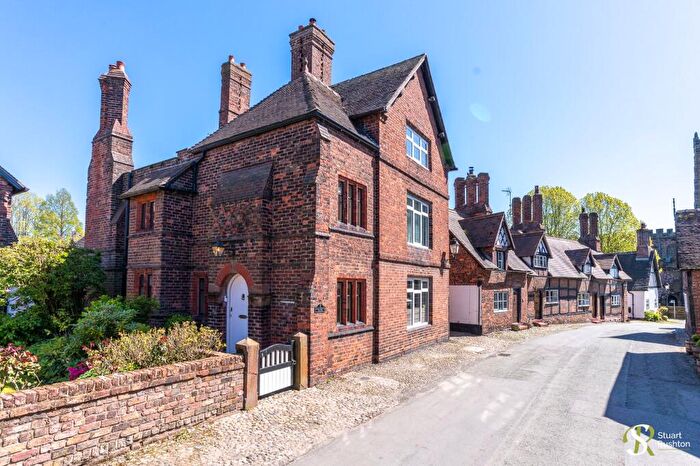
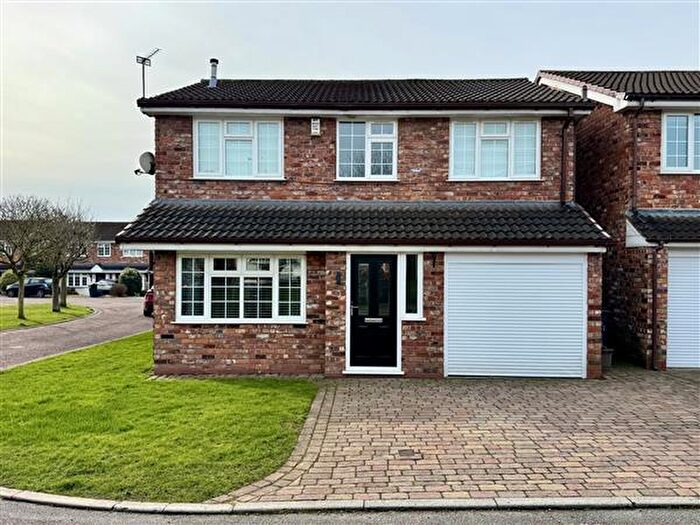
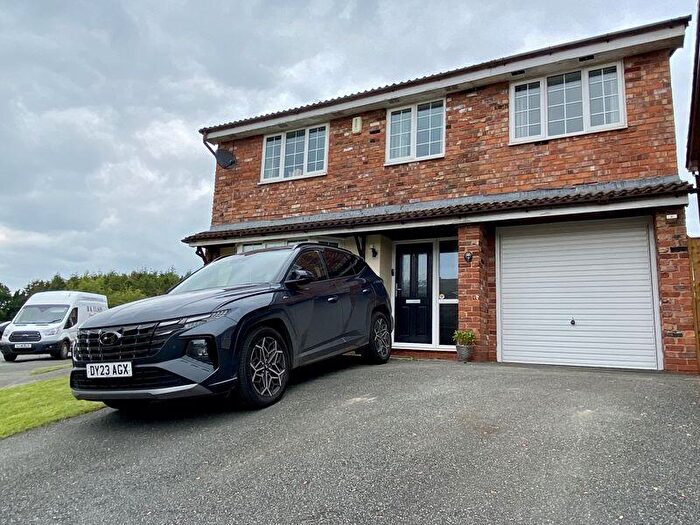
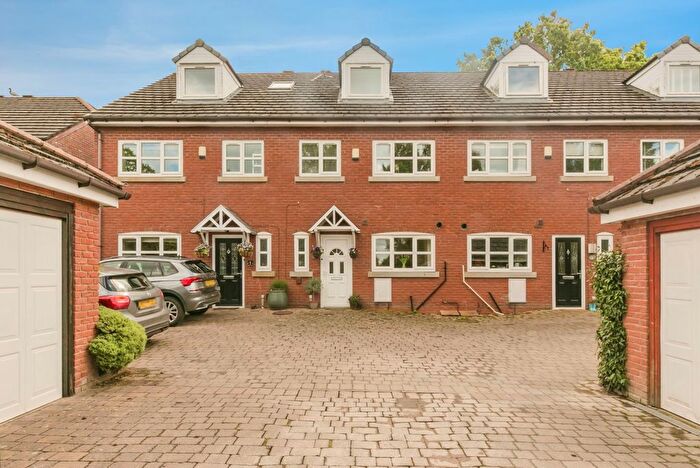
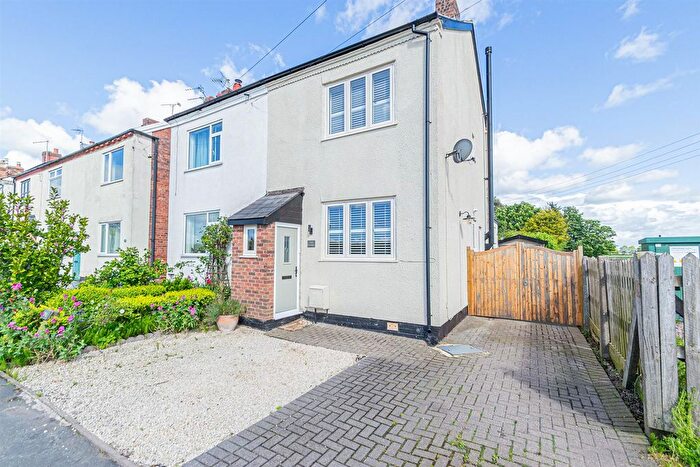
Properties for sale in High Legh
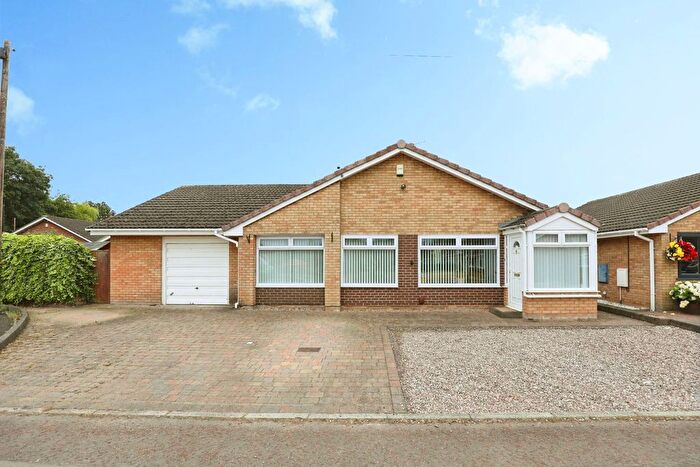
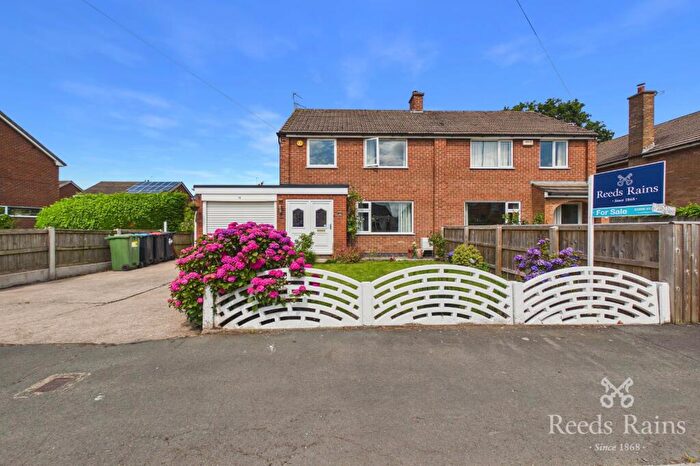
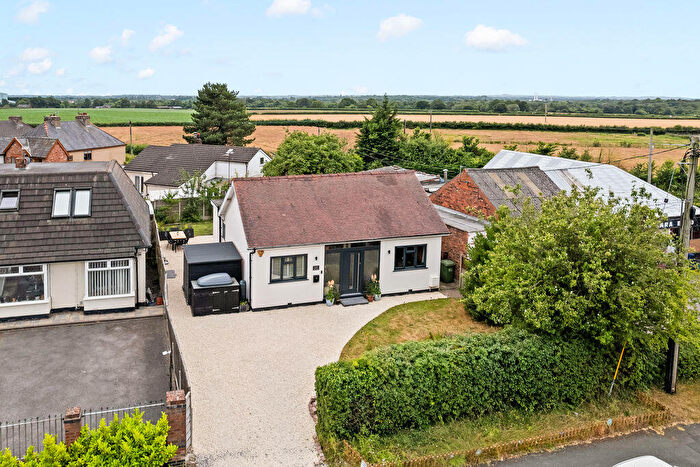
![]()
If you are looking to sell your house, let it out, or receive a property valuation, an expert can help you.
Click the button below to get started.
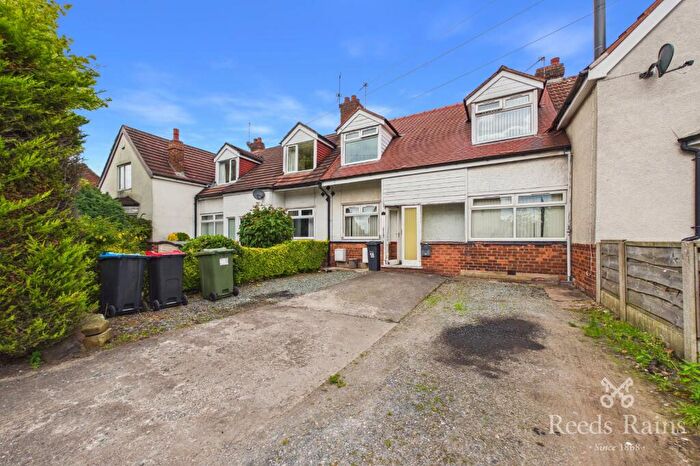
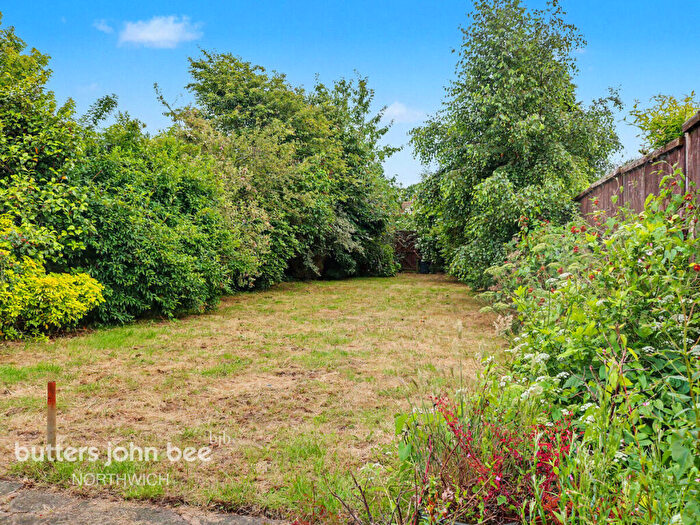
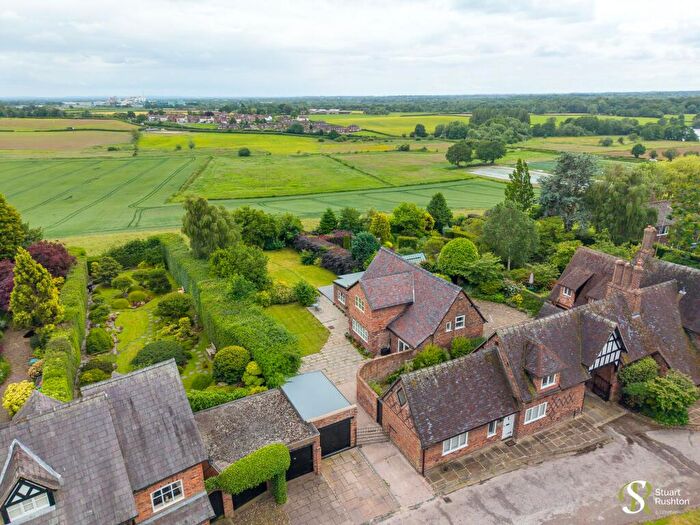
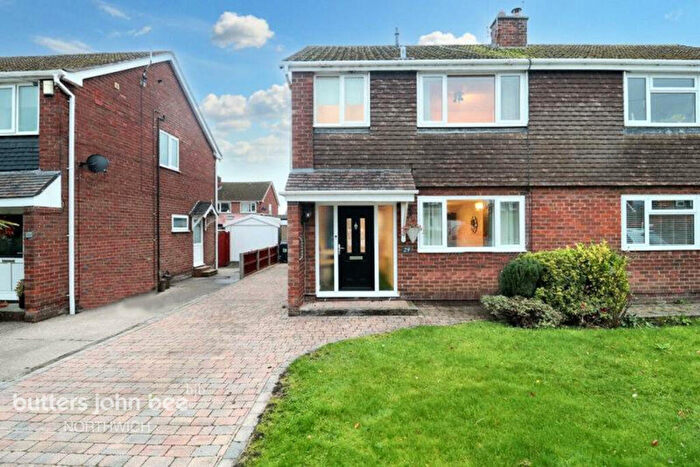
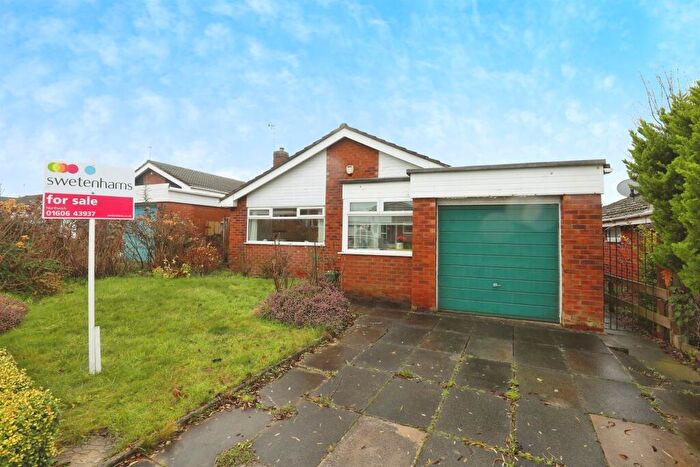
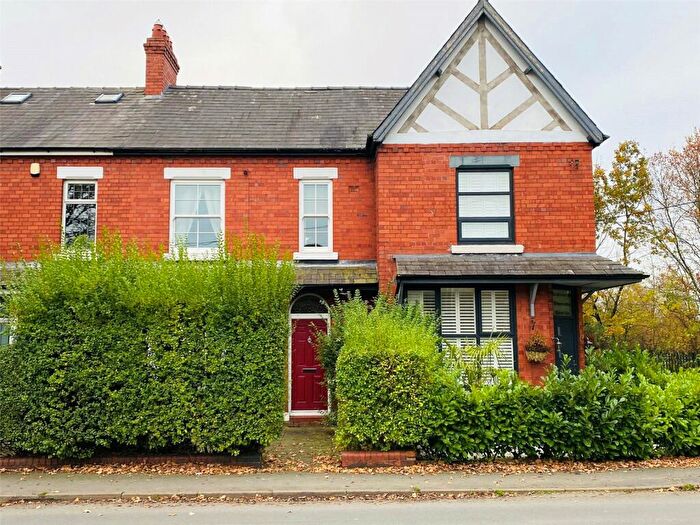
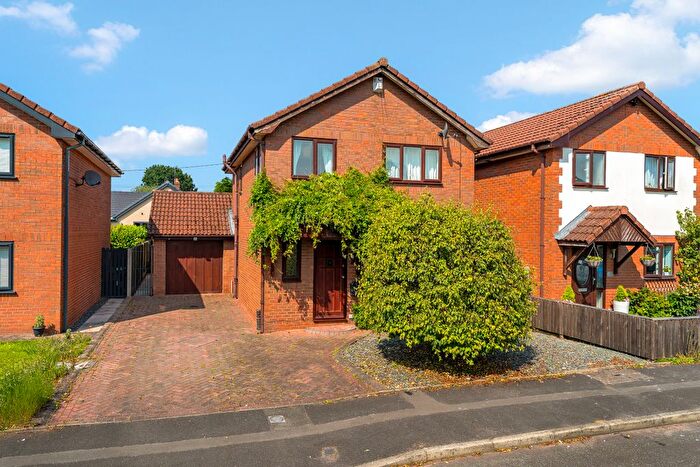
Previously listed properties in High Legh
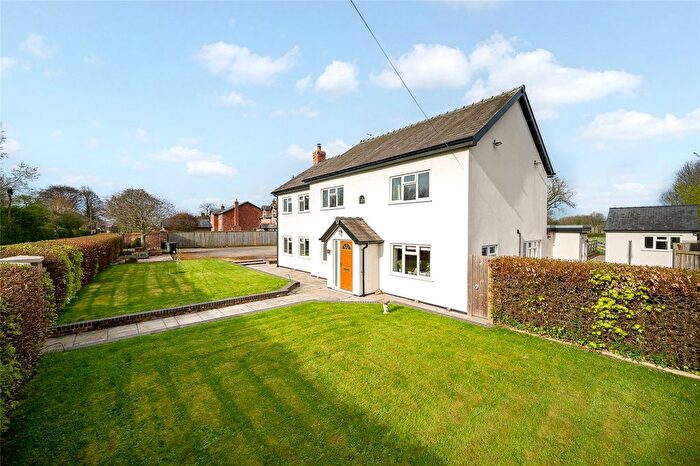
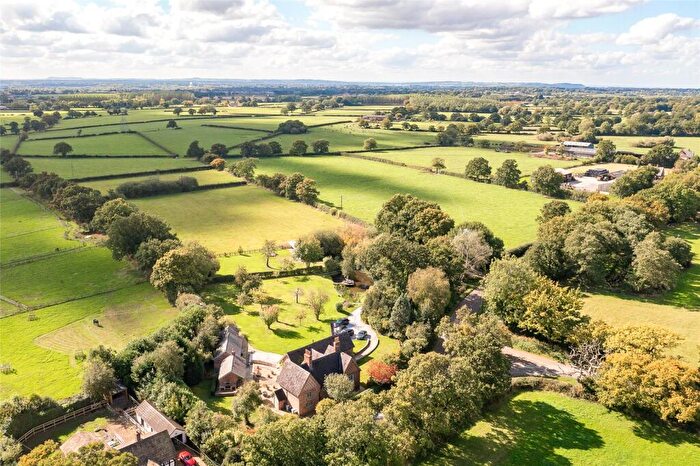
![]()
If you are looking to sell your house, let it out, or receive a property valuation, an expert can help you.
Click the button below to get started.
Roads and Postcodes in High Legh
Navigate through our locations to find the location of your next house in High Legh, Northwich for sale or to rent.
| Streets | Postcodes |
|---|---|
| Budworth Road | CW9 6LT |
| Cann Lane | CW9 6LX |
| Colliers Lane | CW9 6NF |
| Feldy Green Lane | CW9 6LE CW9 6LU |
| Georges Lane | CW9 6LS |
| Hield Grove | CW9 6LN |
| Hield Lane | CW9 6LP |
| Sack Lane | CW9 6LY |
| Stonegate Lane | CW9 6NE |
| Westage Lane | CW9 6LW |
| CW9 6NA CW9 6FZ CW9 6LR CW9 6LZ CW9 6NG |
Property price trends in High Legh
According to the latest Land Registry data, the average home in High Legh sold for £692,714 in 2025. That figure comes from 113 sales logged over the past 30 years.
Prices have fallen back over the last three years. Compared with 2022, when the typical sale came in around £792,333, that's a fall of roughly 12.6%.
Looking back five years, average prices are up about 31.6% since 2020, a gain of around £166,214 in cash terms.
Zoom out to the past decade for the fuller picture. Back in 2015, homes here averaged £451,666, so the typical sold price has climbed about 53.4% since then, roughly 4.4% a year. Stretch the view to fifteen years and that annual pace edges up closer to 5.6%.
Frequently asked questions about High Legh
What is the average price for a property for sale in High Legh?
The average price for a property for sale in High Legh is £770,250. This amount is 172% higher than the average price in Northwich. There are 180 property listings for sale in High Legh.
What streets have the most expensive properties for sale in High Legh?
The streets with the most expensive properties for sale in High Legh are Budworth Road at an average of £712,500 and Sack Lane at an average of £675,000.
What streets have the most affordable properties for sale in High Legh?
The streets with the most affordable properties for sale in High Legh are Hield Grove at an average of £172,500 and Hield Lane at an average of £530,000.
Which train stations are available in or near High Legh?
Some of the train stations available in or near High Legh are Lostock Gralam, Northwich and Plumley.
Property Price Paid in High Legh by Year
The average sold property price by year was:
| Year | Average Sold Price | Price Change |
Sold Properties
|
|---|---|---|---|
| 2025 | £692,714 | 3% |
7 Properties |
| 2024 | £668,750 | -44% |
4 Properties |
| 2023 | £960,000 | 17% |
5 Properties |
| 2022 | £792,333 | -6% |
3 Properties |
| 2021 | £841,944 | 37% |
9 Properties |
| 2020 | £526,500 | 39% |
2 Properties |
| 2019 | £321,666 | -22% |
3 Properties |
| 2018 | £391,249 | -64% |
6 Properties |
| 2017 | £640,000 | 71% |
1 Property |
| 2016 | £185,000 | -144% |
2 Properties |
Property Price per Property Type in High Legh
Here you can find historic sold price data in order to help with your property search.
The average Property Paid Price for specific property types in the last three years are:
| Property Type | Average Sold Price | Sold Properties |
|---|---|---|
| Terraced House | £760,928.00 | 7 Terraced Houses |
| Semi Detached House | £765,833.00 | 3 Semi Detached Houses |
| Detached House | £783,333.00 | 6 Detached Houses |
