
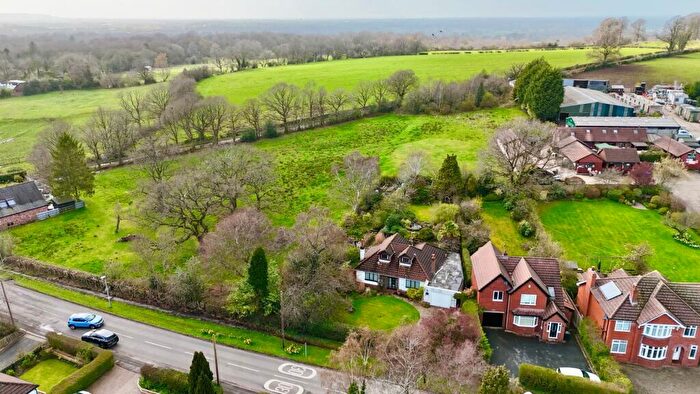
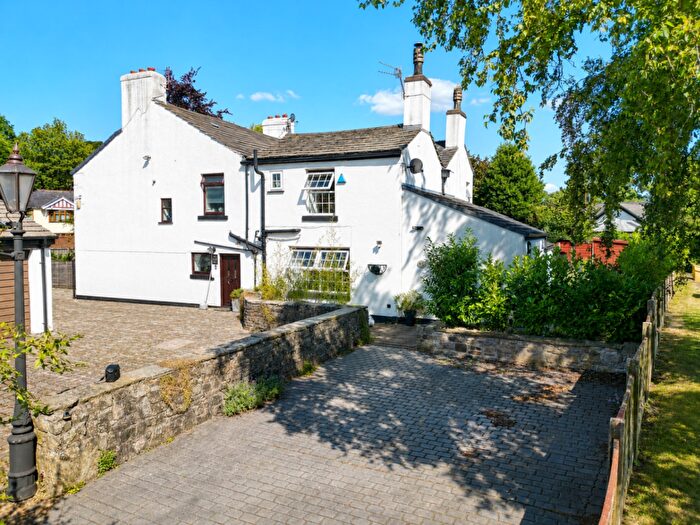
Houses for sale in Stockport, Cheshire
House Prices in Stockport
Properties in Stockport have an average house price of £436k and had 925 Property Transactions within the last 3 years.¹
Stockport is an area in Cheshire with 8,308 households², where the most expensive property was sold for £2.2M.
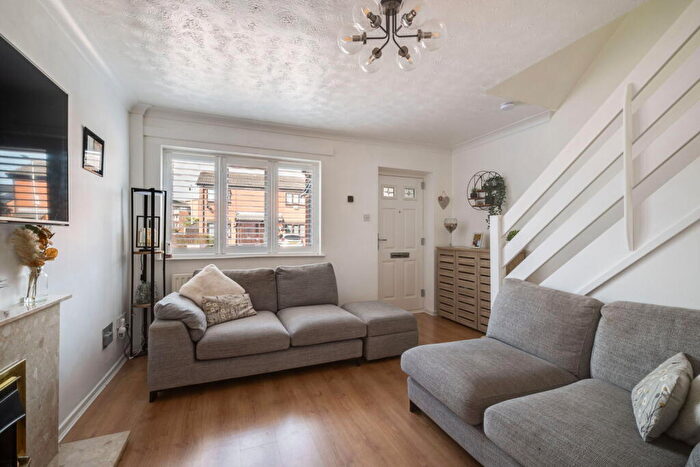
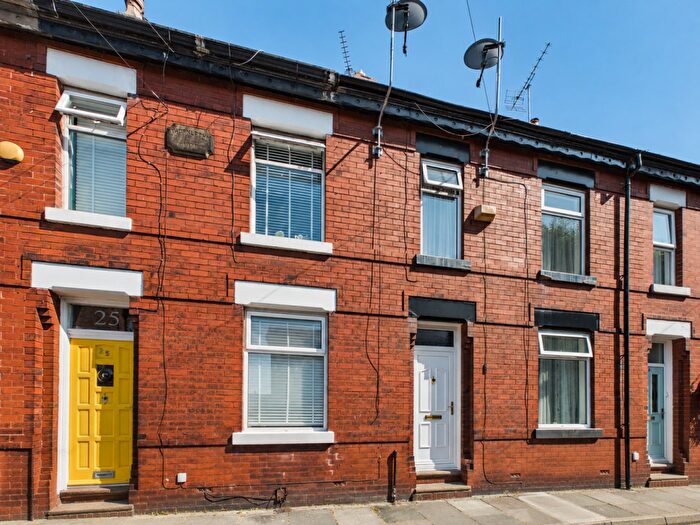
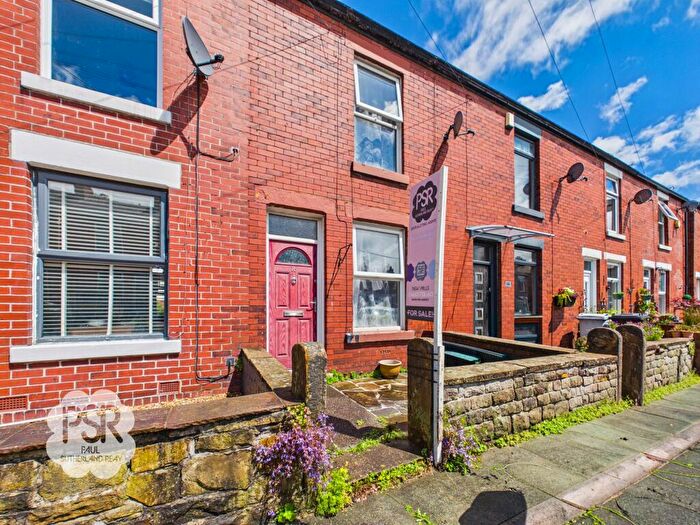
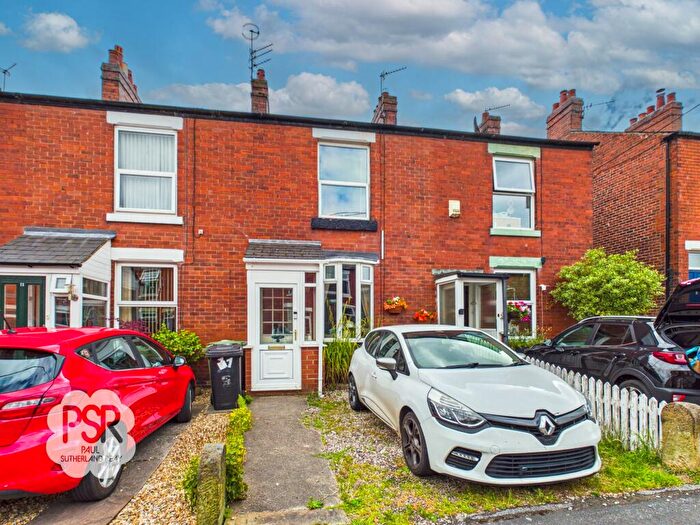
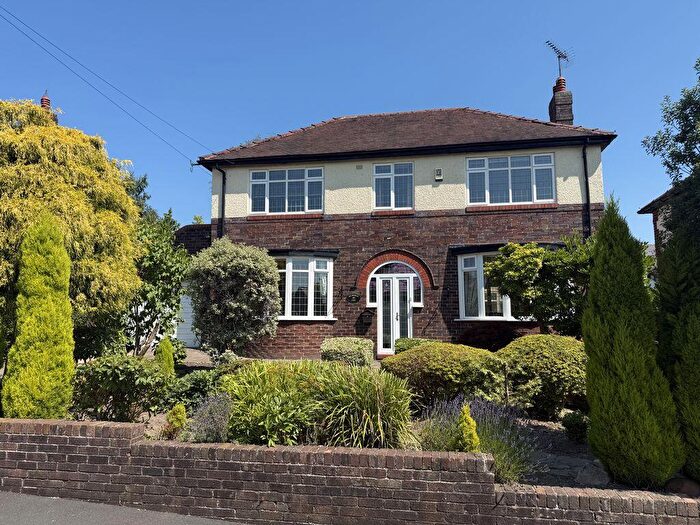
Properties for sale in Stockport
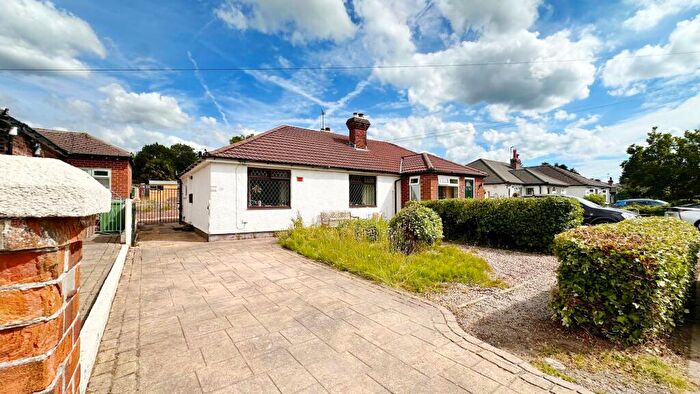
![]()
If you are looking to sell your house, let it out, or receive a property valuation, an expert can help you.
Click the button below to get started.
Neighbourhoods in Stockport
Navigate through our locations to find the location of your next house in Stockport, Cheshire for sale or to rent.
Property price trends in Stockport
According to the latest Land Registry data, the average home in Stockport sold for £502,114 in 2026. That figure comes from a substantial record of 10,421 sales logged over the past 31 years.
Prices have continued to climb over the last three years. Compared with 2023, when the typical sale came in around £428,240, that's a rise of roughly 17.3%.
Looking back five years, average prices are up about 30.4% since 2021, a gain of around £117,117 in cash terms.
Zoom out to the past decade for the fuller picture. Back in 2016, homes here averaged £286,808, so the typical sold price has climbed about 75.1% since then, roughly 5.8% a year. Stretch the view to fifteen years and that annual pace eases back to about 5%.
Frequently asked questions about Stockport
What is the average price for a property for sale in Stockport?
The average price for a property for sale in Stockport is £436,333. This amount is 36% higher than the average price in Cheshire. There are 7,639 property listings for sale in Stockport.
What locations have the most expensive properties for sale in Stockport?
The locations with the most expensive properties for sale in Stockport are Handforth at an average of £1,268,500 and Poynton East And Pott Shrigley at an average of £468,725.
What locations have the most affordable properties for sale in Stockport?
The locations with the most affordable properties for sale in Stockport are Disley at an average of £373,662 and Poynton West And Adlington at an average of £441,519.
Which train stations are available in or near Stockport?
Some of the train stations available in or near Stockport are Middlewood, Poynton and Disley.
Property Price Paid in Stockport by Year
The average sold property price by year was:
| Year | Average Sold Price | Price Change |
Sold Properties
|
|---|---|---|---|
| 2026 | £502,114 | 12% |
17 Properties |
| 2025 | £439,410 | 1% |
331 Properties |
| 2024 | £435,892 | 2% |
331 Properties |
| 2023 | £428,240 | 1% |
246 Properties |
| 2022 | £424,271 | 9% |
371 Properties |
| 2021 | £384,997 | 5% |
490 Properties |
| 2020 | £364,830 | 10% |
340 Properties |
| 2019 | £327,741 | - |
355 Properties |
| 2018 | £327,844 | 2% |
376 Properties |
| 2017 | £321,947 | 11% |
335 Properties |
Property Price per Property Type in Stockport
Here you can find historic sold price data in order to help with your property search.
The average Property Paid Price for specific property types in the last three years are:
| Property Type | Average Sold Price | Sold Properties |
|---|---|---|
| Semi Detached House | £400,566.00 | 328 Semi Detached Houses |
| Detached House | £586,571.00 | 348 Detached Houses |
| Terraced House | £315,348.00 | 148 Terraced Houses |
| Flat | £212,123.00 | 101 Flats |
Transport in Stockport
Please see below transportation links in this area:
