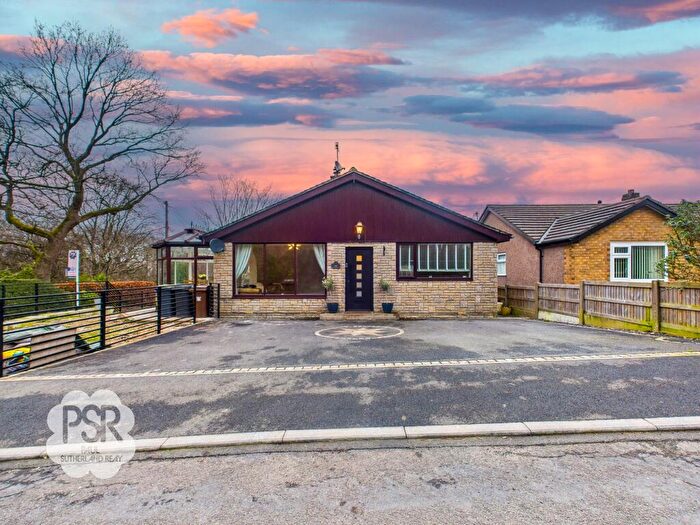
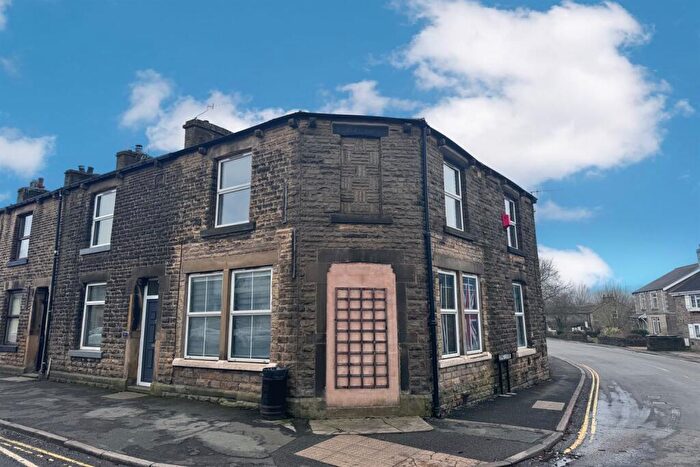
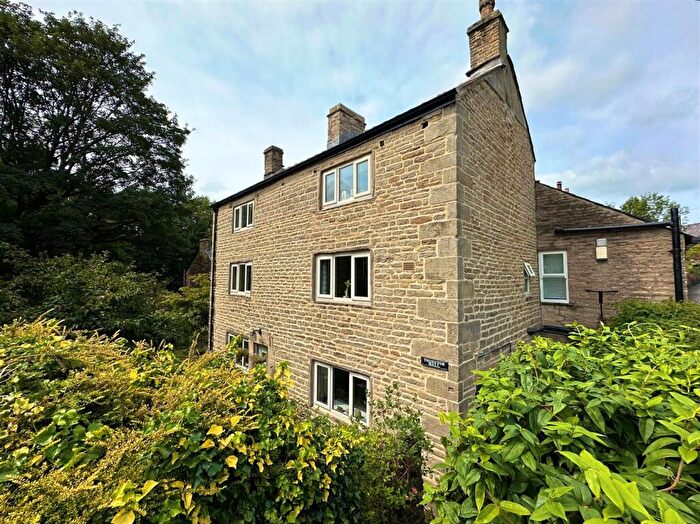
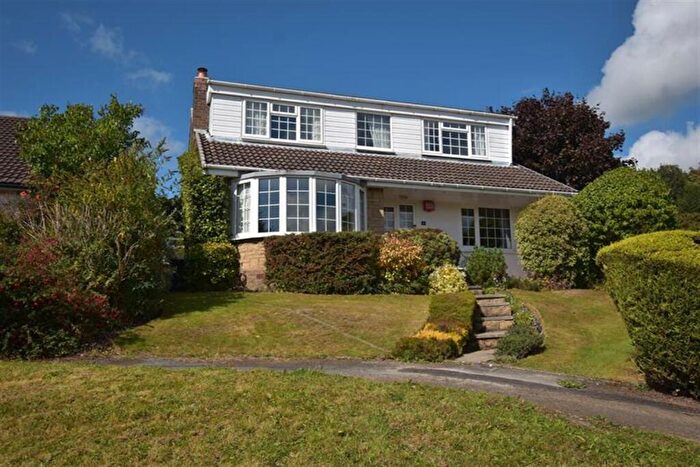
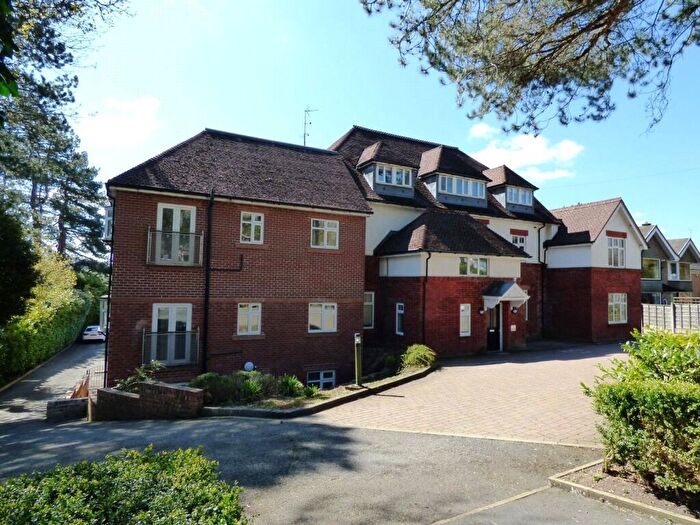
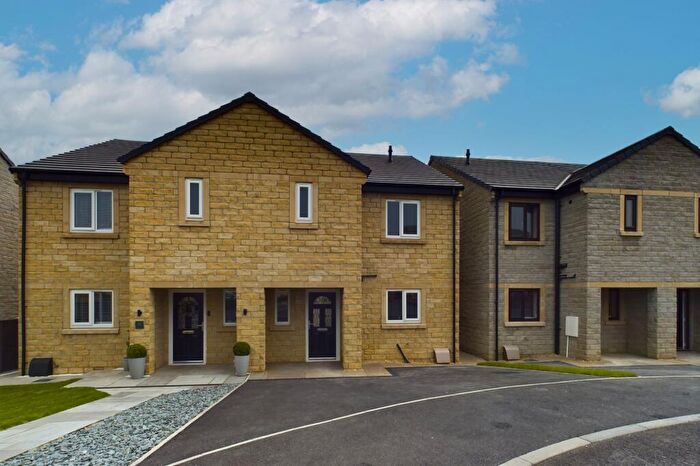
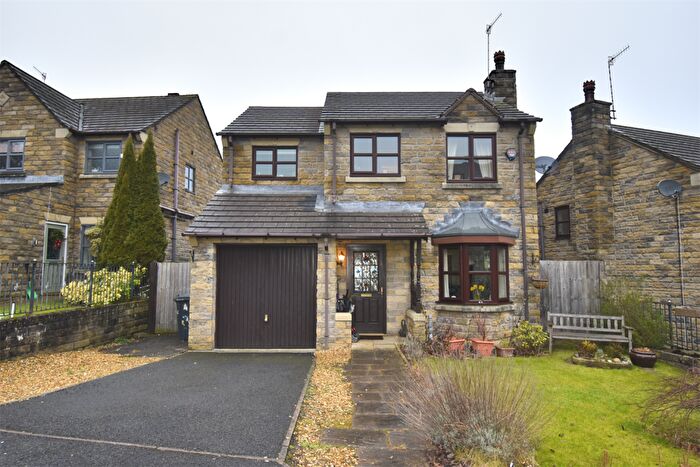
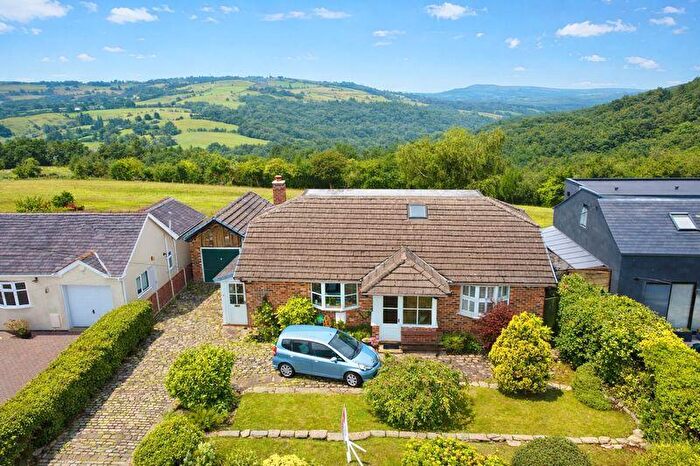
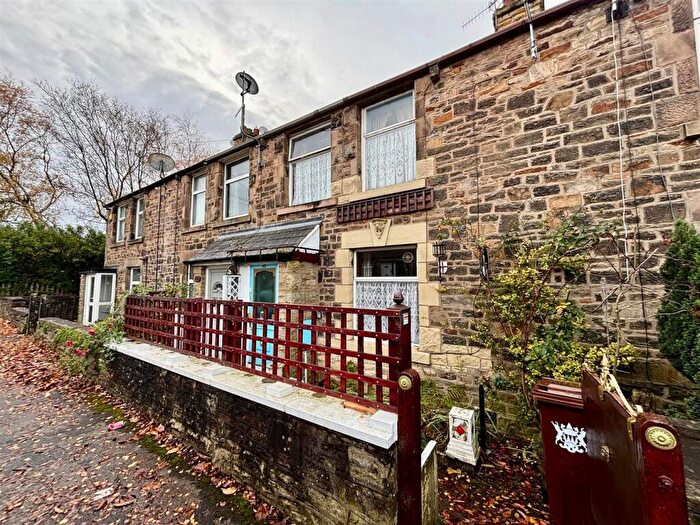
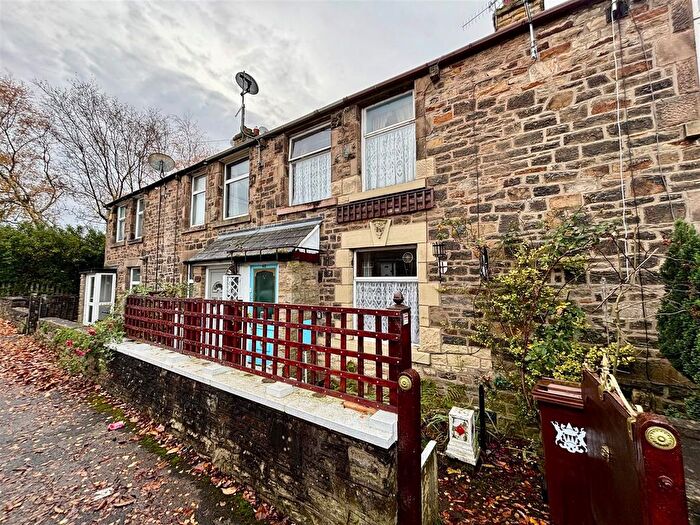
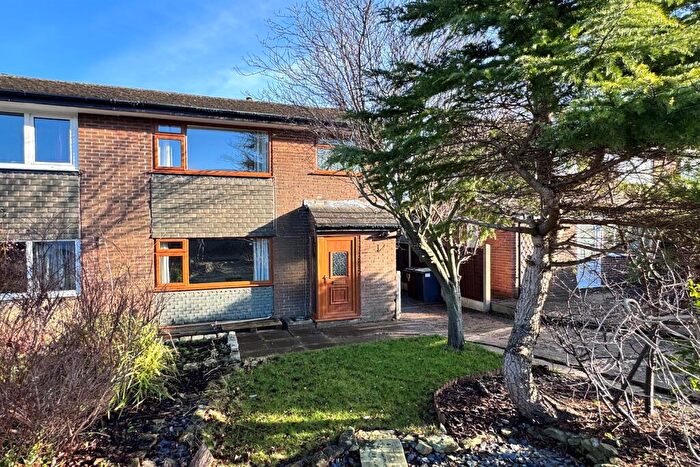
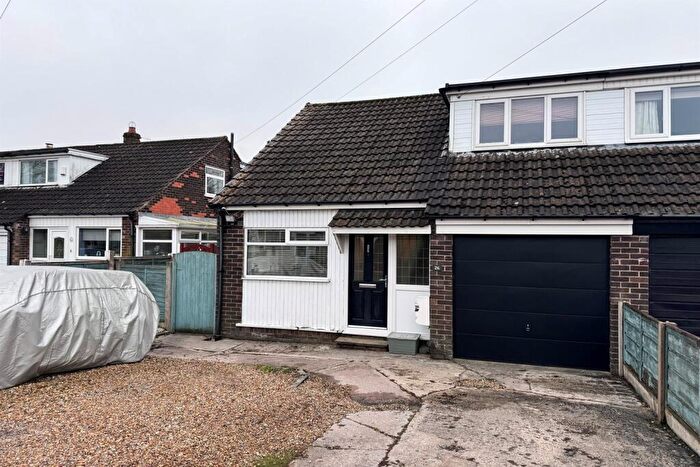
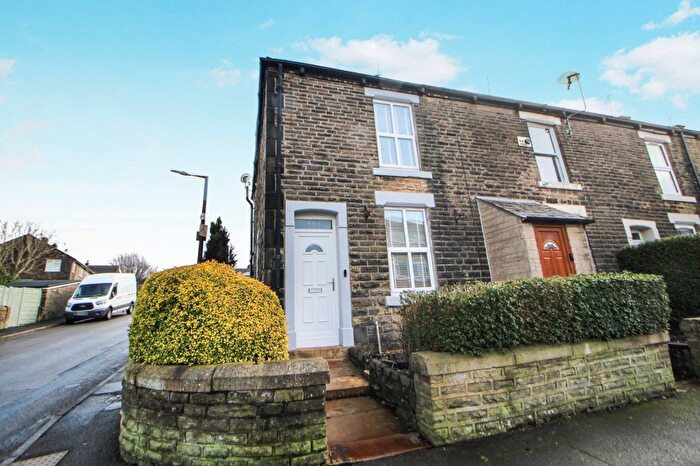
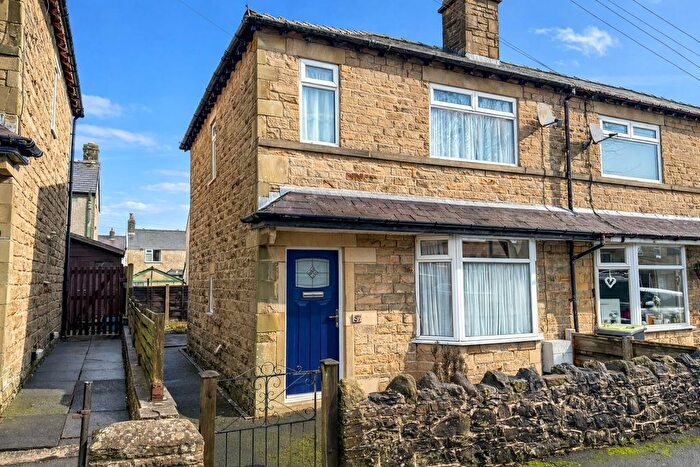
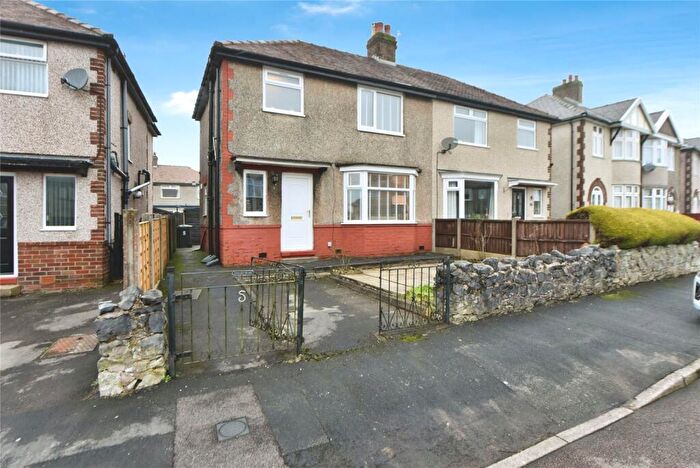
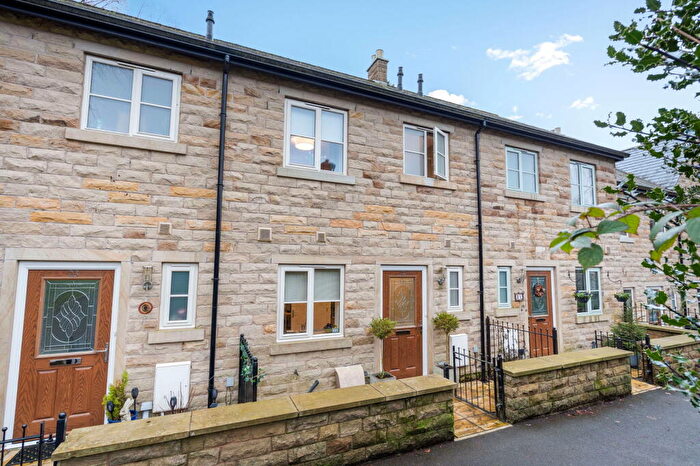
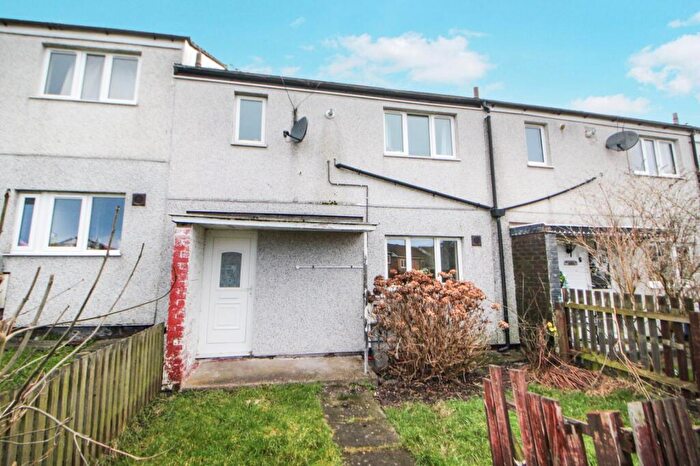
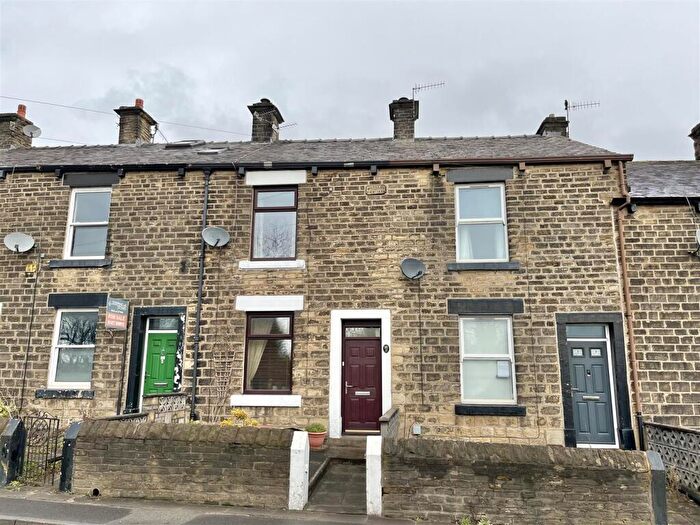
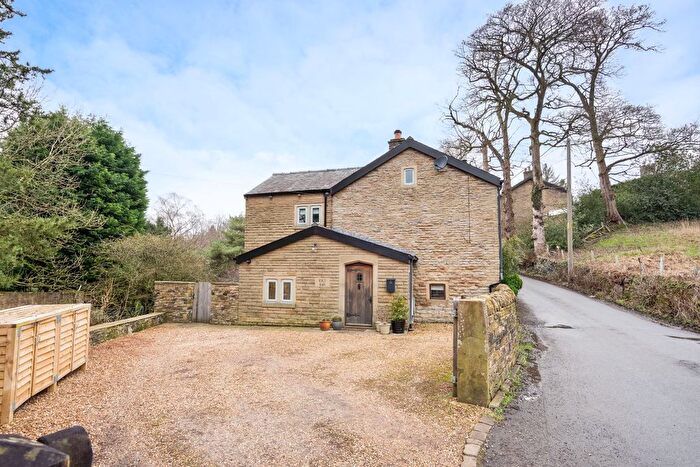
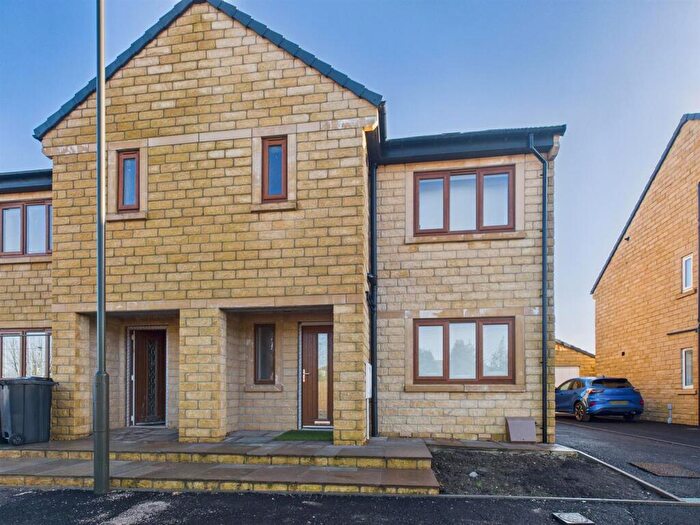
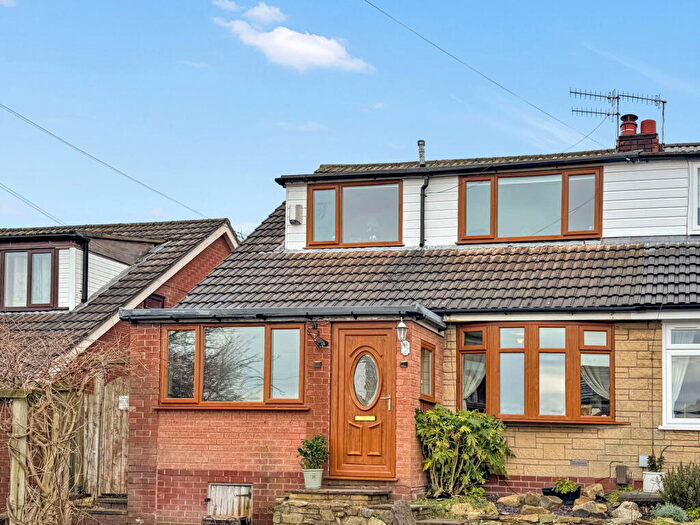
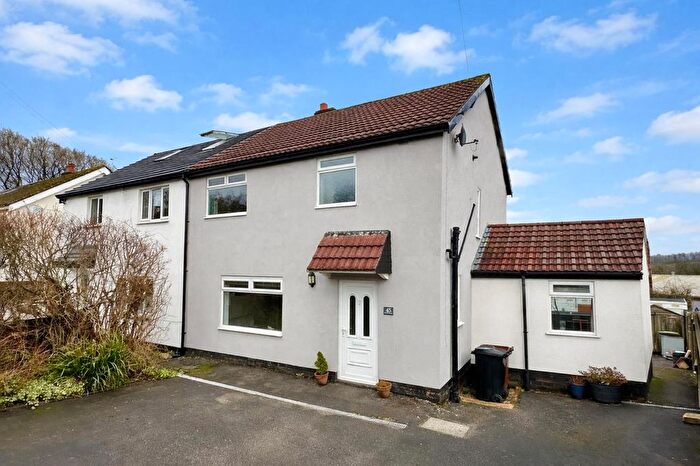
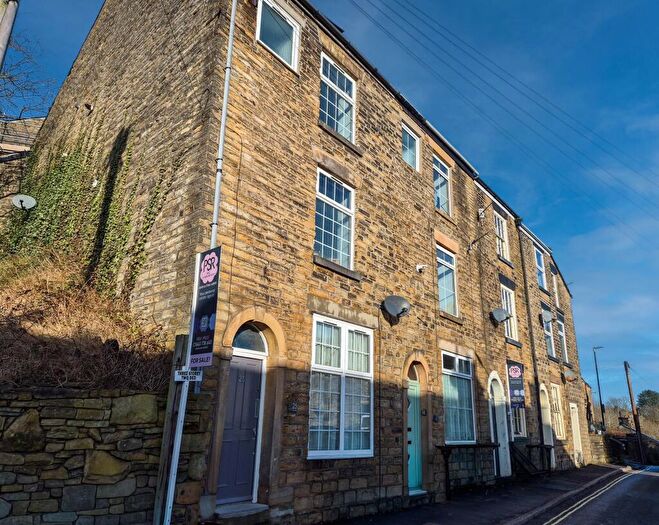
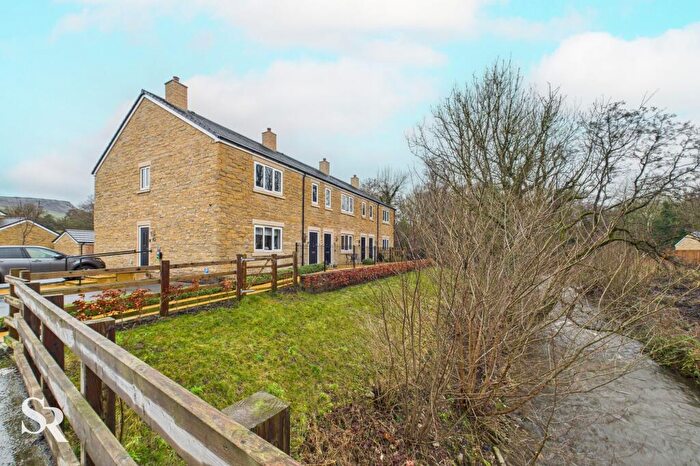
Houses for sale & to rent in High Peak, Derbyshire
House Prices in High Peak
Properties in High Peak have an average house price of £300,827.00 and had 1,209 Property Transactions within the last 3 years.¹
High Peak is an area in Derbyshire with 12,502 households², where the most expensive property was sold for £1,025,000.00.
Properties for sale in High Peak
Neighbourhoods in High Peak
Navigate through our locations to find the location of your next house in High Peak, Derbyshire for sale or to rent.
Transport in High Peak
Please see below transportation links in this area:
-
Chinley Station
-
Furness Vale Station
-
Whaley Bridge Station
-
New Mills Newtown Station
-
New Mills Central Station
- FAQ
- Price Paid By Year
- Property Type Price
Frequently asked questions about High Peak
What is the average price for a property for sale in High Peak?
The average price for a property for sale in High Peak is £300,827. This amount is 20% higher than the average price in Derbyshire. There are 8,649 property listings for sale in High Peak.
What locations have the most expensive properties for sale in High Peak?
The locations with the most expensive properties for sale in High Peak are Limestone Peak at an average of £735,000, Blackbrook at an average of £380,509 and Hayfield at an average of £317,675.
What locations have the most affordable properties for sale in High Peak?
The locations with the most affordable properties for sale in High Peak are Chapel East at an average of £250,816, New Mills East at an average of £252,650 and New Mills West at an average of £282,451.
Which train stations are available in or near High Peak?
Some of the train stations available in or near High Peak are Chinley, Furness Vale and Whaley Bridge.
Property Price Paid in High Peak by Year
The average sold property price by year was:
| Year | Average Sold Price | Price Change |
Sold Properties
|
|---|---|---|---|
| 2025 | £299,471 | 0,4% |
380 Properties |
| 2024 | £298,367 | -2% |
466 Properties |
| 2023 | £305,406 | 3% |
363 Properties |
| 2022 | £295,804 | 7% |
531 Properties |
| 2021 | £274,010 | 7% |
601 Properties |
| 2020 | £256,105 | 10% |
475 Properties |
| 2019 | £230,364 | -0,1% |
513 Properties |
| 2018 | £230,648 | 4% |
611 Properties |
| 2017 | £221,542 | 4% |
641 Properties |
| 2016 | £213,353 | 6% |
642 Properties |
| 2015 | £200,595 | 6% |
618 Properties |
| 2014 | £188,544 | 12% |
561 Properties |
| 2013 | £166,641 | -8% |
421 Properties |
| 2012 | £179,910 | 4% |
339 Properties |
| 2011 | £172,969 | -7% |
333 Properties |
| 2010 | £184,410 | 3% |
334 Properties |
| 2009 | £178,184 | -17% |
285 Properties |
| 2008 | £207,619 | 7% |
278 Properties |
| 2007 | £192,271 | 7% |
697 Properties |
| 2006 | £178,648 | 5% |
682 Properties |
| 2005 | £169,228 | 2% |
619 Properties |
| 2004 | £165,953 | 18% |
729 Properties |
| 2003 | £135,923 | 14% |
740 Properties |
| 2002 | £116,534 | 18% |
807 Properties |
| 2001 | £95,327 | 14% |
692 Properties |
| 2000 | £82,161 | 4% |
692 Properties |
| 1999 | £78,905 | 6% |
747 Properties |
| 1998 | £74,444 | 8% |
545 Properties |
| 1997 | £68,344 | 16% |
575 Properties |
| 1996 | £57,419 | -3% |
517 Properties |
| 1995 | £59,384 | - |
413 Properties |
Property Price per Property Type in High Peak
Here you can find historic sold price data in order to help with your property search.
The average Property Paid Price for specific property types in the last three years are:
| Property Type | Average Sold Price | Sold Properties |
|---|---|---|
| Semi Detached House | £286,040.00 | 376 Semi Detached Houses |
| Detached House | £469,938.00 | 285 Detached Houses |
| Terraced House | £235,023.00 | 464 Terraced Houses |
| Flat | £156,742.00 | 84 Flats |

