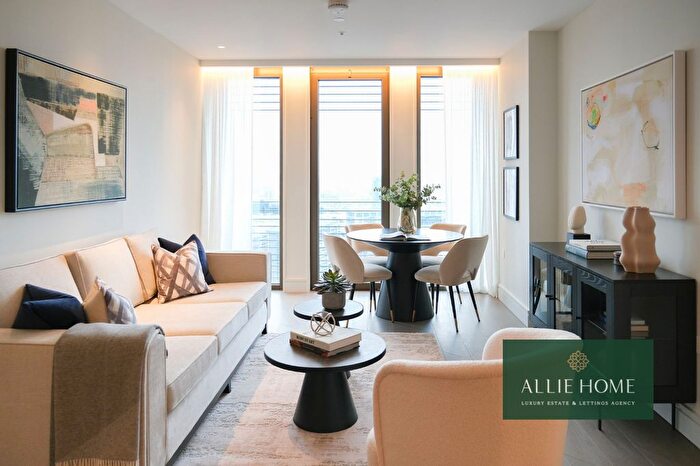
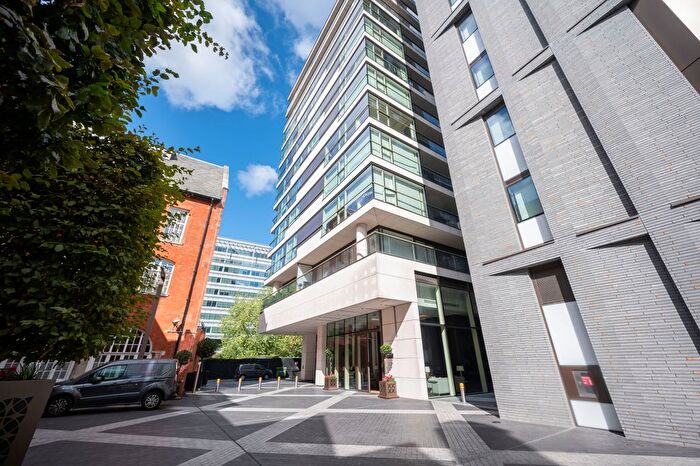
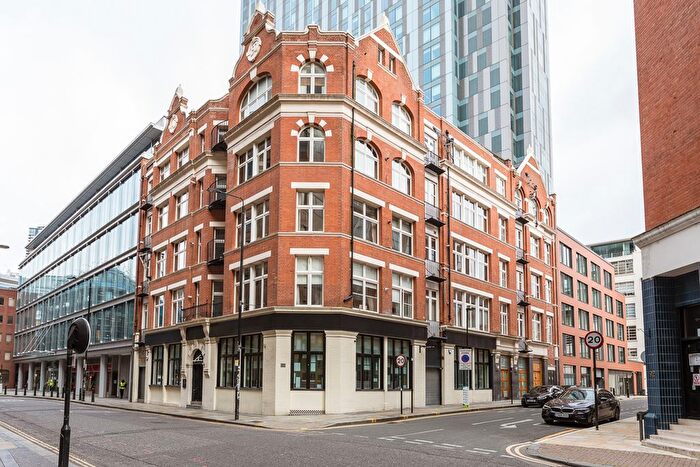
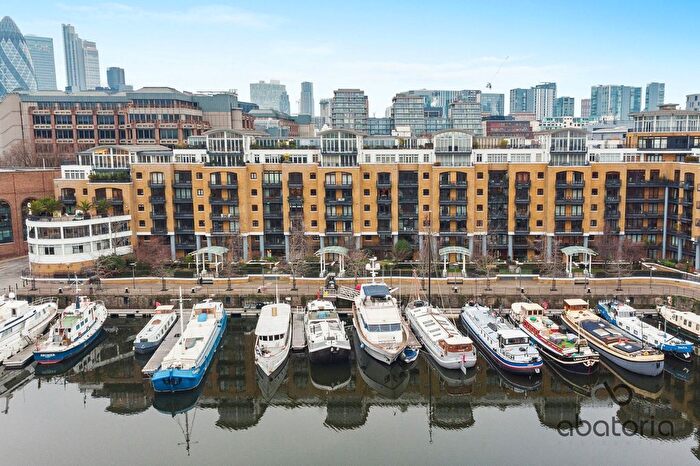
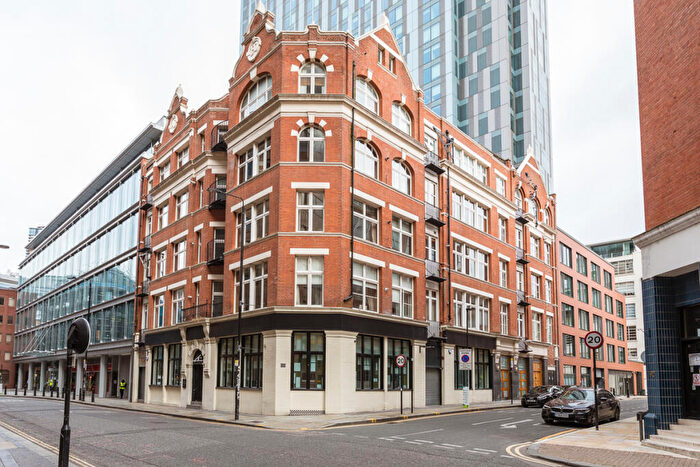
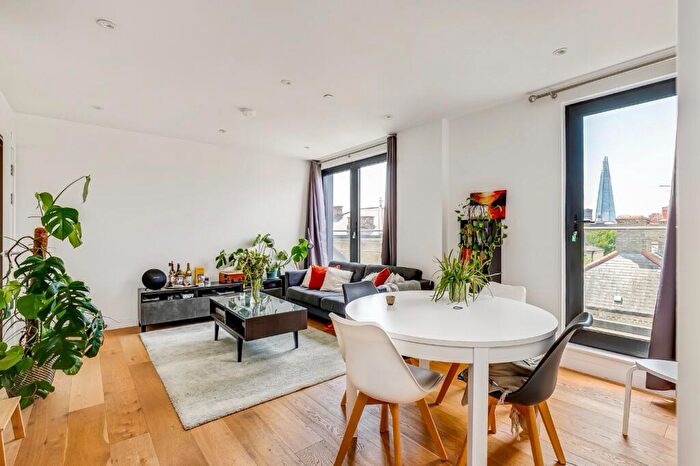
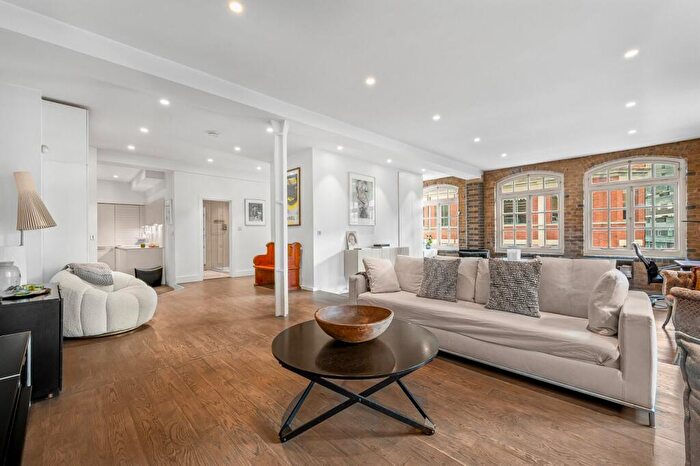
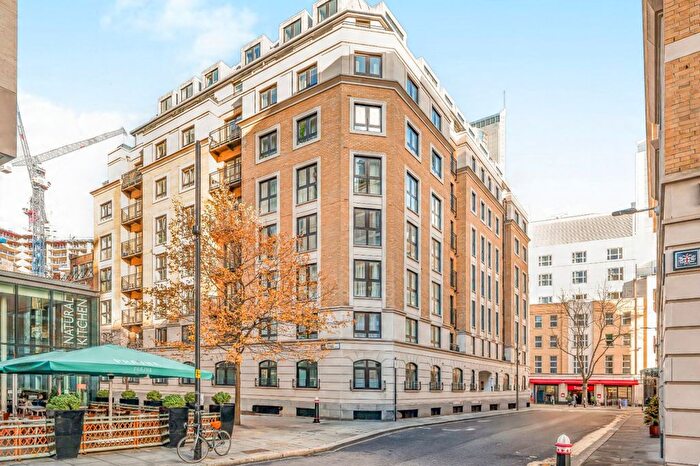
Houses for sale & to rent in Billingsgate, London
House Prices in Billingsgate
Properties in this part of Billingsgate within London have an average house price of £2,031,111.00 and had 9 Property Transactions within the last 3 years¹. This area has 11 households² , where the most expensive property was sold for £4,680,000.00.
Properties for sale in Billingsgate
Roads and Postcodes in Billingsgate
Navigate through our locations to find the location of your next house in Billingsgate, London for sale or to rent.
| Streets | Postcodes |
|---|---|
| Eastcheap | EC3M 1EB EC3M 1EU EC3M 1HD EC3M 1HS EC3M 1JA EC3M 1NP |
| Fenchurch Street | EC3M 3AD EC3M 3AJ EC3M 3BD EC3M 3BF EC3M 3BG EC3M 3BL |
| Great Tower Street | EC3R 5AA EC3R 5AD EC3R 5AZ EC3R 5DJ |
| Idol Lane | EC3R 5DD |
| Lovat Lane | EC3R 8EB |
| Lower Thames Street | EC3R 6AD EC3R 6AF EC3R 6DL EC3R 6EA EC3R 6EE EC3R 6EN EC3R 6YT |
| Mark Lane | EC3R 7AF EC3R 7AT |
| Mincing Lane | EC3R 7AG EC3R 7BD |
| Minster Court | EC3R 7AA EC3R 7BB EC3R 7PD |
| Minster Pavement | EC3R 7PP |
| Monument Street | EC3R 8BU |
| Old Billingsgate Walk | EC3R 6DX |
| Rood Lane | EC3M 8AZ |
| St Dunstan's Hill | EC3R 8AD EC3R 8AG EC3R 8HL |
| St Mary At Hill | EC3R 8DU EC3R 8EE EC3R 8DY EC3R 8EF |
| Sugar Quay Walk | EC3R 6AN |
| Water Lane | EC3R 6AL EC3R 6AP |
Transport near Billingsgate
-
Monument Station
-
Fenchurch Street Station
-
Tower Hill Station
-
Cannon Street Station
-
Tower Gateway Station
-
Bank Station
-
London Bridge Station
-
Aldgate Station
-
Mansion House Station
-
Liverpool Street Station
- FAQ
- Price Paid By Year
- Property Type Price
Frequently asked questions about Billingsgate
What is the average price for a property for sale in Billingsgate?
The average price for a property for sale in Billingsgate is £2,031,111. This amount is 101% higher than the average price in London. There are 5,683 property listings for sale in Billingsgate.
What streets have the most expensive properties for sale in Billingsgate?
The street with the most expensive properties for sale in Billingsgate is Water Lane at an average of £2,210,000.
What streets have the most affordable properties for sale in Billingsgate?
The street with the most affordable properties for sale in Billingsgate is Lovat Lane at an average of £600,000.
Which train stations are available in or near Billingsgate?
Some of the train stations available in or near Billingsgate are Fenchurch Street, Cannon Street and London Bridge.
Which tube stations are available in or near Billingsgate?
Some of the tube stations available in or near Billingsgate are Monument, Tower Hill and Cannon Street.
Property Price Paid in Billingsgate by Year
The average sold property price by year was:
| Year | Average Sold Price | Price Change |
Sold Properties
|
|---|---|---|---|
| 2024 | £975,000 | 21% |
3 Properties |
| 2023 | £772,500 | -347% |
2 Properties |
| 2022 | £3,452,500 | -30% |
4 Properties |
| 2020 | £4,483,333 | 48% |
3 Properties |
| 2019 | £2,332,419 | 28% |
33 Properties |
| 2018 | £1,668,140 | 20% |
129 Properties |
| 2017 | £1,340,000 | 30% |
1 Property |
| 2015 | £941,657 | 15% |
14 Properties |
| 2014 | £799,291 | 2% |
6 Properties |
| 2012 | £781,251 | 75% |
1 Property |
| 2002 | £198,125 | 48% |
8 Properties |
| 2001 | £104,000 | - |
1 Property |
Property Price per Property Type in Billingsgate
Here you can find historic sold price data in order to help with your property search.
The average Property Paid Price for specific property types in the last three years are:
| Property Type | Average Sold Price | Sold Properties |
|---|---|---|
| Flat | £2,031,111.00 | 9 Flats |


