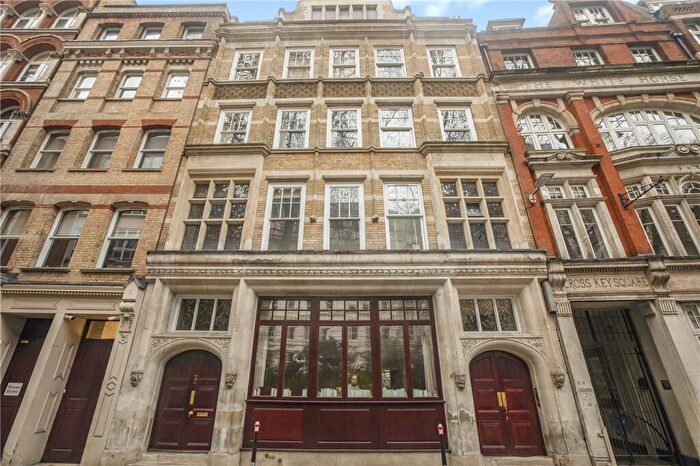
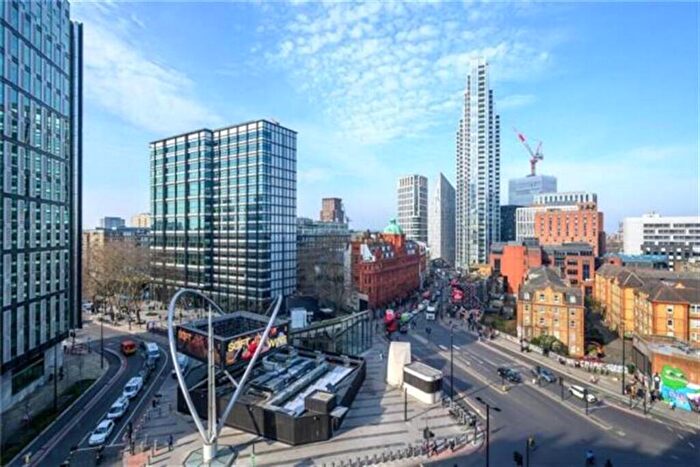
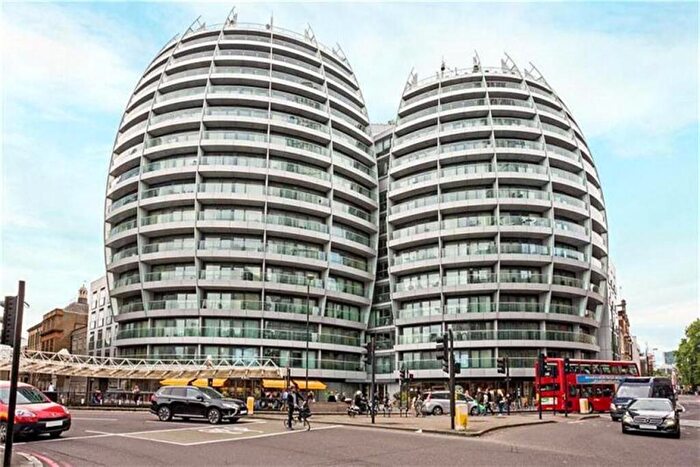
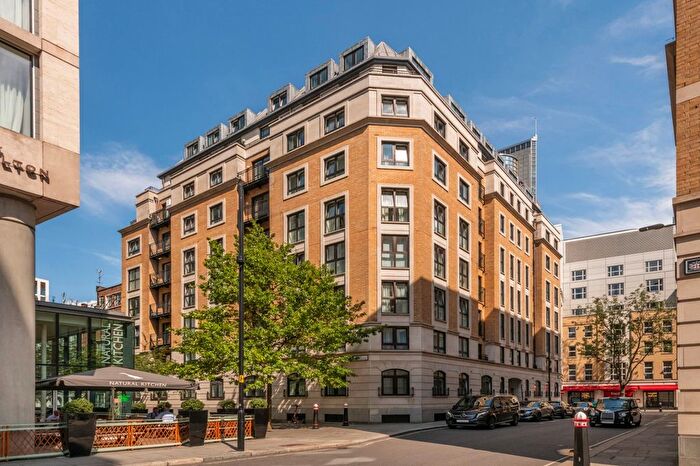
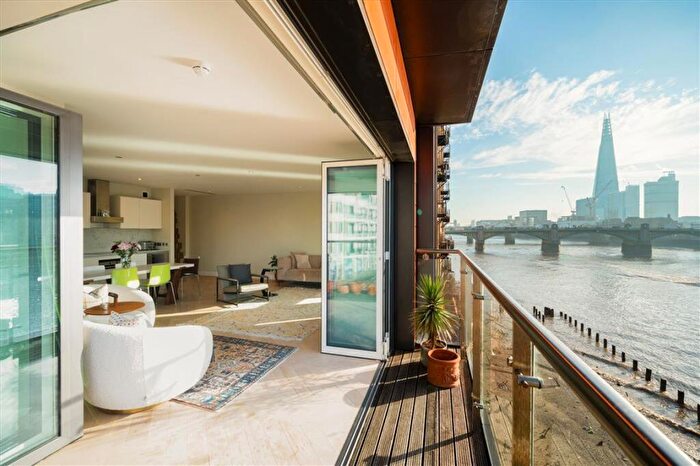
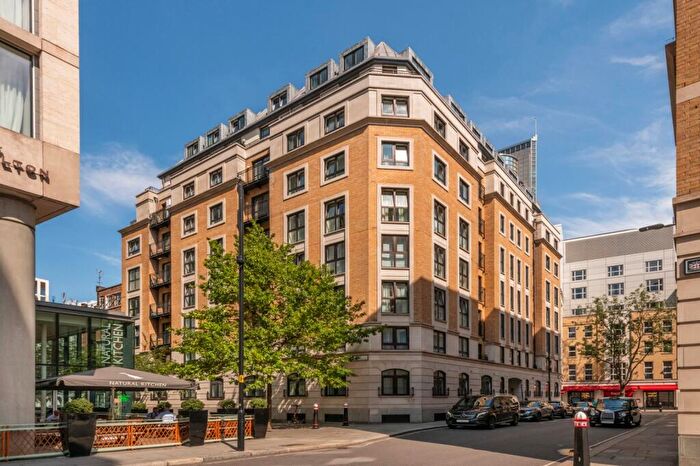
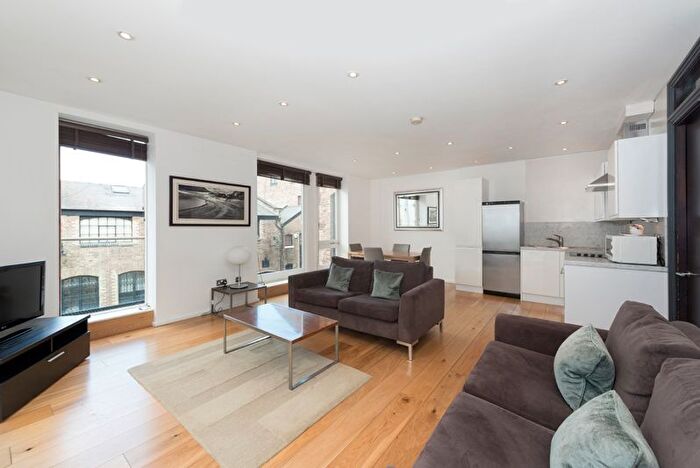
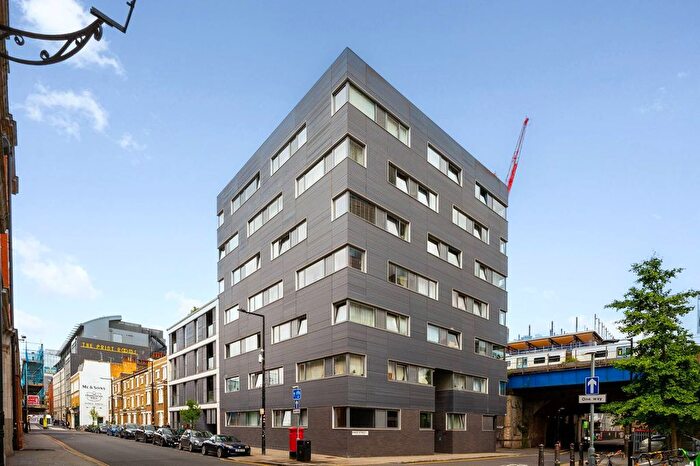
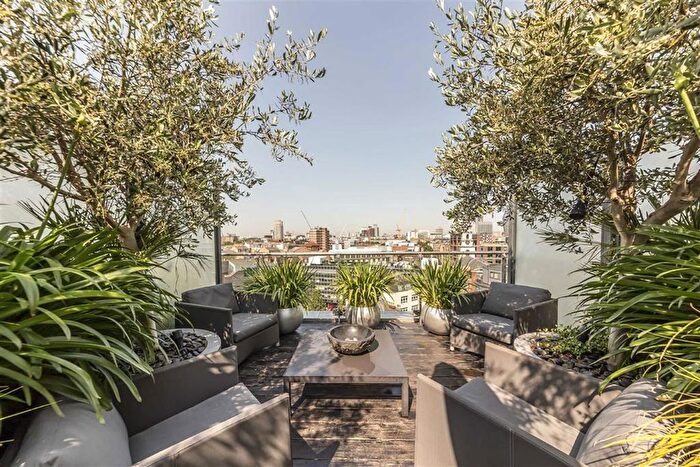
Houses for sale & to rent in Candlewick, London
House Prices in Candlewick
Properties in this part of Candlewick within London have no sales history available within the last 3 years. This area has 14 households² , where the most expensive property was sold for £0.00.
Properties for sale in Candlewick
Roads and Postcodes in Candlewick
Navigate through our locations to find the location of your next house in Candlewick, London for sale or to rent.
| Streets | Postcodes |
|---|---|
| Abchurch Lane | EC4N 7BW |
| Abchurch Yard | EC4N 7BA |
| Arthur Street | EC4R 9AY |
| Cannon Street | EC4N 5AT EC4N 5AJ EC4N 5AU EC4N 5AW EC4N 5AX EC4N 6AS |
| Clements Lane | EC4N 7AE |
| Gracechurch Street | EC3V 0BT |
| King William Street | EC4N 7AA EC4N 7AF EC4N 7AR EC4N 7BE EC4N 7BG EC4N 7BJ EC4N 7BL EC4N 7BP EC4N 7DA EC4N 7DT EC4N 7DZ EC4N 7HR EC4N 7TW EC4R 9AA EC4R 9AD EC4R 9AF EC4R 9AT |
| Lombard Court | EC3V 9BJ |
| Lombard Street | EC3V 9AH EC3V 9AJ EC3V 9AN EC3V 9BQ EC3V 9BS EC3V 9AD |
| Martin Lane | EC4R 0DR EC4R 0DJ EC4R 0DP |
| Monument Street | EC3R 8BG |
| St Clement's Court | EC4N 7HB |
| St Swithins Lane | EC4N 8AD |
Transport near Candlewick
-
Monument Station
-
Cannon Street Station
-
Bank Station
-
Mansion House Station
-
Fenchurch Street Station
-
London Bridge Station
-
Tower Hill Station
-
Liverpool Street Station
-
Moorgate Station
-
St. Pauls Station
- FAQ
- Price Paid By Year
Frequently asked questions about Candlewick
Which train stations are available in or near Candlewick?
Some of the train stations available in or near Candlewick are Cannon Street, Fenchurch Street and London Bridge.
Which tube stations are available in or near Candlewick?
Some of the tube stations available in or near Candlewick are Monument, Cannon Street and Bank.
Property Price Paid in Candlewick by Year
The average sold property price by year was:
| Year | Average Sold Price | Price Change |
Sold Properties
|
|---|---|---|---|
| 2020 | £1,300,000 | 38% |
1 Property |
| 2019 | £800,000 | -661% |
1 Property |
| 2017 | £6,084,000 | 81% |
2 Properties |
| 2014 | £1,150,000 | 33% |
1 Property |
| 2012 | £775,000 | -9% |
1 Property |
| 2011 | £846,500 | -129% |
2 Properties |
| 2010 | £1,940,000 | 73% |
1 Property |
| 2007 | £522,282 | 2% |
2 Properties |
| 2006 | £511,500 | -34% |
4 Properties |
| 2005 | £684,375 | -39% |
4 Properties |
| 2003 | £952,000 | 76% |
1 Property |
| 1996 | £225,000 | - |
1 Property |


