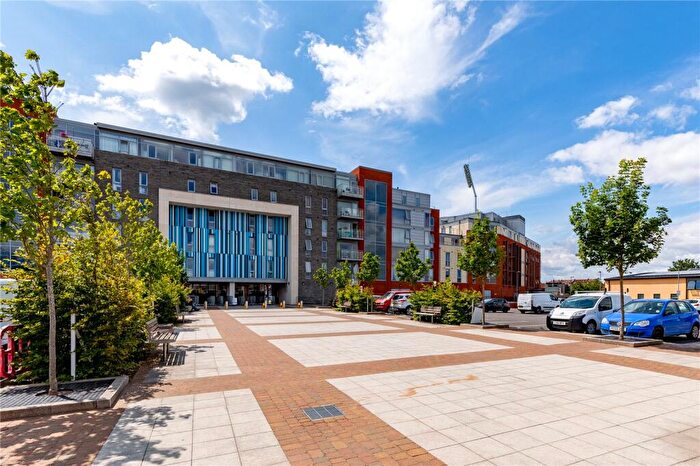
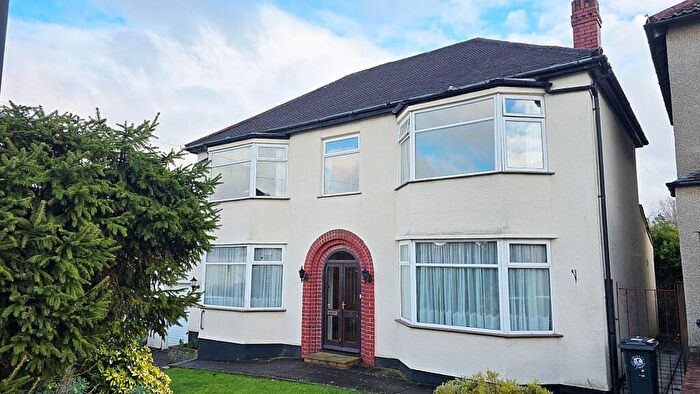
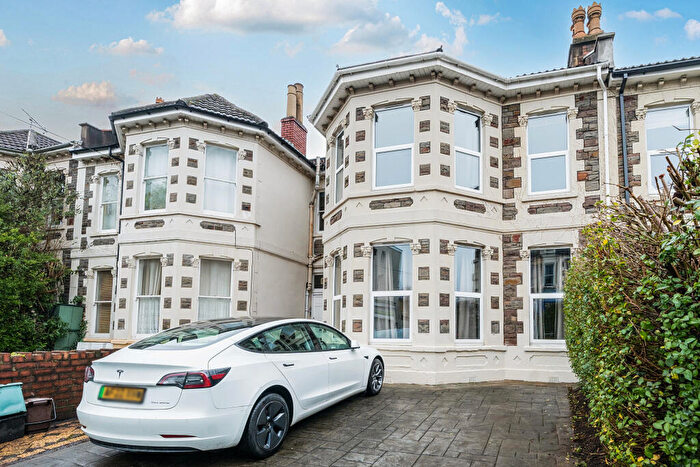
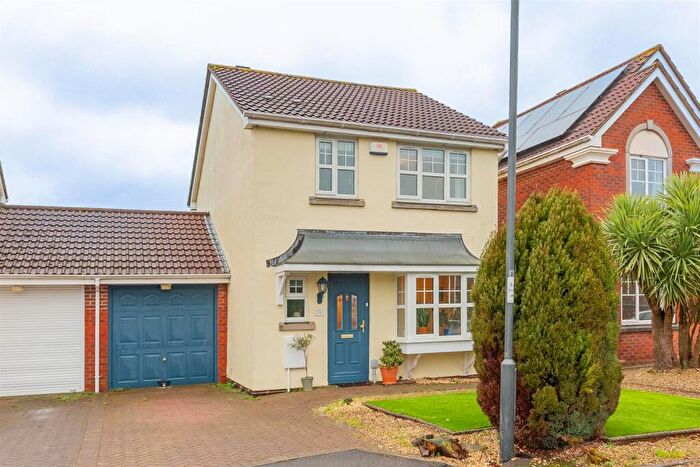
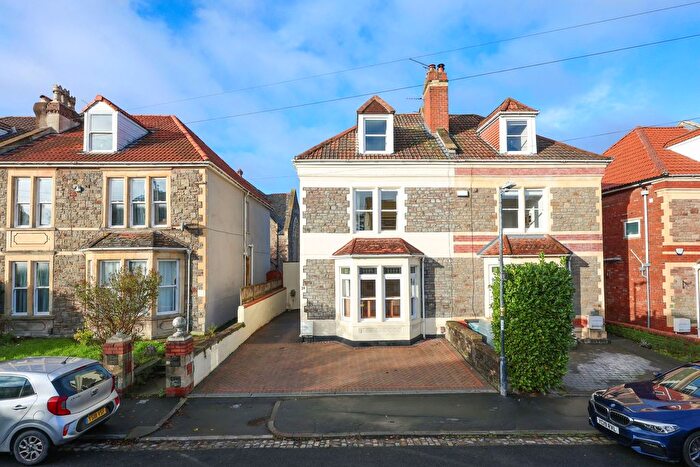
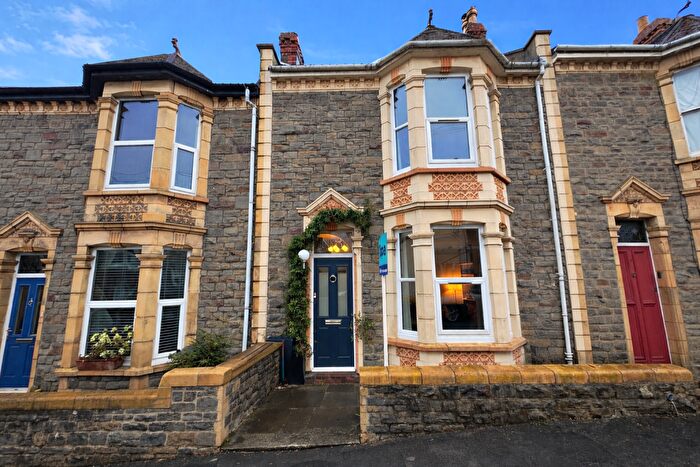
Houses for sale & to rent in Bishopston and Ashley Down, Bristol
House Prices in Bishopston and Ashley Down
Properties in Bishopston and Ashley Down have an average house price of £389,222.00 and had 18 Property Transactions within the last 3 years¹.
Bishopston and Ashley Down is an area in Bristol, City of Bristol with 28 households², where the most expensive property was sold for £585,000.00.
Properties for sale in Bishopston and Ashley Down
Roads and Postcodes in Bishopston and Ashley Down
Navigate through our locations to find the location of your next house in Bishopston and Ashley Down, Bristol for sale or to rent.
| Streets | Postcodes |
|---|---|
| Ashley Down Road | BS7 9BU BS7 9EF |
| Beloe Mews | BS7 8AN |
| Cambridge Road | BS7 8PS |
| College Road | BS7 9FH BS7 9GA BS7 9FG |
| Filton Avenue | BS7 0BF |
| Gloucester Road | BS7 8PF BS7 8PG BS7 8TW |
| Kellaway Avenue | BS7 8SU |
| Merton Road | BS7 8TL |
| Nevil Road | BS7 9EJ BS7 9NY |
| Princes Place | BS7 8NS |
| Seymour Road | BS7 9FE |
| Wellington Hill | BS7 8ST |
| Wesley Road | BS7 8AG |
Transport near Bishopston and Ashley Down
-
Montpelier Station
-
Redland Station
-
Stapleton Road Station
-
Clifton Down Station
-
Lawrence Hill Station
-
Filton Abbey Wood Station
-
Bristol Temple Meads Station
-
Sea Mills Station
-
Bedminster Station
-
Bristol Parkway Station
- FAQ
- Price Paid By Year
- Property Type Price
Frequently asked questions about Bishopston and Ashley Down
What is the average price for a property for sale in Bishopston and Ashley Down?
The average price for a property for sale in Bishopston and Ashley Down is £389,222. This amount is 0.12% lower than the average price in Bristol. There are 1,698 property listings for sale in Bishopston and Ashley Down.
What streets have the most expensive properties for sale in Bishopston and Ashley Down?
The street with the most expensive properties for sale in Bishopston and Ashley Down is Seymour Road at an average of £585,000.
What streets have the most affordable properties for sale in Bishopston and Ashley Down?
The street with the most affordable properties for sale in Bishopston and Ashley Down is COLLEGE ROAD at an average of £353,327.
Which train stations are available in or near Bishopston and Ashley Down?
Some of the train stations available in or near Bishopston and Ashley Down are Montpelier, Redland and Stapleton Road.
Property Price Paid in Bishopston and Ashley Down by Year
The average sold property price by year was:
| Year | Average Sold Price | Price Change |
Sold Properties
|
|---|---|---|---|
| 2025 | £380,500 | -5% |
5 Properties |
| 2024 | £401,000 | 3% |
5 Properties |
| 2023 | £387,312 | 18% |
8 Properties |
| 2022 | £317,089 | -6% |
13 Properties |
| 2021 | £335,660 | 20% |
10 Properties |
| 2020 | £268,625 | -23% |
4 Properties |
| 2019 | £330,410 | 6% |
38 Properties |
| 2018 | £310,573 | -54% |
19 Properties |
| 2017 | £477,500 | 27% |
1 Property |
| 2015 | £348,650 | -43% |
4 Properties |
| 2006 | £500,000 | -20% |
1 Property |
| 2005 | £600,000 | - |
1 Property |
Property Price per Property Type in Bishopston and Ashley Down
Here you can find historic sold price data in order to help with your property search.
The average Property Paid Price for specific property types in the last three years are:
| Property Type | Average Sold Price | Sold Properties |
|---|---|---|
| Flat | £377,705.00 | 17 Flats |
| Detached House | £585,000.00 | 1 Detached House |

