
Houses for sale & to rent in Bristol, City of Bristol
House Prices in Bristol
Properties in Bristol have an average house price of £391k and had 18,224 Property Transactions within the last 3 years.¹
Bristol is an area in City of Bristol with 182,787 households², where the most expensive property was sold for £7.4M.
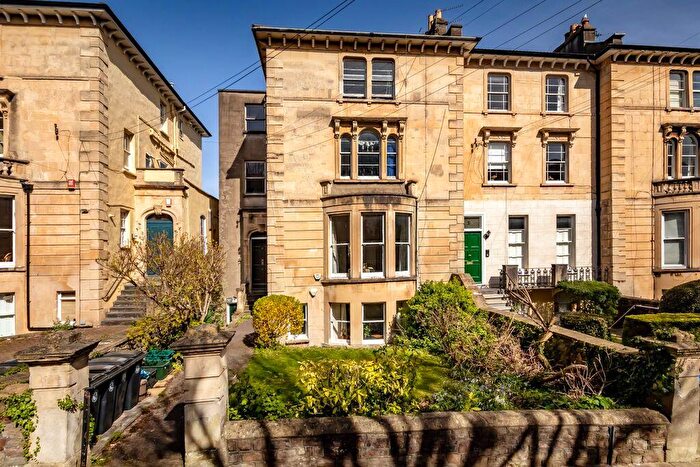
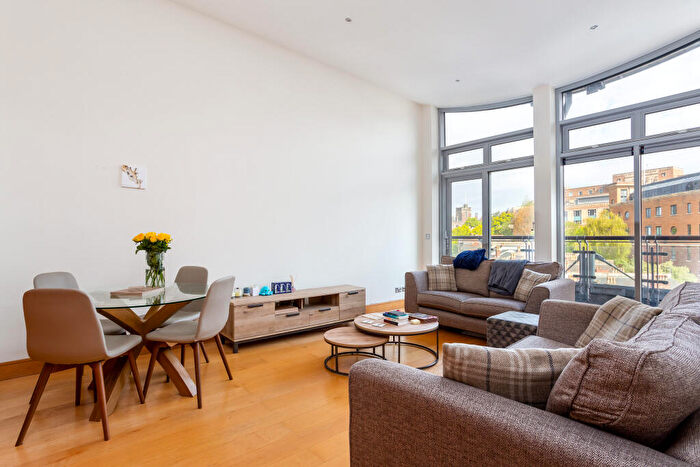
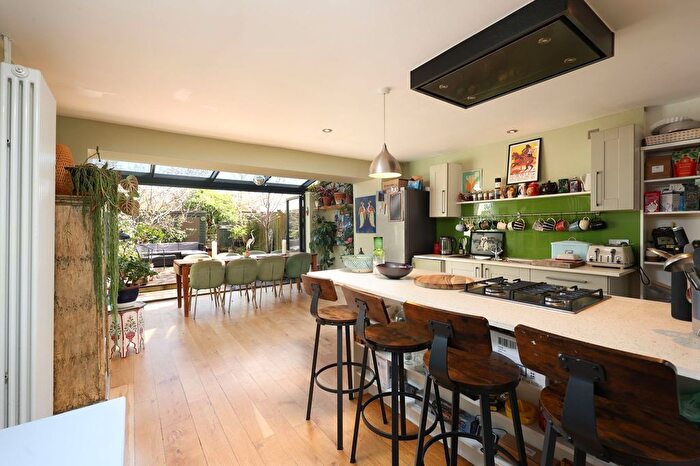
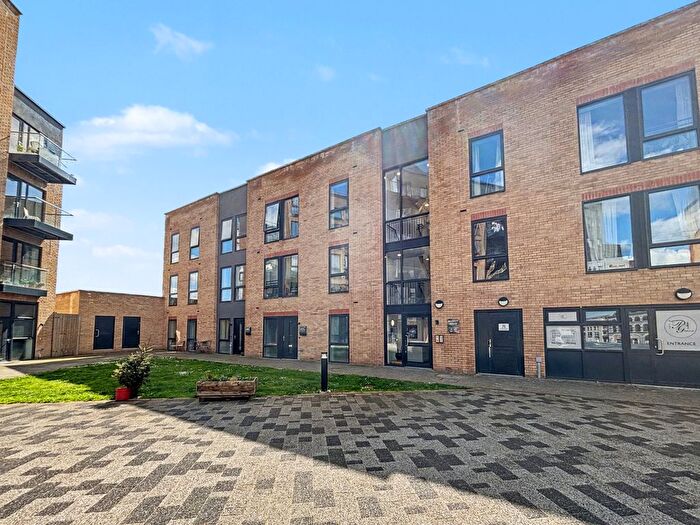
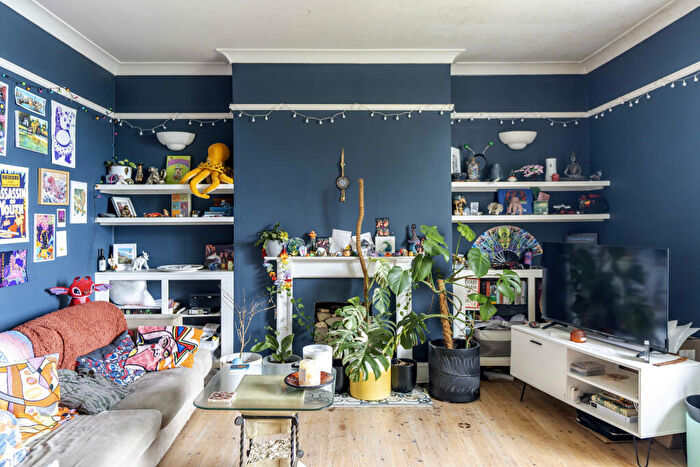
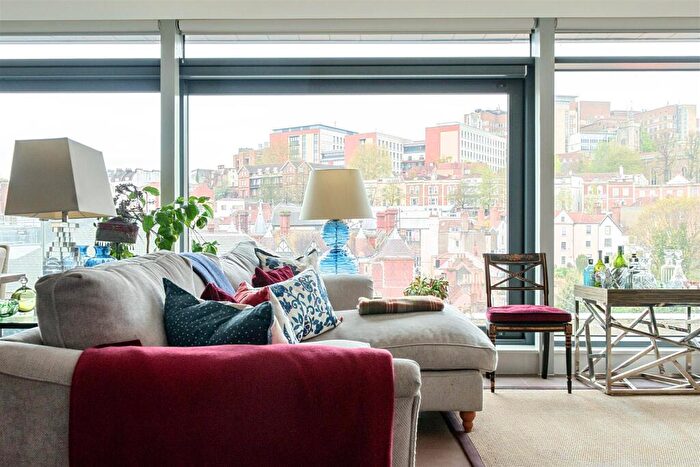
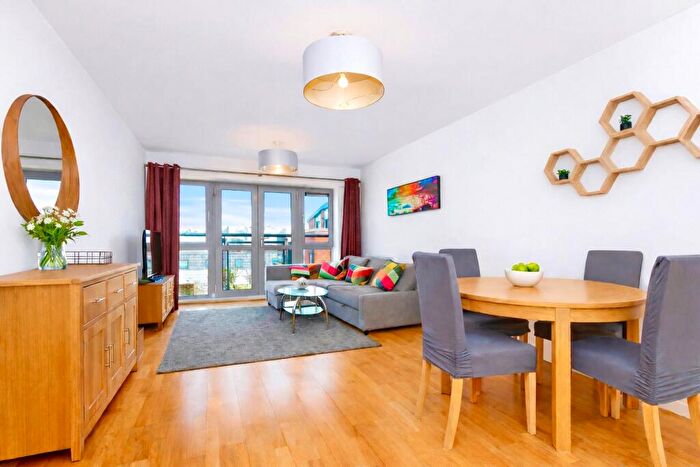
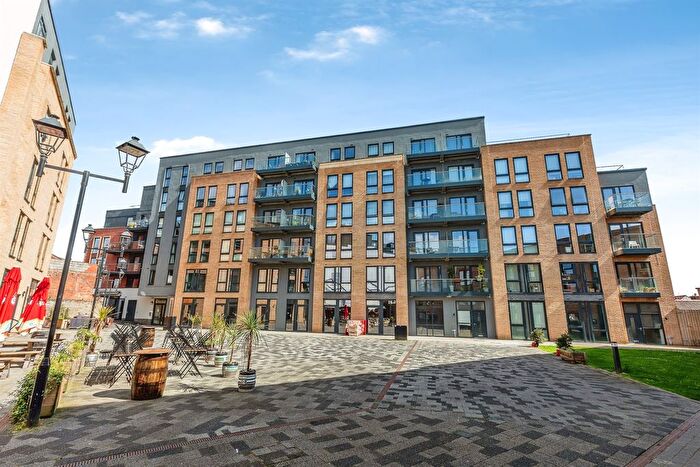
Properties for sale in Bristol
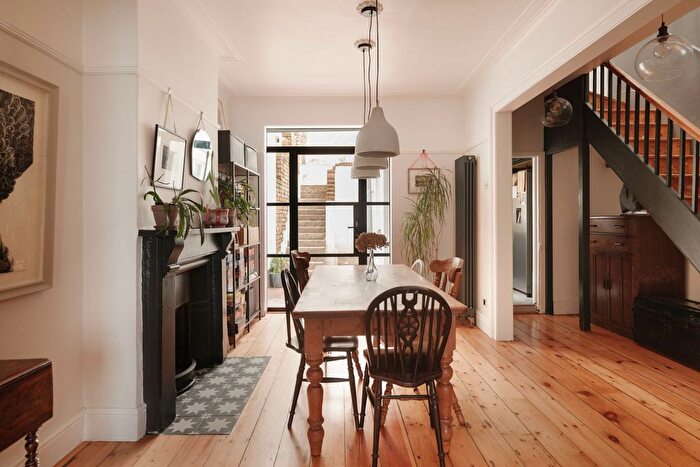
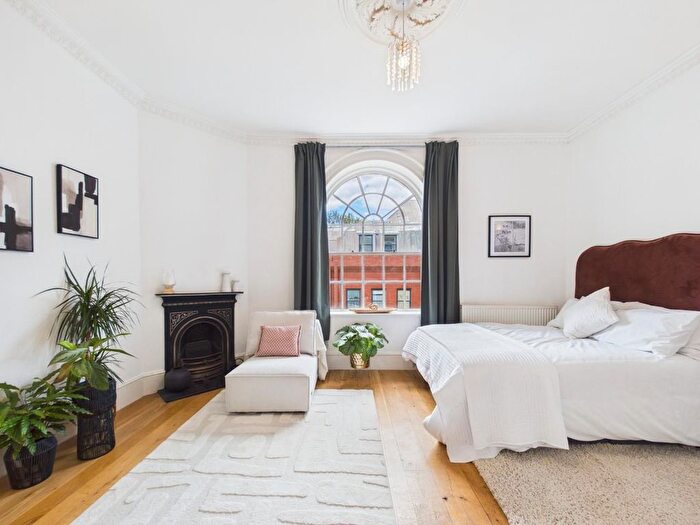

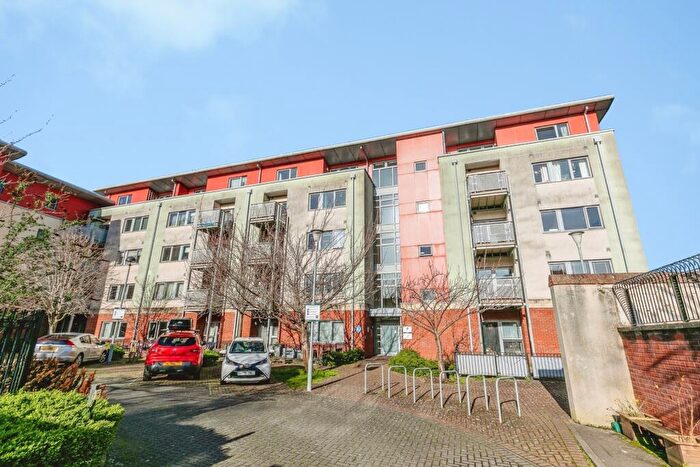

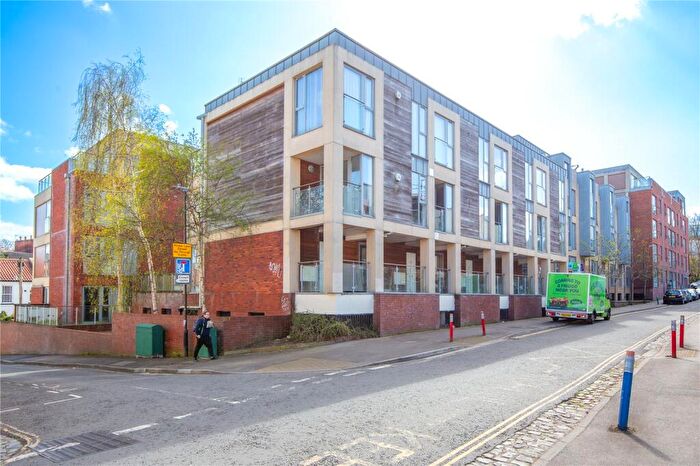
![]()
If you are looking to sell your house, let it out, or receive a property valuation, an expert can help you.
Click the button below to get started.


Neighbourhoods in Bristol
Navigate through our locations to find the location of your next house in Bristol, City of Bristol for sale or to rent.
- Ashley
- Avonmouth
- Bedminster
- Bishopston
- Bishopsworth
- Brislington East
- Brislington West
- Cabot
- Clifton
- Clifton East
- Cotham
- Easton
- Eastville
- Filwood
- Frome Vale
- Hartcliffe
- Henbury
- Hengrove
- Henleaze
- Hillfields
- Horfield
- Kingsweston
- Knowle
- Lawrence Hill
- Lockleaze
- Redland
- Southmead
- Southville
- St George East
- St George West
- Stockwood
- Stoke Bishop
- Westbury-on-trym
- Whitchurch Park
- Windmill Hill
- Hotwells and Harbourside
- Westbury-on-Trym and Henleaze
- Henbury and Brentry
- Avonmouth and Lawrence Weston
- Hartcliffe and Withywood
- Hengrove and Whitchurch Park
- St George Central
- Clifton Down
- St George Troopers Hill
- Bishopston and Ashley Down
- Central
- Long Ashton
- Stoke Park & Cheswick
Transport in Bristol
Please see below transportation links in this area:
-
 Montpelier Station
 -
Redland Station
-
Bristol Temple Meads Station
-
Clifton Down Station
-
Lawrence Hill Station
-
Stapleton Road Station
-
Bedminster Station
-
Parson Street Station
-
Sea Mills Station
- FAQ
- Price Paid By Year
- Property Type Price
Frequently asked questions about Bristol
What is the average price for a property for sale in Bristol?
The average price for a property for sale in Bristol is £390,788. There are more than 10,000 property listings for sale in Bristol.
What locations have the most expensive properties for sale in Bristol?
The locations with the most expensive properties for sale in Bristol are Hotwells and Harbourside at an average of £778,833, Stoke Bishop at an average of £750,999 and Henleaze at an average of £677,144.
What locations have the most affordable properties for sale in Bristol?
The locations with the most affordable properties for sale in Bristol are Hartcliffe and Withywood at an average of £172,916, St George Central at an average of £228,288 and Avonmouth and Lawrence Weston at an average of £233,692.
Which train stations are available in or near Bristol?
Some of the train stations available in or near Bristol are Montpelier, Redland and Bristol Temple Meads.
Property Price Paid in Bristol by Year
The average sold property price by year was:
| Year | Average Sold Price | Price Change |
Sold Properties
|
|---|---|---|---|
| 2026 | £408,504 | 2% |
152 Properties |
| 2025 | £398,475 | 2% |
5,650 Properties |
| 2024 | £390,440 | 2% |
6,335 Properties |
| 2023 | £383,574 | -2% |
6,087 Properties |
| 2022 | £392,961 | 8% |
7,049 Properties |
| 2021 | £359,975 | 6% |
8,775 Properties |
| 2020 | £339,611 | 8% |
6,036 Properties |
| 2019 | £312,471 | 1% |
7,273 Properties |
| 2018 | £308,361 | 4% |
7,807 Properties |
| 2017 | £297,029 | 5% |
8,269 Properties |
| 2016 | £281,716 | 11% |
8,171 Properties |
| 2015 | £251,810 | 8% |
8,402 Properties |
| 2014 | £232,467 | 6% |
8,531 Properties |
| 2013 | £217,367 | 3% |
6,986 Properties |
| 2012 | £211,329 | 2% |
5,949 Properties |
| 2011 | £206,244 | -2% |
5,783 Properties |
| 2010 | £209,818 | 9% |
5,763 Properties |
| 2009 | £191,254 | -4% |
5,917 Properties |
| 2008 | £198,133 | -5% |
5,679 Properties |
| 2007 | £208,659 | 9% |
10,208 Properties |
| 2006 | £190,576 | 7% |
11,194 Properties |
| 2005 | £176,313 | 3% |
8,992 Properties |
| 2004 | £171,261 | 8% |
9,532 Properties |
| 2003 | £157,492 | 12% |
8,905 Properties |
| 2002 | £138,872 | 18% |
9,929 Properties |
| 2001 | £113,892 | 15% |
9,460 Properties |
| 2000 | £96,634 | 12% |
8,206 Properties |
| 1999 | £84,898 | 14% |
9,504 Properties |
| 1998 | £73,270 | 8% |
8,532 Properties |
| 1997 | £67,551 | 12% |
8,339 Properties |
| 1996 | £59,355 | 4% |
6,964 Properties |
| 1995 | £56,939 | - |
5,326 Properties |
Property Price per Property Type in Bristol
Here you can find historic sold price data in order to help with your property search.
The average Property Paid Price for specific property types in the last three years are:
| Property Type | Average Sold Price | Sold Properties |
|---|---|---|
| Semi Detached House | £446,781.00 | 3,828 Semi Detached Houses |
| Terraced House | £408,481.00 | 7,666 Terraced Houses |
| Detached House | £673,015.00 | 858 Detached Houses |
| Flat | £289,950.00 | 5,872 Flats |