
Houses for sale & to rent in City of Bristol, England
House Prices in City of Bristol
Properties in City of Bristol have
an average house price of
£391k
and had 19,472 Property Transactions
within the last 3 years.¹
City of Bristol is a location in
England with
182,787 households², where the most expensive property was sold for £7.4M.
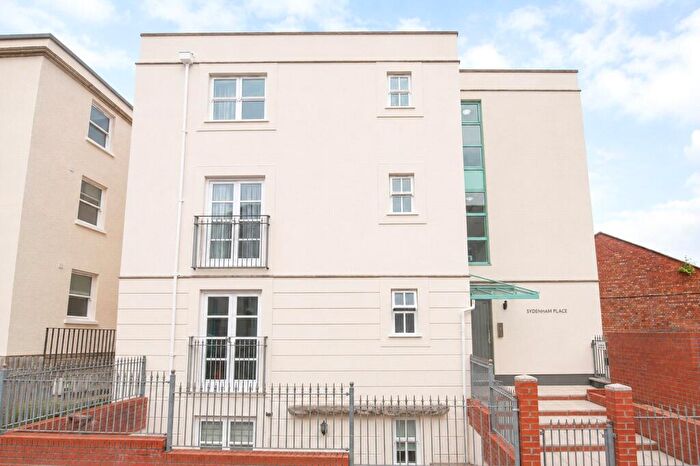
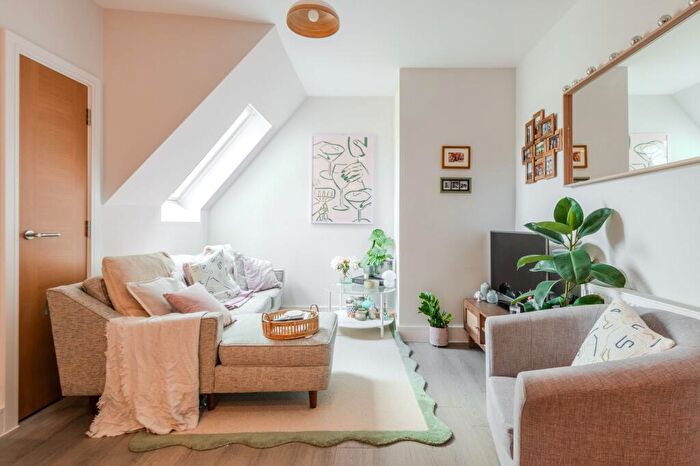
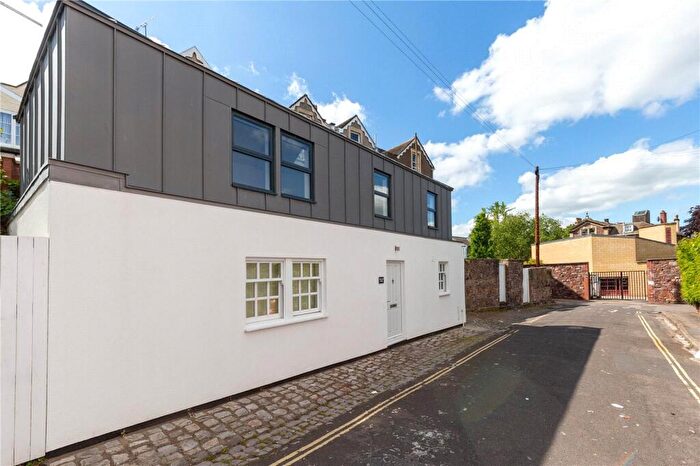
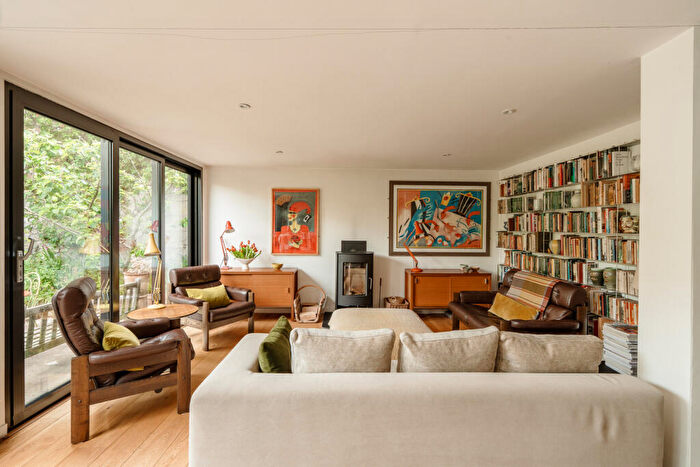
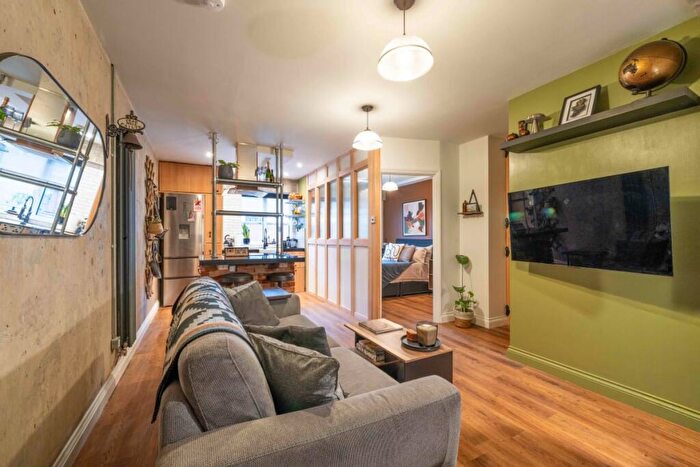
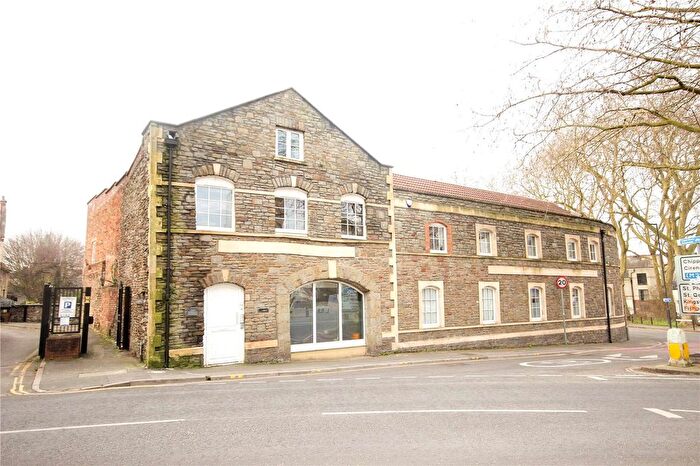
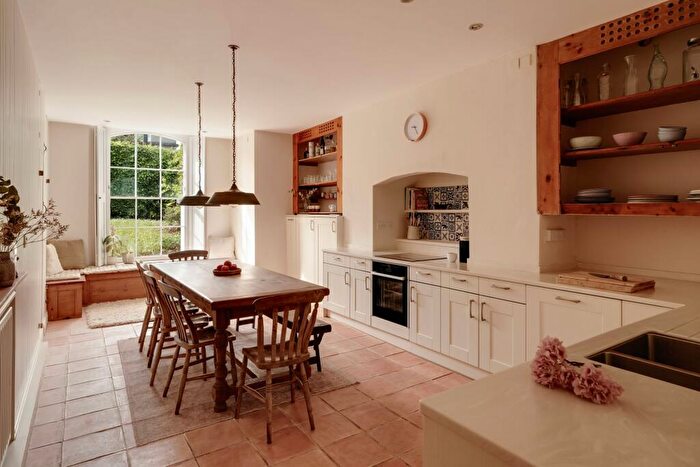
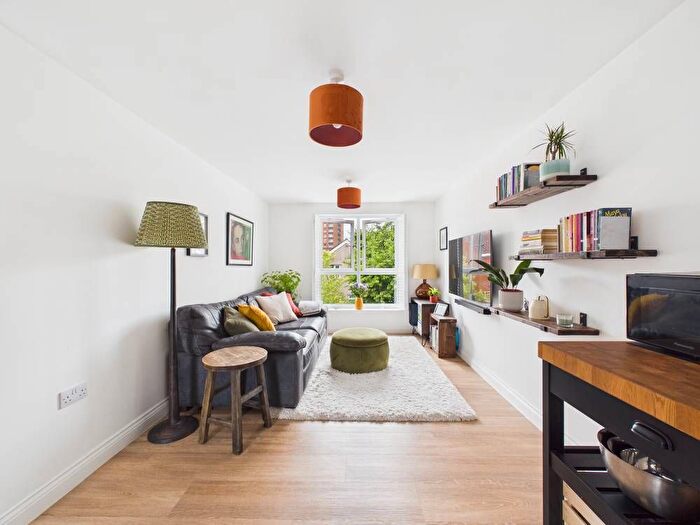
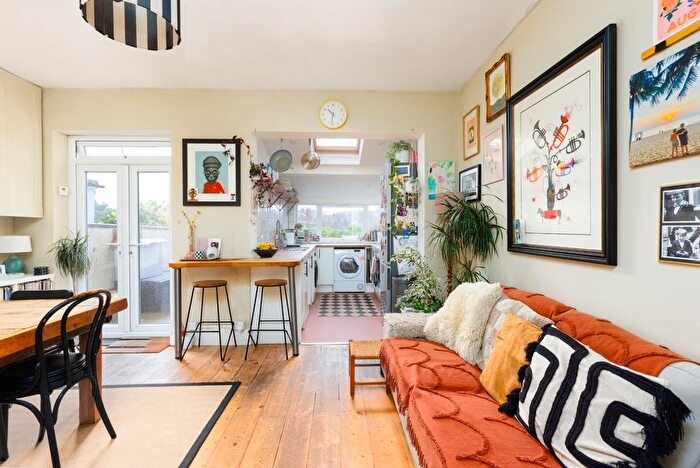
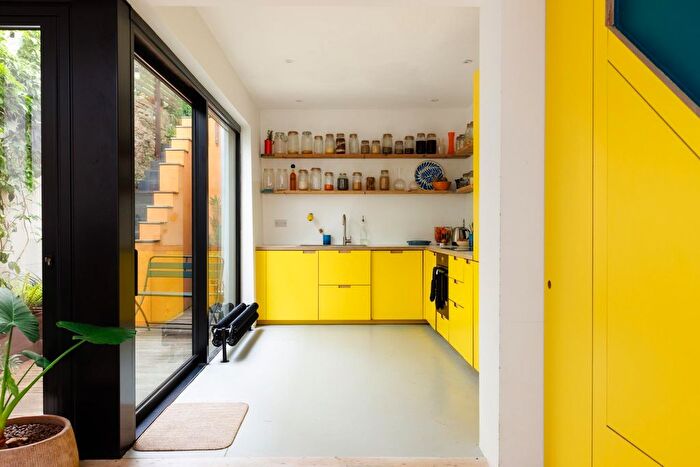
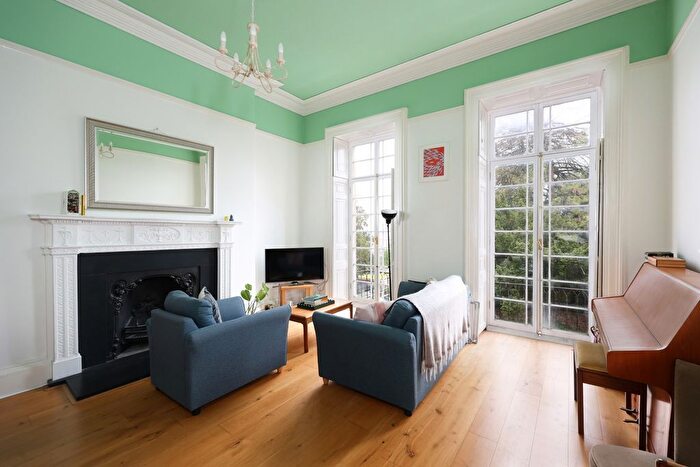
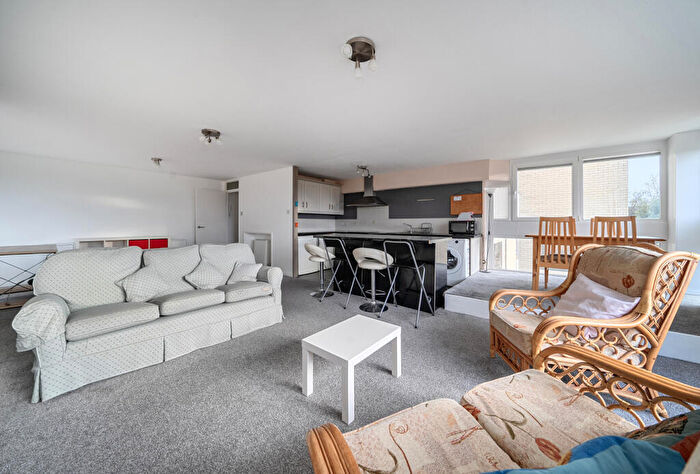
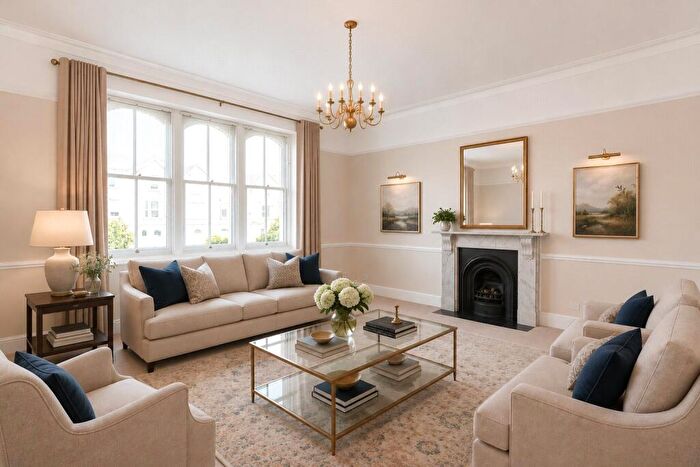
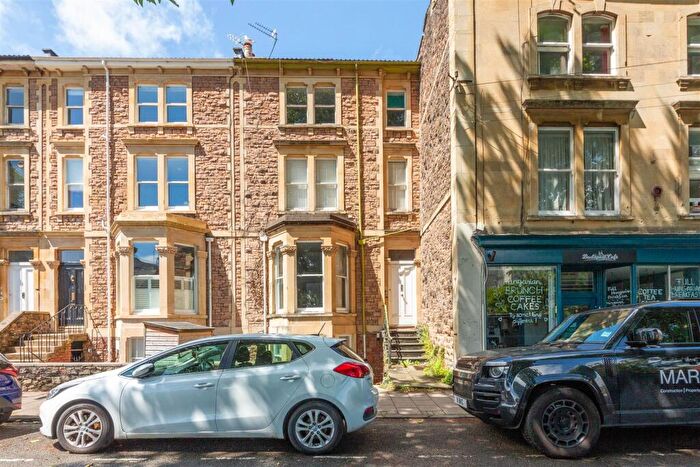
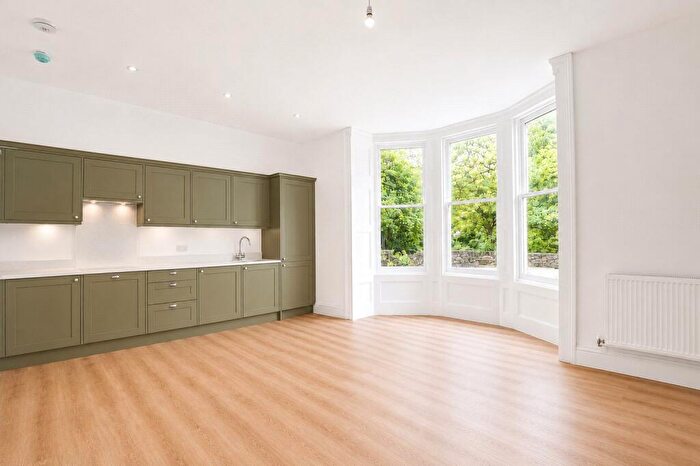
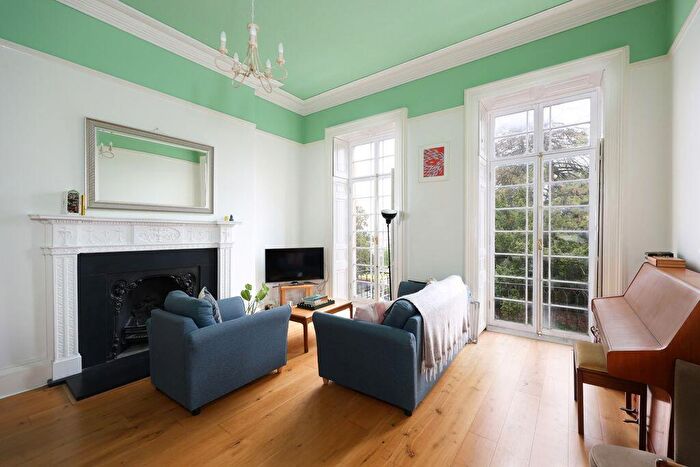
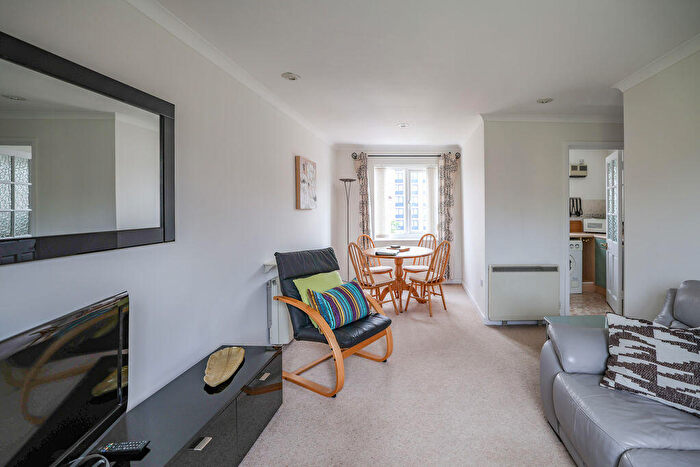
Properties for sale in City of Bristol
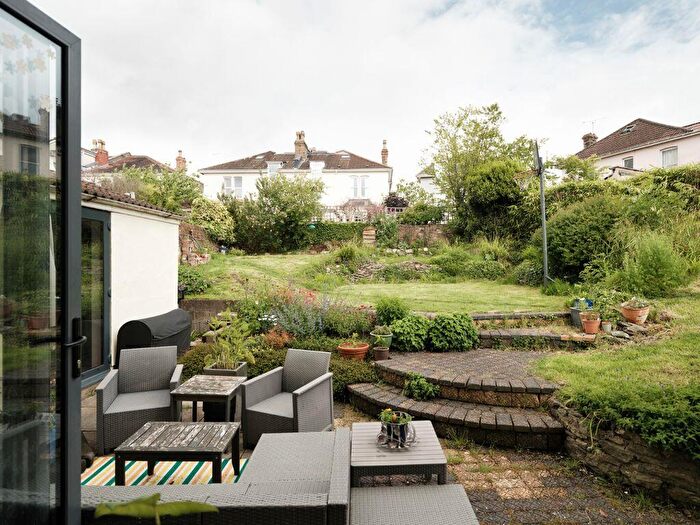
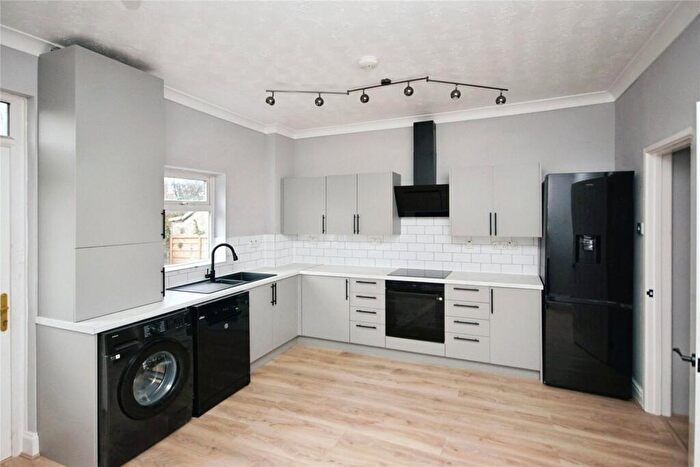
![]()
If you are looking to sell your house, let it out, or receive a property valuation, an expert can help you.
Click the button below to get started.


Towns in City of Bristol
Navigate through our locations to find the location of your next house in City of Bristol, England for sale or to rent.
Transport in City of Bristol
Please see below transportation links in this area:
-
 Montpelier Station
 -
Redland Station
-
Bristol Temple Meads Station
-
Clifton Down Station
-
Lawrence Hill Station
-
Stapleton Road Station
-
Bedminster Station
-
Parson Street Station
-
Sea Mills Station
- FAQ
- Price Paid By Year
- Property Type Price
Frequently asked questions about City of Bristol
What is the average price for a property for sale in City of Bristol?
The average price for a property for sale in City of Bristol is £390,659. This amount is 9% higher than the average price in England. There are more than 10,000 property listings for sale in City of Bristol.
Which train stations are available in or near City of Bristol?
Some of the train stations available in or near City of Bristol are Montpelier, Redland and Bristol Temple Meads.
Property Price Paid in City of Bristol by Year
The average sold property price by year was:
| Year | Average Sold Price | Price Change |
Sold Properties
|
|---|---|---|---|
| 2026 | £389,187 | -2% |
872 Properties |
| 2025 | £398,220 | 2% |
6,160 Properties |
| 2024 | £390,332 | 2% |
6,351 Properties |
| 2023 | £383,561 | -2% |
6,089 Properties |
| 2022 | £392,809 | 8% |
7,053 Properties |
| 2021 | £359,946 | 6% |
8,777 Properties |
| 2020 | £339,631 | 8% |
6,038 Properties |
| 2019 | £312,471 | 1% |
7,273 Properties |
| 2018 | £308,356 | 4% |
7,808 Properties |
| 2017 | £297,029 | 5% |
8,269 Properties |
| 2016 | £281,716 | 11% |
8,171 Properties |
| 2015 | £251,833 | 8% |
8,405 Properties |
| 2014 | £232,467 | 6% |
8,531 Properties |
| 2013 | £217,367 | 3% |
6,986 Properties |
| 2012 | £211,329 | 2% |
5,949 Properties |
| 2011 | £206,244 | -2% |
5,783 Properties |
| 2010 | £209,818 | 9% |
5,763 Properties |
| 2009 | £191,254 | -4% |
5,917 Properties |
| 2008 | £198,133 | -5% |
5,679 Properties |
| 2007 | £208,659 | 9% |
10,208 Properties |
| 2006 | £190,576 | 7% |
11,194 Properties |
| 2005 | £176,313 | 3% |
8,992 Properties |
| 2004 | £171,261 | 8% |
9,532 Properties |
| 2003 | £157,492 | 12% |
8,905 Properties |
| 2002 | £138,872 | 18% |
9,929 Properties |
| 2001 | £113,892 | 15% |
9,460 Properties |
| 2000 | £96,644 | 12% |
8,205 Properties |
| 1999 | £84,898 | 14% |
9,504 Properties |
| 1998 | £73,270 | 8% |
8,532 Properties |
| 1997 | £67,558 | 12% |
8,340 Properties |
| 1996 | £59,355 | 4% |
6,964 Properties |
| 1995 | £56,939 | - |
5,326 Properties |
Property Price per Property Type in City of Bristol
Here you can find historic sold price data in order to help with your property search.
The average Property Paid Price for specific property types in the last three years are:
| Property Type | Average Sold Price | Sold Properties |
|---|---|---|
| Semi Detached House | £446,798.00 | 4,108 Semi Detached Houses |
| Terraced House | £407,908.00 | 8,206 Terraced Houses |
| Detached House | £669,088.00 | 916 Detached Houses |
| Flat | £290,177.00 | 6,242 Flats |