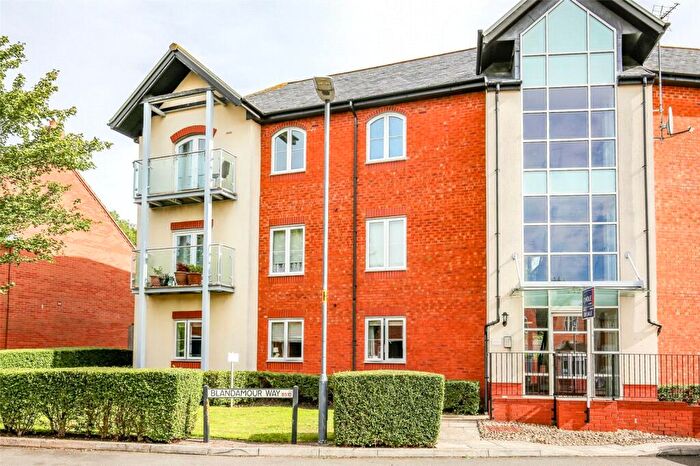
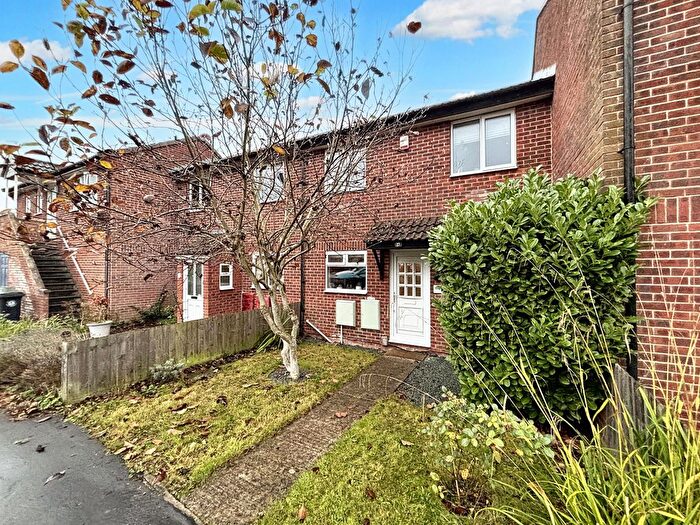
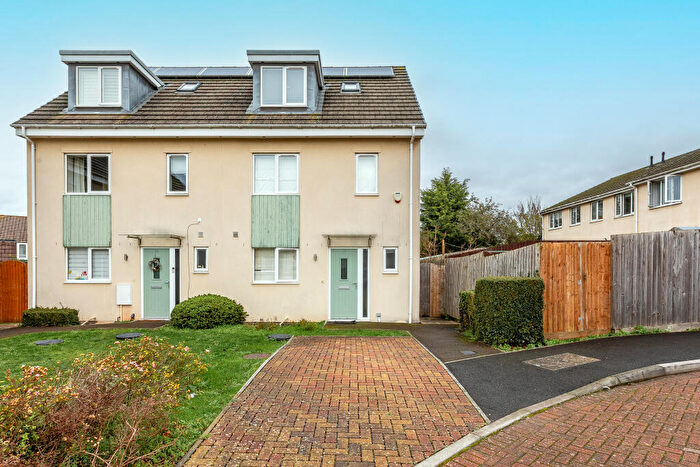
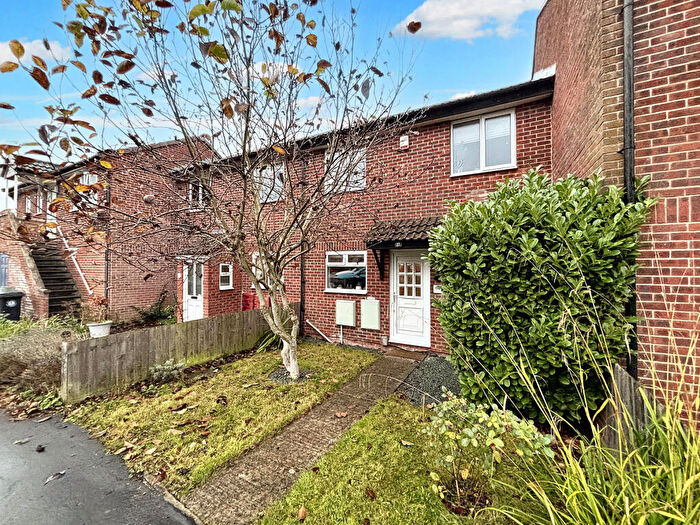
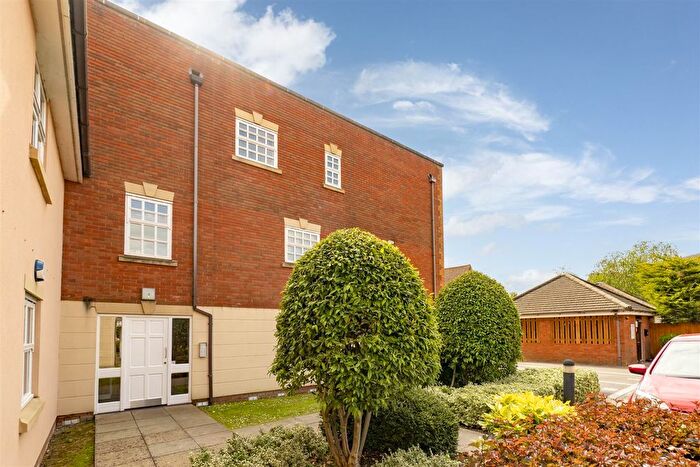
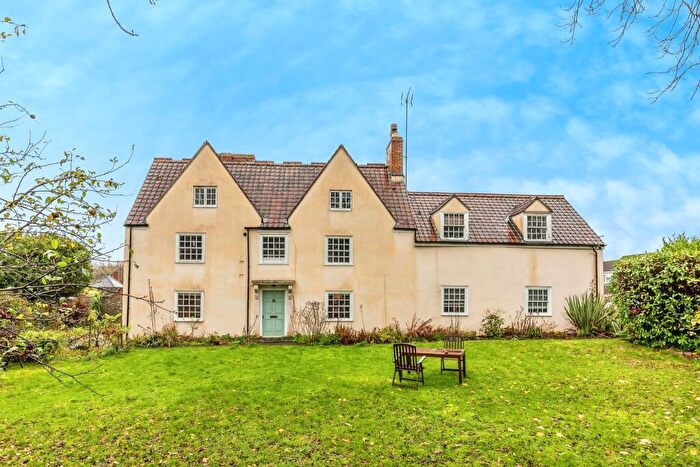
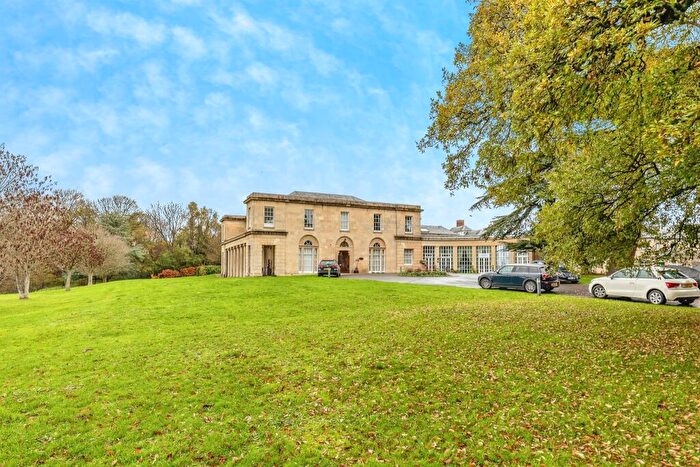
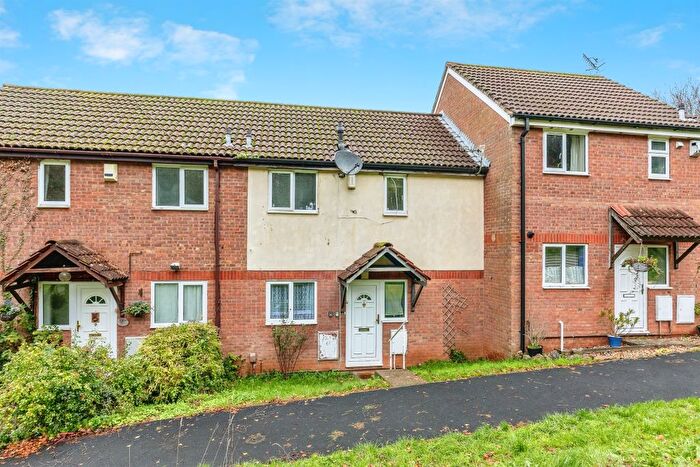
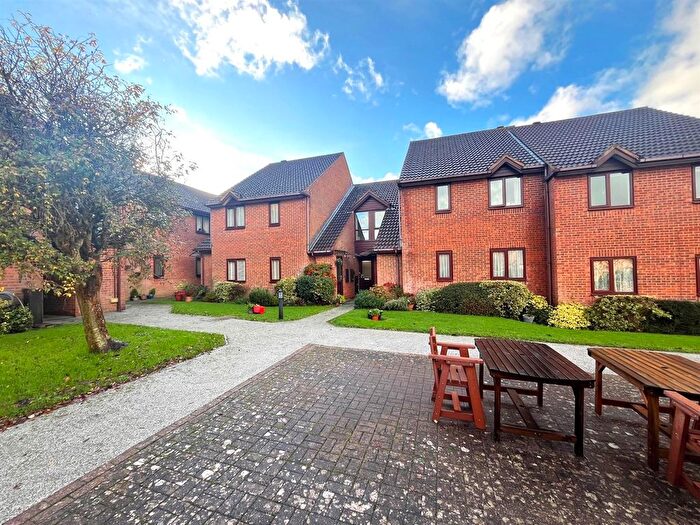
Houses for sale & to rent in Henbury and Brentry, Bristol
House Prices in Henbury and Brentry
Properties in Henbury and Brentry have an average house price of £371,017.00 and had 29 Property Transactions within the last 3 years¹.
Henbury and Brentry is an area in Bristol, City of Bristol with 386 households², where the most expensive property was sold for £750,000.00.
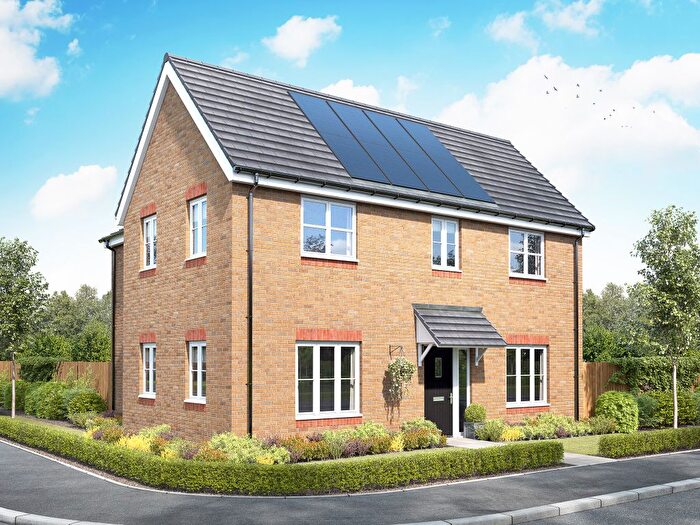
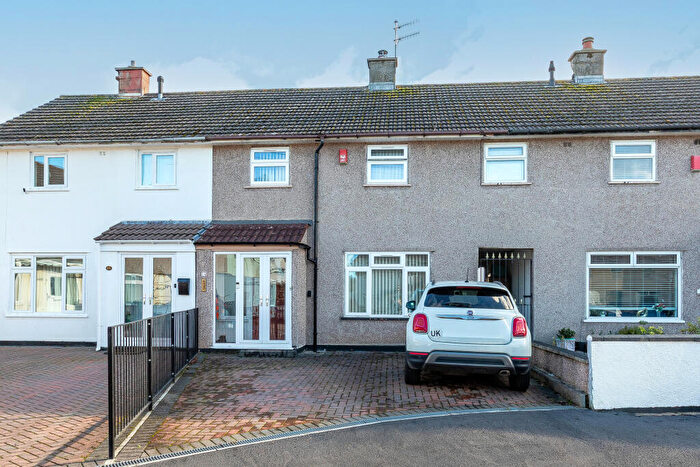
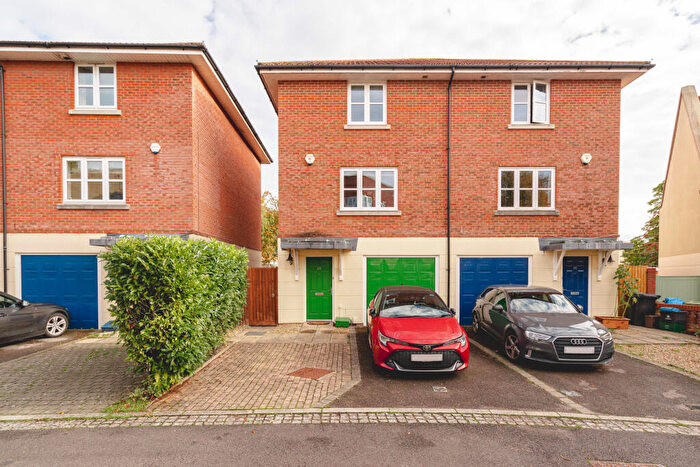
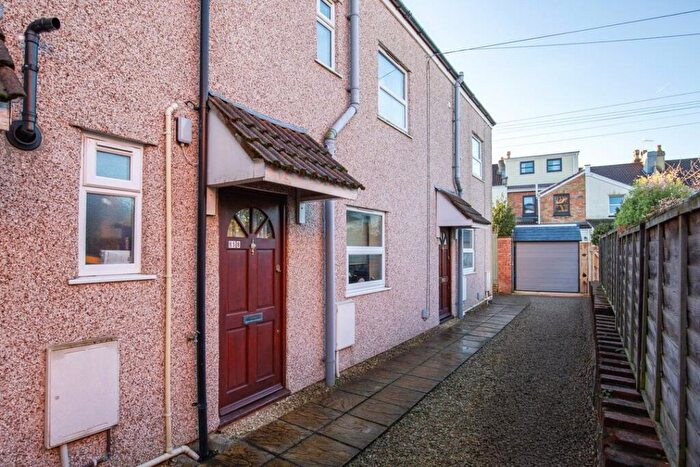
Properties for sale in Henbury and Brentry
Roads and Postcodes in Henbury and Brentry
Navigate through our locations to find the location of your next house in Henbury and Brentry, Bristol for sale or to rent.
| Streets | Postcodes |
|---|---|
| Ardenton Walk | BS10 6SF BS10 6SP |
| Avonmouth Way | BS10 7NG |
| Barnwell Close | BS10 7JR |
| Blaise Hamlet | BS10 7QY |
| Challender Court Lane | BS10 7FS |
| Champneys Avenue | BS10 7LF |
| Charlton Park | BS10 6FE BS10 6UE |
| Charlton Road | BS10 6NF BS10 6NP |
| Crandell Close | BS10 7LU |
| Crow Lane | BS10 7DP BS10 7DR BS10 7DT BS10 7DU BS10 7DW BS10 7EN BS10 7FB |
| Henbury Court | BS10 7QW |
| Henbury Road | BS10 7QS |
| Ison Hill Road | BS10 7XA |
| Lower Knole Lane | BS10 6UD |
| Machin Gardens | BS10 7FJ BS10 7HE |
| Modecombe Grove | BS10 7PF |
| Okebourne Road | BS10 6RA BS10 6TR |
| Oxhouse Gardens | BS10 7JT |
| Peverell Court Lane | BS10 7FT |
| Priestwood Close | BS10 7DX |
| Rectory Gardens | BS10 7AH |
| Richeson Close | BS10 7FU BS10 7FX |
| Robin Close | BS10 6JG |
| Royal Victoria Park | BS10 6TL |
| Slymbridge Avenue | BS10 7JQ |
| Standfast Road | BS10 7HP BS10 7HW BS10 7HX |
| Station Road | BS10 7LX BS10 7QJ |
| Suffolk Close | BS10 6UB |
| The Chalet | BS10 7NQ |
| Thornfield Road | BS10 6FB BS10 6FD BS10 6NA BS10 6NB |
| Tormarton Crescent | BS10 7LN BS10 7LP |
| Turnbridge Mews | BS10 6FF |
| West Way | BS34 7DU |
| Wyck Beck Road | BS10 7FD |
| Yew Tree Place | BS10 6FH |
Transport near Henbury and Brentry
- FAQ
- Price Paid By Year
- Property Type Price
Frequently asked questions about Henbury and Brentry
What is the average price for a property for sale in Henbury and Brentry?
The average price for a property for sale in Henbury and Brentry is £371,017. This amount is 5% lower than the average price in Bristol. There are 2,630 property listings for sale in Henbury and Brentry.
What streets have the most expensive properties for sale in Henbury and Brentry?
The streets with the most expensive properties for sale in Henbury and Brentry are Station Road at an average of £720,000, Thornfield Road at an average of £376,071 and Charlton Park at an average of £368,250.
What streets have the most affordable properties for sale in Henbury and Brentry?
The streets with the most affordable properties for sale in Henbury and Brentry are Tormarton Crescent at an average of £150,000, Henbury Court at an average of £168,000 and Wyck Beck Road at an average of £201,750.
Which train stations are available in or near Henbury and Brentry?
Some of the train stations available in or near Henbury and Brentry are Filton Abbey Wood, Sea Mills and Patchway.
Property Price Paid in Henbury and Brentry by Year
The average sold property price by year was:
| Year | Average Sold Price | Price Change |
Sold Properties
|
|---|---|---|---|
| 2025 | £357,785 | -9% |
7 Properties |
| 2024 | £389,950 | -4% |
10 Properties |
| 2023 | £405,000 | 14% |
3 Properties |
| 2022 | £348,944 | 8% |
9 Properties |
| 2021 | £321,370 | 11% |
10 Properties |
| 2020 | £284,875 | -10% |
12 Properties |
| 2019 | £313,625 | 20% |
4 Properties |
| 2018 | £249,475 | -13% |
20 Properties |
| 2017 | £283,000 | 9% |
6 Properties |
| 2016 | £256,505 | -5% |
48 Properties |
| 2015 | £268,696 | 16% |
28 Properties |
| 2007 | £226,500 | 61% |
2 Properties |
| 2002 | £87,500 | - |
2 Properties |
Property Price per Property Type in Henbury and Brentry
Here you can find historic sold price data in order to help with your property search.
The average Property Paid Price for specific property types in the last three years are:
| Property Type | Average Sold Price | Sold Properties |
|---|---|---|
| Semi Detached House | £405,150.00 | 10 Semi Detached Houses |
| Detached House | £720,000.00 | 3 Detached Houses |
| Terraced House | £364,375.00 | 8 Terraced Houses |
| Flat | £204,125.00 | 8 Flats |


