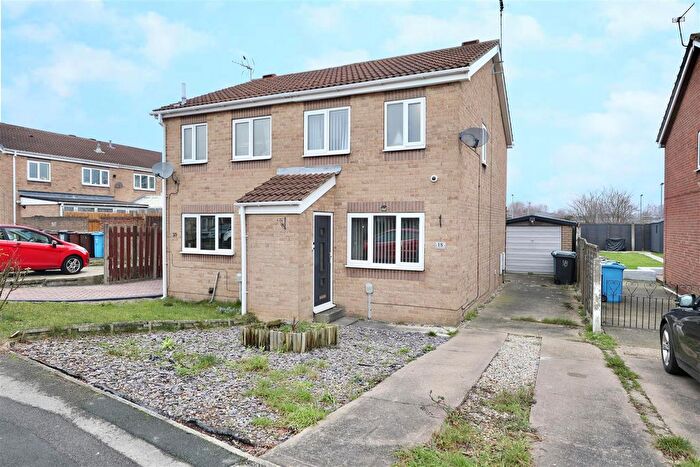
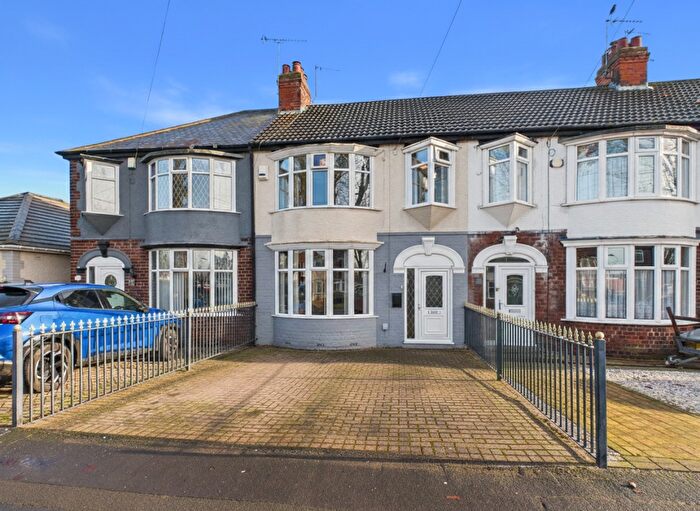
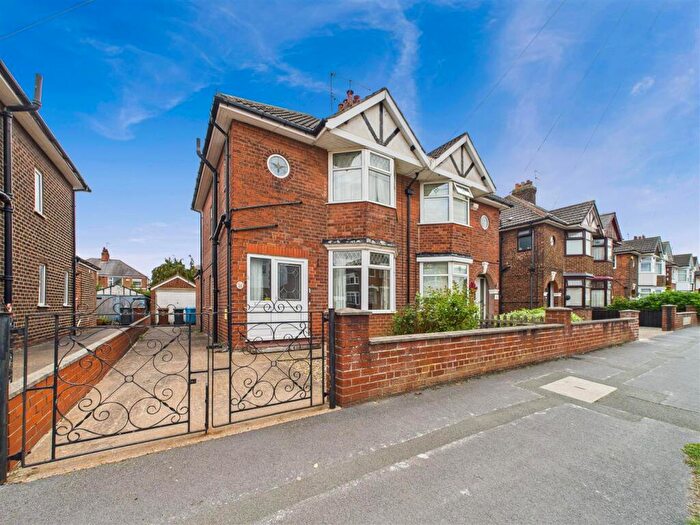
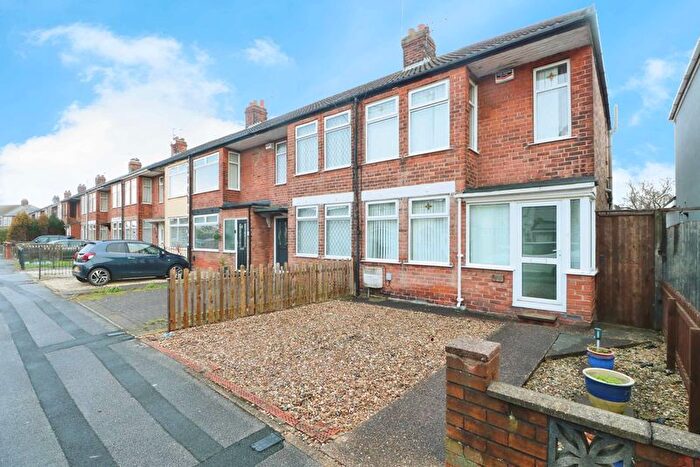
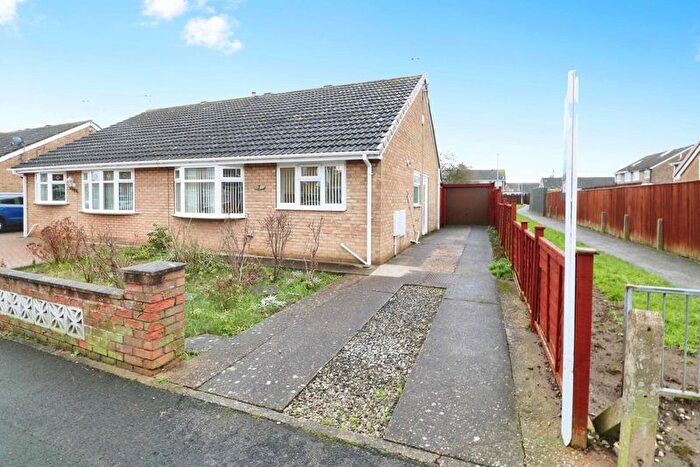
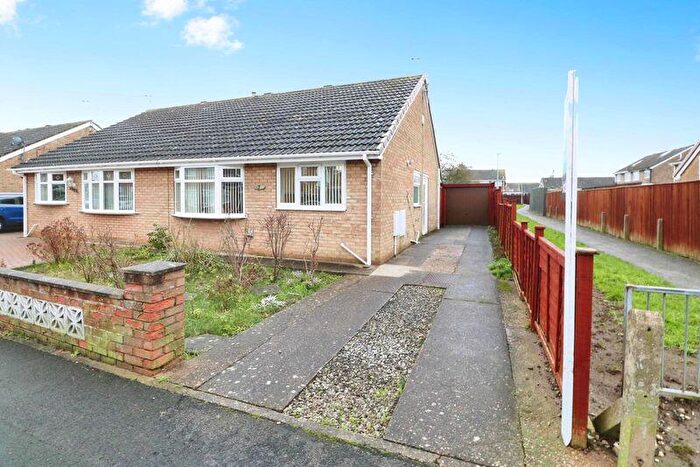
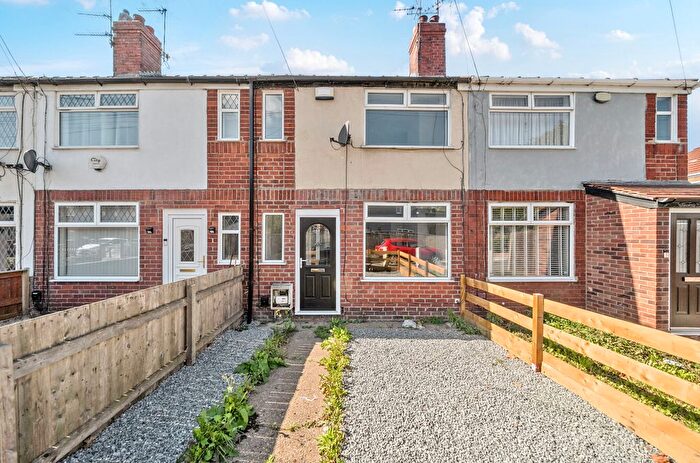
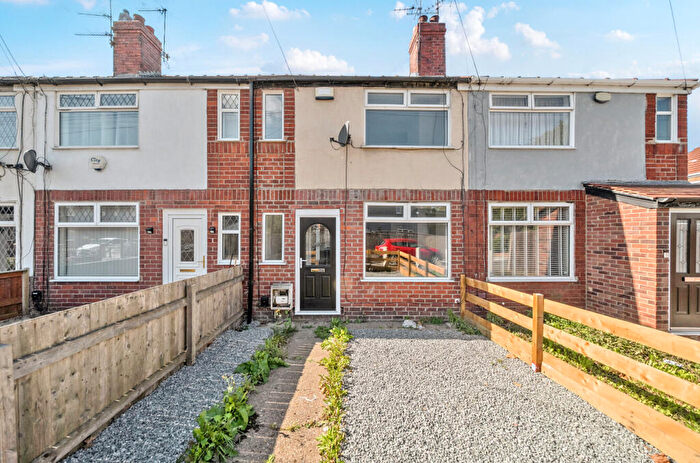
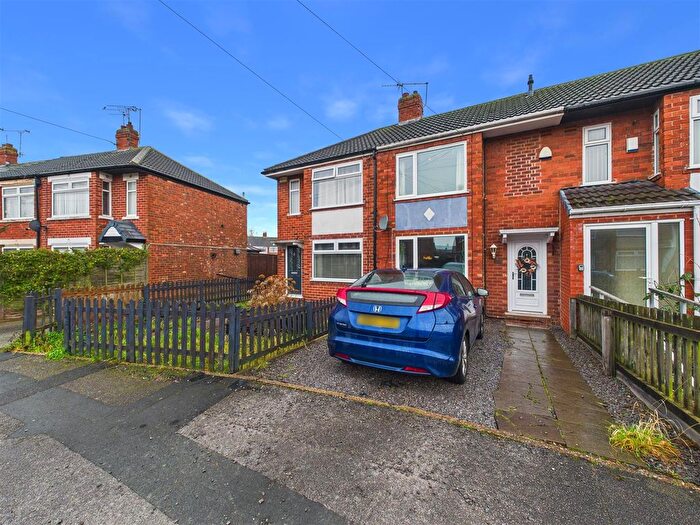
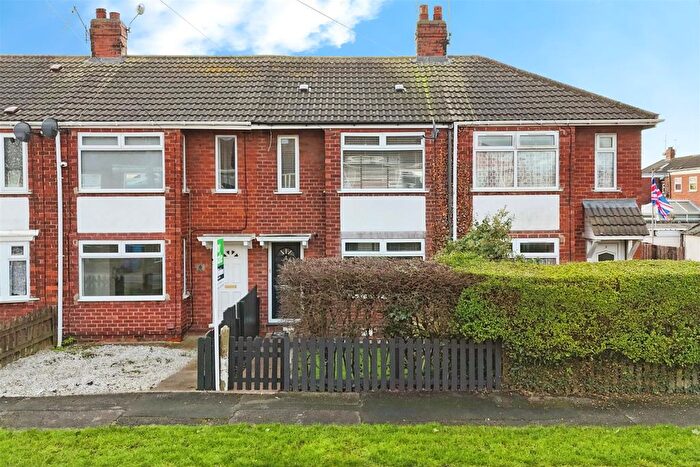
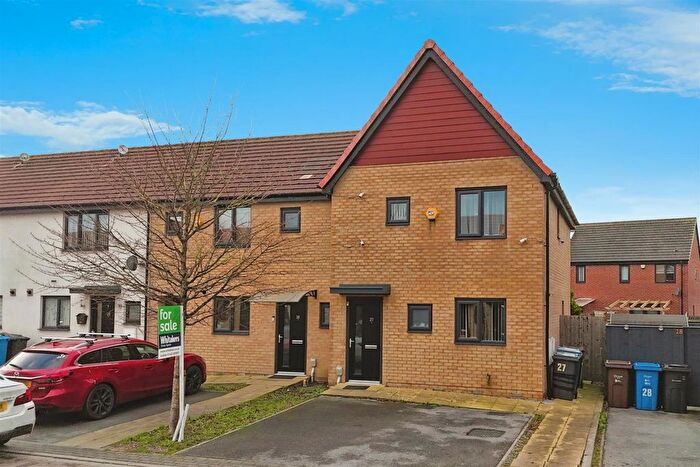
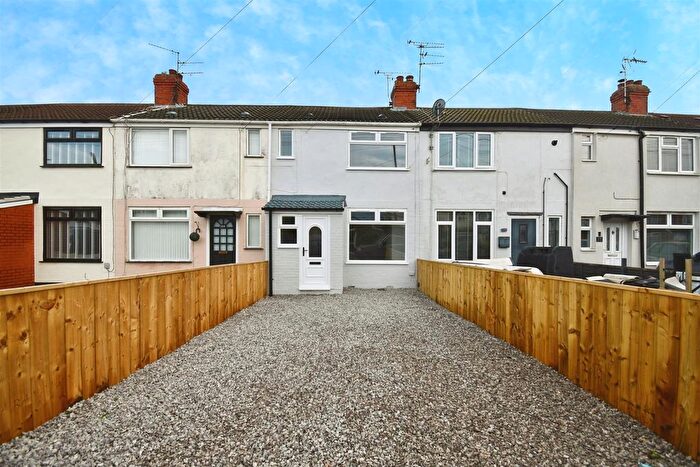
Houses for sale & to rent in Boothferry, Hull
House Prices in Boothferry
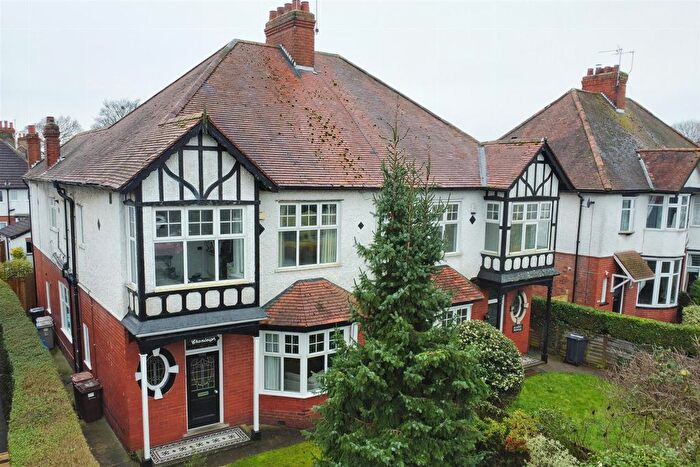
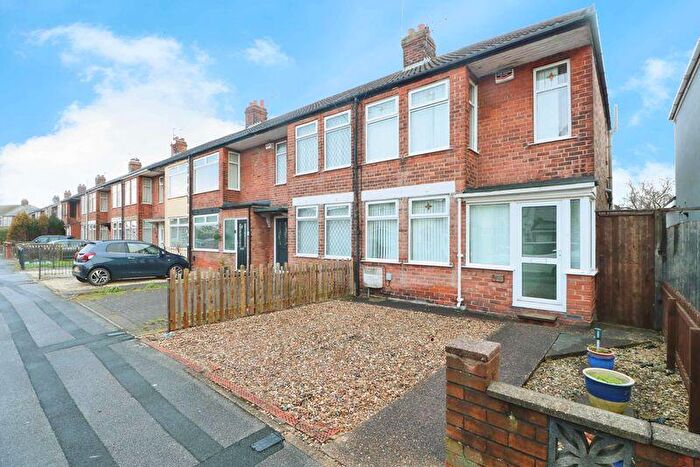
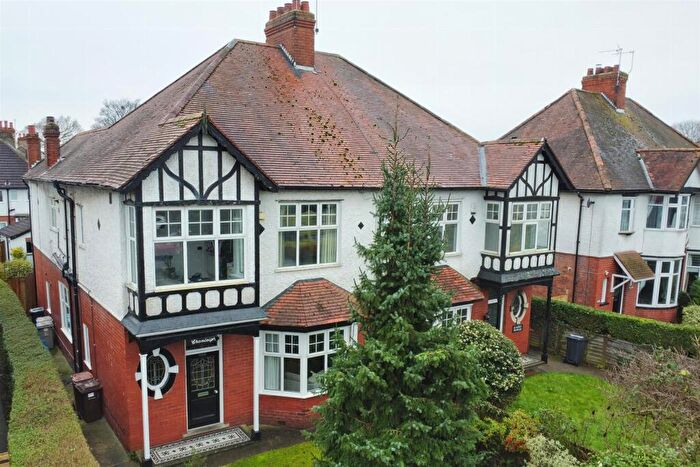
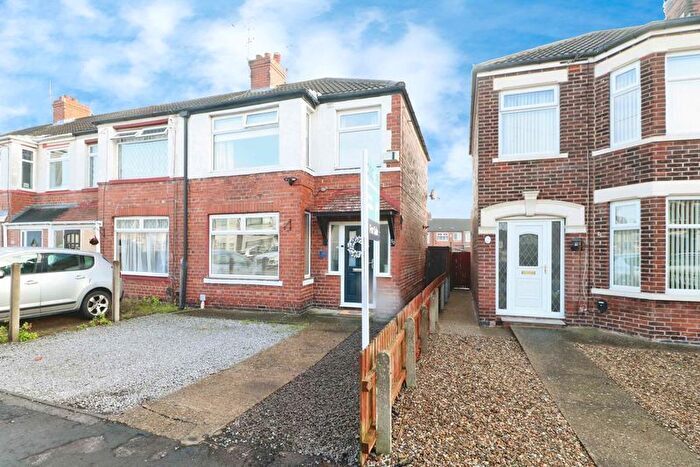
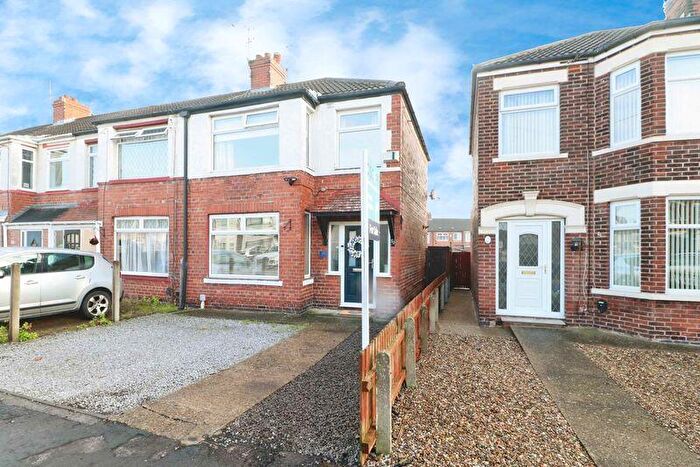
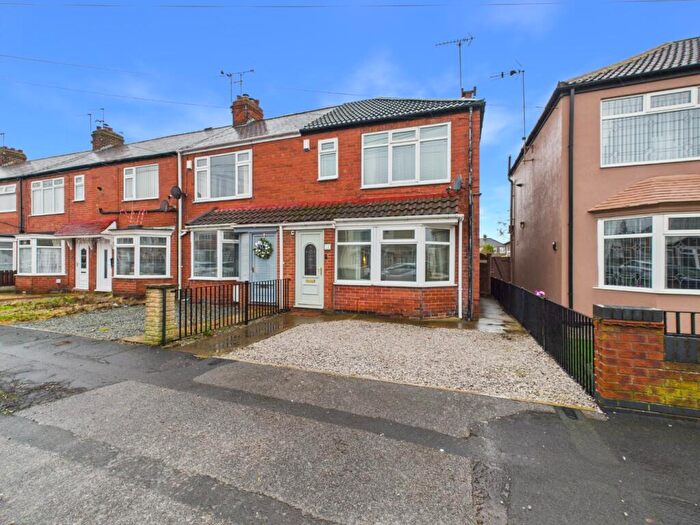
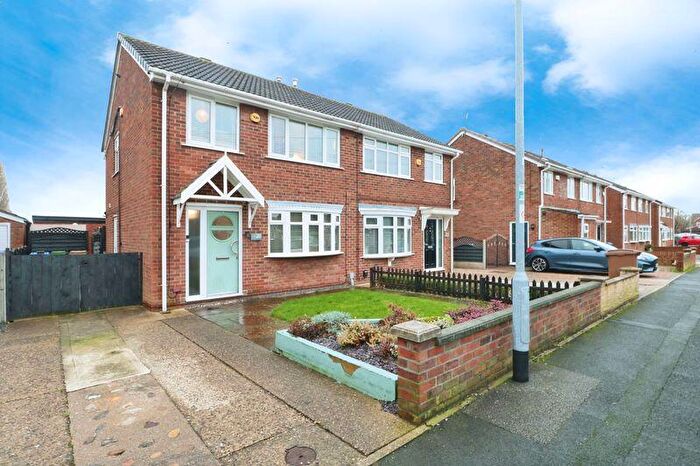
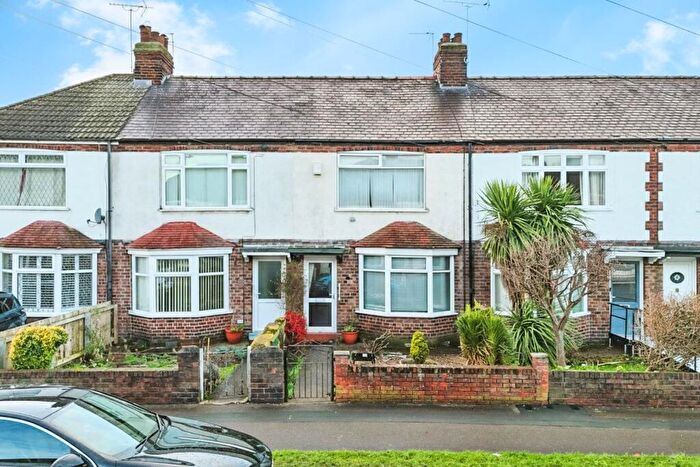
Properties in Boothferry have an average house price of £146,361.00 and had 502 Property Transactions within the last 3 years¹.
Boothferry is an area in Hull, City of Kingston upon Hull with 5,251 households², where the most expensive property was sold for £355,000.00.
Properties for sale in Boothferry
Roads and Postcodes in Boothferry
Navigate through our locations to find the location of your next house in Boothferry, Hull for sale or to rent.
| Streets | Postcodes |
|---|---|
| Anlaby Road | HU4 6AG HU4 6XA HU4 6XZ HU3 6UL HU3 6UU HU3 6UZ HU4 6AH HU4 6AT HU4 6BP HU4 6BX HU4 6DJ HU4 6DL HU4 7PN HU4 7PP HU4 7PW HU4 7RA HU4 6BB |
| Aldwych Court | HU5 5EQ |
| Ampleforth Grove | HU5 5EZ HU5 5HA HU5 5HB |
| Anlaby Park Road North | HU4 6XN HU4 6XP HU4 6XT HU4 6XW HU4 6XQ |
| Arcon Drive | HU4 6AB HU4 6AD HU4 6AQ |
| Ascott Close | HU4 6EQ |
| Aylesbury Grove | HU5 5DP |
| Bargate Grove | HU5 5DL |
| Belgrave Drive | HU4 6DN HU4 6DP HU4 6DR HU4 6DW |
| Bempton Grove | HU5 5DB |
| Bermondsey Drive | HU5 5EH |
| Boothferry Road | HU4 6EN HU4 6ER HU4 6ES HU4 6EW HU3 6UH |
| Boundary Way | HU4 6DH HU4 6DQ |
| Brooklands Road | HU5 5AD HU5 5AE HU5 5AF HU5 5AG |
| Buttermere Close | HU4 6DG |
| Calvert Lane | HU4 6BH HU4 6BJ HU4 6BL HU4 6DF HU4 6BN |
| Calvert Road | HU5 5DD HU5 5DE HU5 5DF HU5 5DG HU5 5DH HU5 5DQ |
| Cardigan Road | HU3 6XA HU3 6XB HU3 6XD HU3 6XE |
| Celandine Close | HU5 5GA |
| Chancery Court | HU5 5EW |
| Coppice Side | HU4 6XJ |
| County Road South | HU5 5LU HU5 5NB |
| Dunston Road | HU5 5ES HU5 5ET |
| East Ella Drive | HU4 6AL HU4 6AN |
| Eastfield Road | HU4 6DS HU4 6DU HU4 6DX HU4 6DY HU4 6DT |
| Falsgrave Grove | HU5 5EN |
| Flaxdale Court | HU5 5DR |
| Greystone Avenue | HU5 5BD |
| Hamlyn Avenue | HU4 6BT HU4 6BU |
| Hamlyn Drive | HU4 6BY |
| Hastings Grove | HU5 5BJ |
| Hawkshead Green | HU4 7SZ |
| Heather Close | HU5 5GB |
| Helmsley Grove | HU5 5EL |
| Home Close | HU4 6TT |
| Ingleton Avenue | HU4 6AS |
| Kirklands Road | HU5 5AS HU5 5AT HU5 5AU HU5 5AX |
| Laurel Lane | HU4 6EG |
| Legarde Avenue | HU4 6AP |
| Lexington Drive | HU4 6TH |
| Lindsey Place | HU4 6AE HU4 6AF HU4 6AJ HU4 6BS |
| Lockton Grove | HU5 5BU |
| Lomond Road | HU5 5BN HU5 5BP HU5 5BS |
| Lowdale Close | HU5 5DS |
| Luton Road | HU5 5AJ |
| Malham Avenue | HU4 6AR |
| Mead Walk | HU4 6XE HU4 6XL |
| Meadowbank Road | HU3 6XL HU3 6XN HU3 6XP HU3 6XW |
| Newington Avenue | HU4 6EP |
| Norland Avenue | HU4 7RB |
| North Road | HU4 6BZ HU4 6DD |
| Northella Drive | HU4 6DE |
| Orchard Road | HU4 6XS |
| Park Lane East | HU4 6TN HU4 6TW |
| Park Lane West | HU4 6TU |
| Patterdale Road | HU5 5AP HU5 5AR |
| Pickering Road | HU4 6TA HU4 6TB HU4 6TD HU4 6TE HU4 6TL |
| Plantation Drive East | HU4 6XB |
| Plantation Drive West | HU4 6XD |
| Providence Crescent | HU4 6EF |
| Rosedale Grove | HU5 5BT HU5 5BX HU5 5BZ HU5 5DA |
| Roslyn Road | HU3 6XG HU3 6XH HU3 6XJ HU3 6XQ |
| Rutland Road | HU5 5AL |
| Sandale Court | HU5 5DW |
| Scalby Grove | HU5 5UJ HU5 5UL |
| Segrave Grove | HU5 5DJ HU5 5DN |
| Snainton Grove | HU5 5BY |
| Sorrel Drive | HU5 5GD |
| Southburn Avenue | HU5 5BB |
| Southern Drive | HU4 6TR HU4 6TS |
| Speeton Grove | HU5 5DU |
| Spinney Walk | HU4 6XG |
| Spring Bank West | HU5 5AA HU5 5AB HU5 5AN HU5 5AW HU5 5BA HU5 5BE HU5 5BG HU5 5BL HU5 5EP HU5 5EU HU5 5HD |
| St Joseph Drive | HU4 6TJ HU4 6TF |
| St Martins Avenue | HU4 6DB |
| Sunbeam Road | HU4 6DZ |
| The Greenway | HU4 6XH |
| The Link | HU4 6TX |
| The Paddock | HU4 6XU |
| The Roundway | HU4 6XR |
| Trenton Avenue | HU4 7RP |
| Westfield Road | HU4 6EA HU4 6EB HU4 6ED HU4 6EE |
| Whitelee Court | HU4 6AZ |
| Willerby Road | HU5 5DT HU5 5DX HU5 5DZ HU5 5JL HU5 5JN |
| Wold Road | HU5 5LT HU5 5UN |
| Woodgate Lane | HU5 5AY |
| Woodgate Road | HU5 5AH |
| Woodland End | HU4 6TP |
Transport near Boothferry
- FAQ
- Price Paid By Year
- Property Type Price
Frequently asked questions about Boothferry
What is the average price for a property for sale in Boothferry?
The average price for a property for sale in Boothferry is £146,361. This amount is 10% higher than the average price in Hull. There are 2,070 property listings for sale in Boothferry.
What streets have the most expensive properties for sale in Boothferry?
The streets with the most expensive properties for sale in Boothferry are Coppice Side at an average of £307,500, Mead Walk at an average of £305,000 and Legarde Avenue at an average of £276,250.
What streets have the most affordable properties for sale in Boothferry?
The streets with the most affordable properties for sale in Boothferry are Lindsey Place at an average of £47,333, Flaxdale Court at an average of £67,500 and Lowdale Close at an average of £82,812.
Which train stations are available in or near Boothferry?
Some of the train stations available in or near Boothferry are Hull, Cottingham and Hessle.
Property Price Paid in Boothferry by Year
The average sold property price by year was:
| Year | Average Sold Price | Price Change |
Sold Properties
|
|---|---|---|---|
| 2025 | £153,396 | 6% |
136 Properties |
| 2024 | £143,932 | 0,3% |
186 Properties |
| 2023 | £143,555 | -6% |
180 Properties |
| 2022 | £151,630 | 4% |
201 Properties |
| 2021 | £145,295 | 8% |
217 Properties |
| 2020 | £133,023 | 6% |
170 Properties |
| 2019 | £124,973 | 1% |
192 Properties |
| 2018 | £124,317 | -1% |
223 Properties |
| 2017 | £126,178 | 3% |
190 Properties |
| 2016 | £122,516 | -6% |
164 Properties |
| 2015 | £130,027 | 6% |
246 Properties |
| 2014 | £121,720 | 14% |
229 Properties |
| 2013 | £104,287 | -6% |
163 Properties |
| 2012 | £110,925 | 7% |
110 Properties |
| 2011 | £103,268 | -4% |
125 Properties |
| 2010 | £107,144 | 0,5% |
133 Properties |
| 2009 | £106,636 | 2% |
90 Properties |
| 2008 | £104,088 | -8% |
110 Properties |
| 2007 | £112,708 | 8% |
265 Properties |
| 2006 | £103,570 | 7% |
268 Properties |
| 2005 | £96,672 | 13% |
202 Properties |
| 2004 | £83,777 | 22% |
287 Properties |
| 2003 | £65,033 | 18% |
320 Properties |
| 2002 | £53,643 | 16% |
307 Properties |
| 2001 | £45,278 | 7% |
294 Properties |
| 2000 | £42,264 | -2% |
268 Properties |
| 1999 | £43,087 | 7% |
221 Properties |
| 1998 | £40,162 | -4% |
221 Properties |
| 1997 | £41,829 | 7% |
223 Properties |
| 1996 | £39,057 | -2% |
205 Properties |
| 1995 | £39,659 | - |
183 Properties |
Property Price per Property Type in Boothferry
Here you can find historic sold price data in order to help with your property search.
The average Property Paid Price for specific property types in the last three years are:
| Property Type | Average Sold Price | Sold Properties |
|---|---|---|
| Flat | £60,000.00 | 12 Flats |
| Semi Detached House | £193,425.00 | 108 Semi Detached Houses |
| Detached House | £254,263.00 | 19 Detached Houses |
| Terraced House | £129,566.00 | 363 Terraced Houses |

