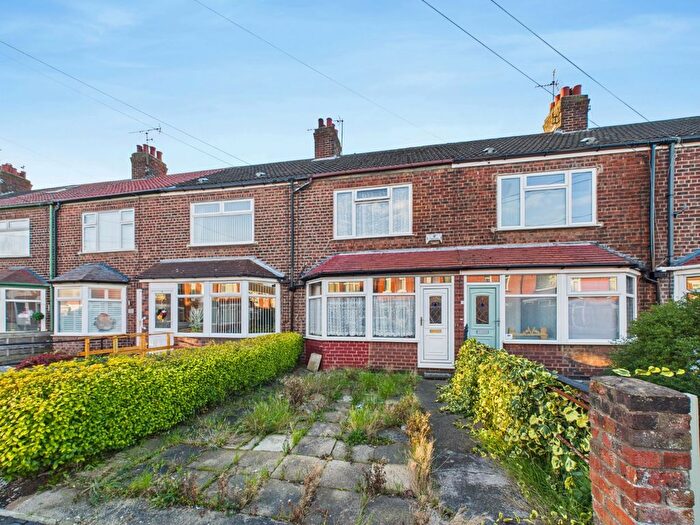
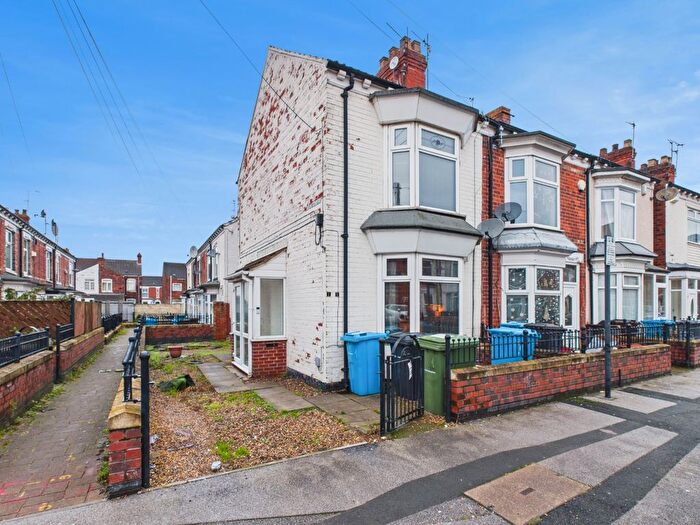
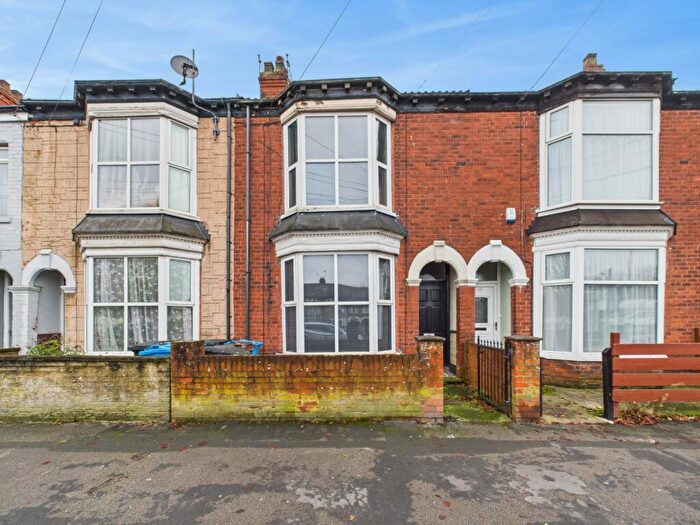
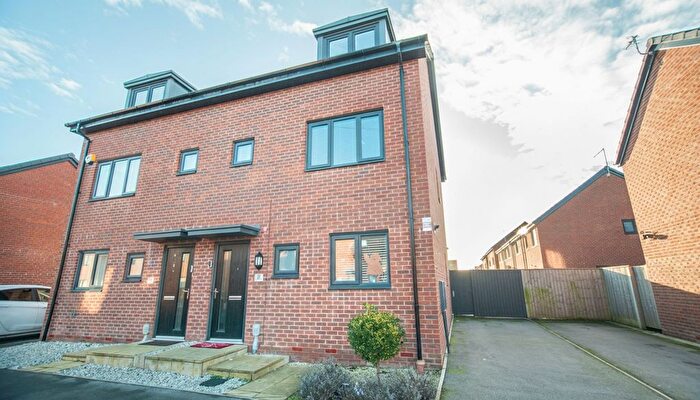
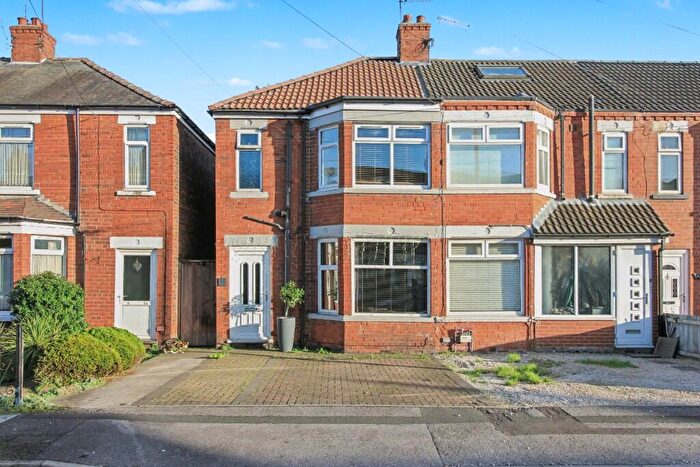
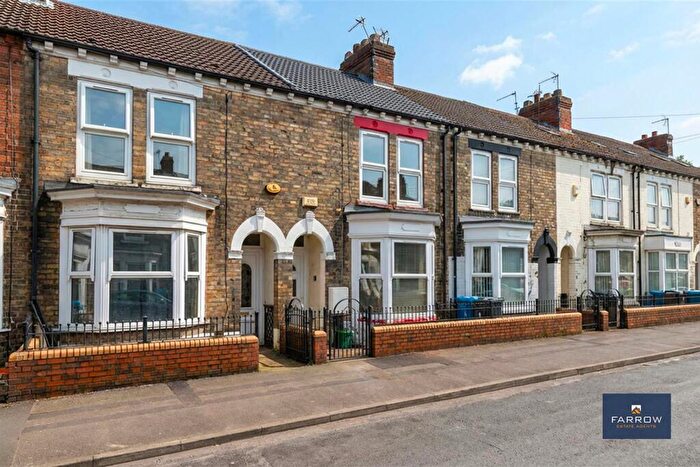
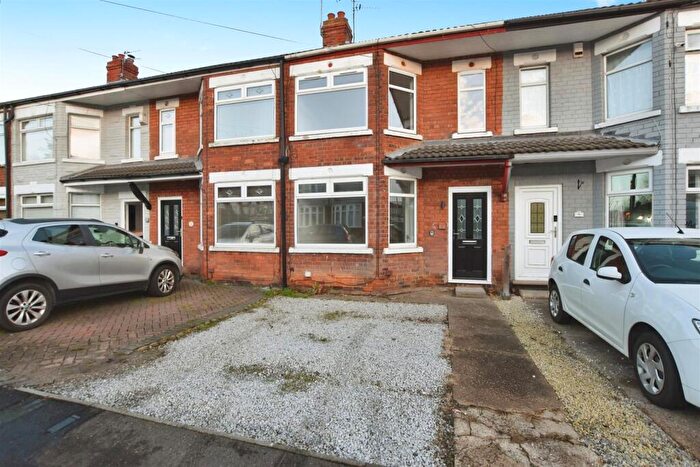
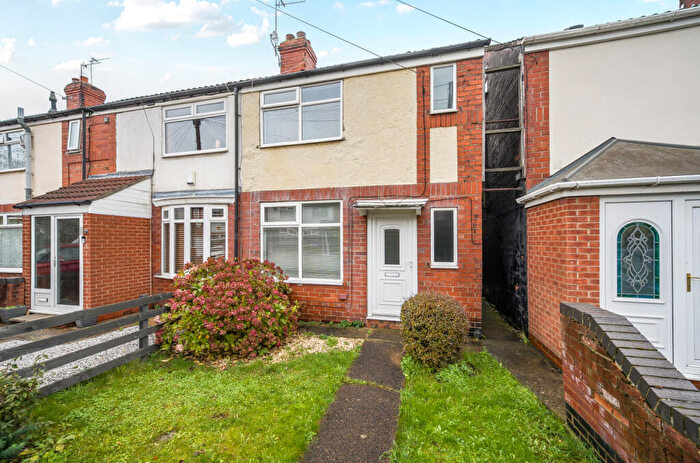
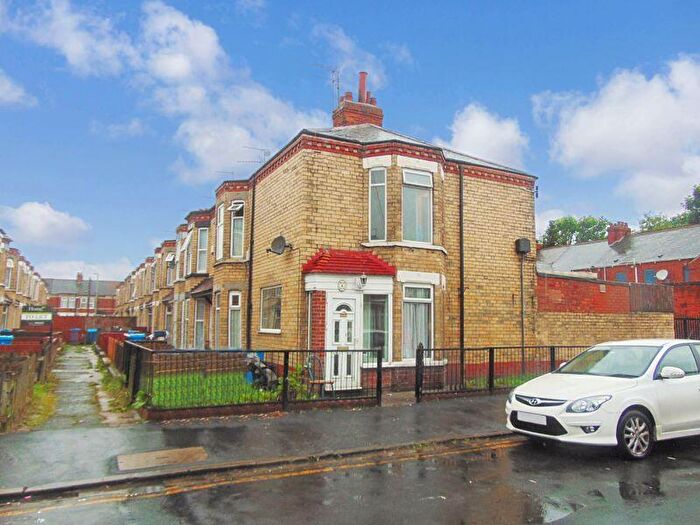
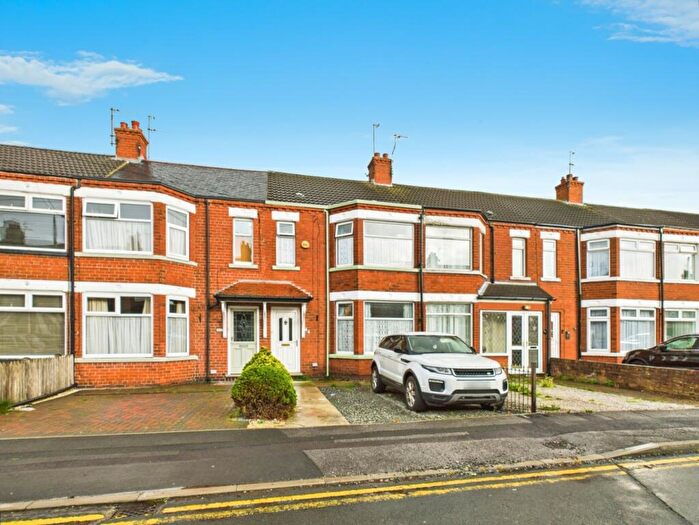
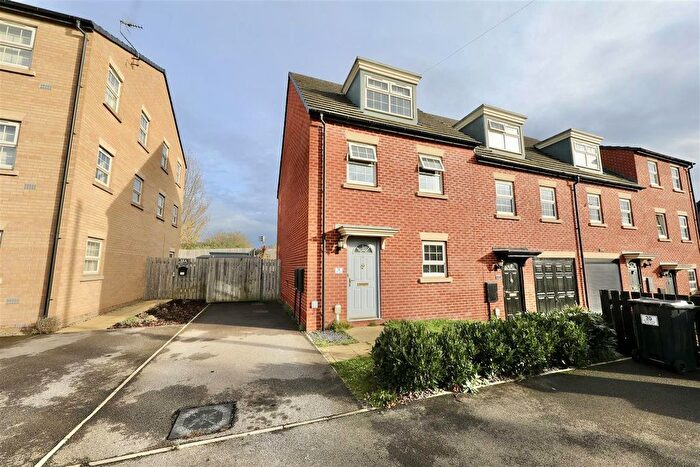
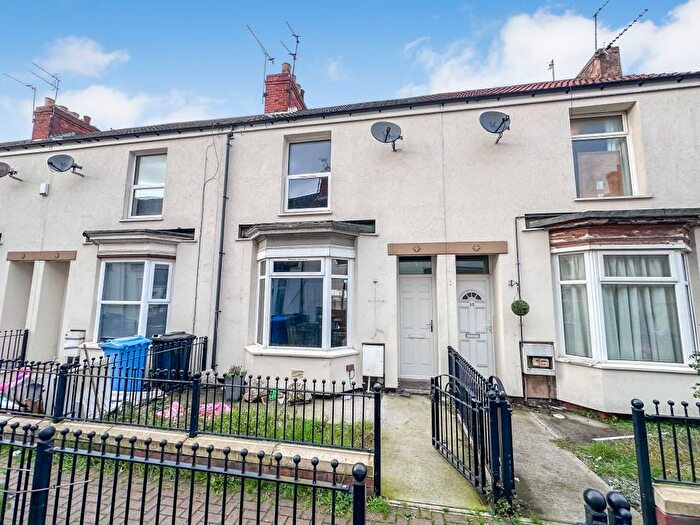
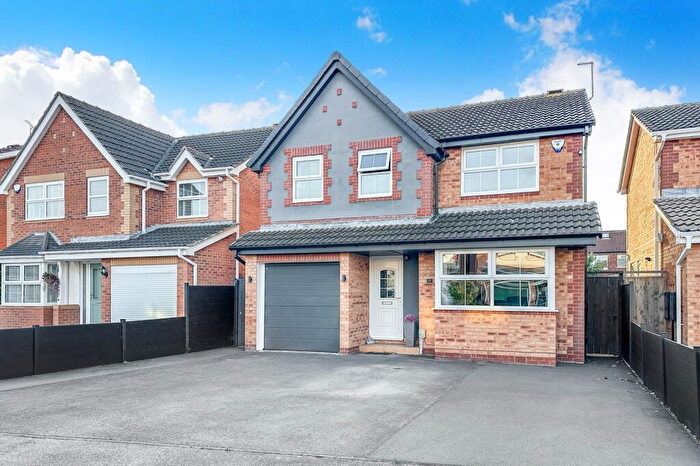
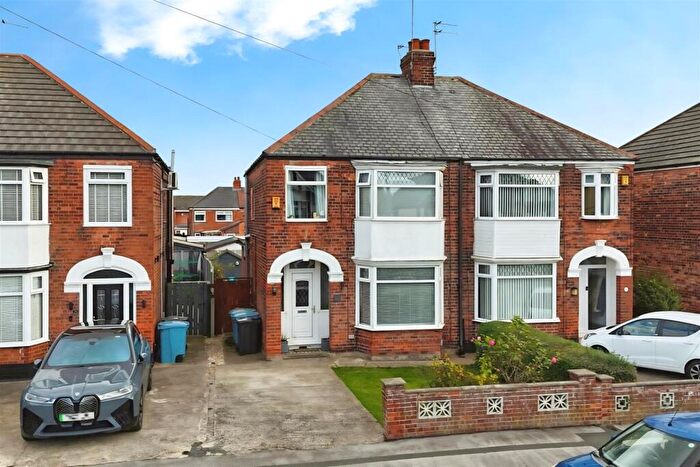
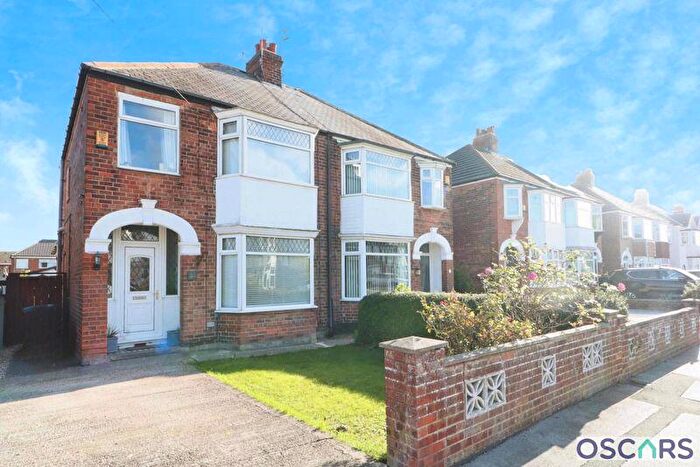
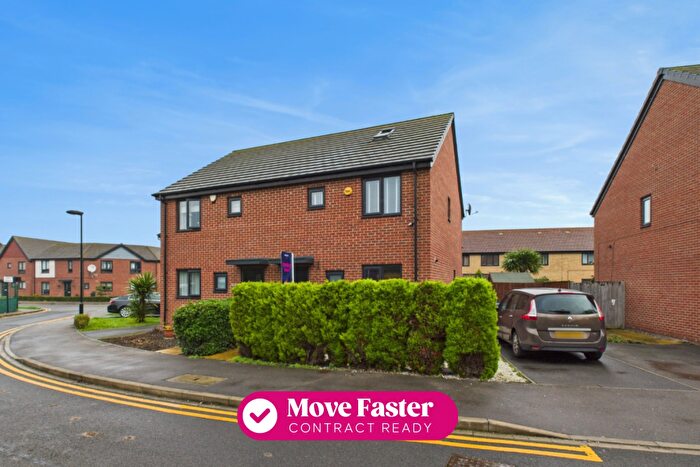
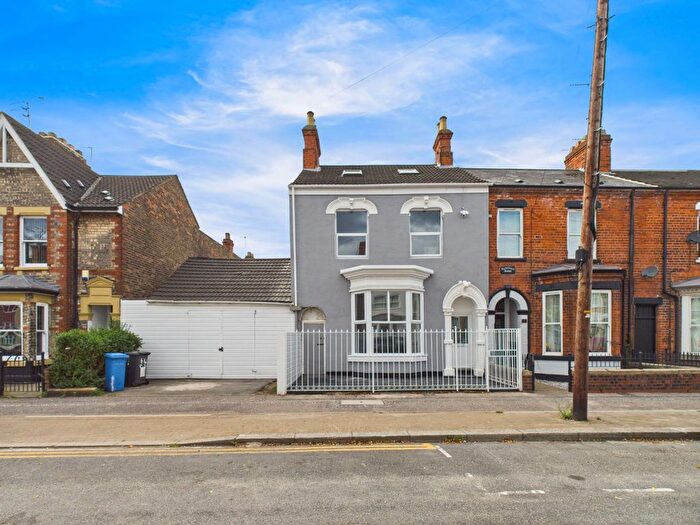
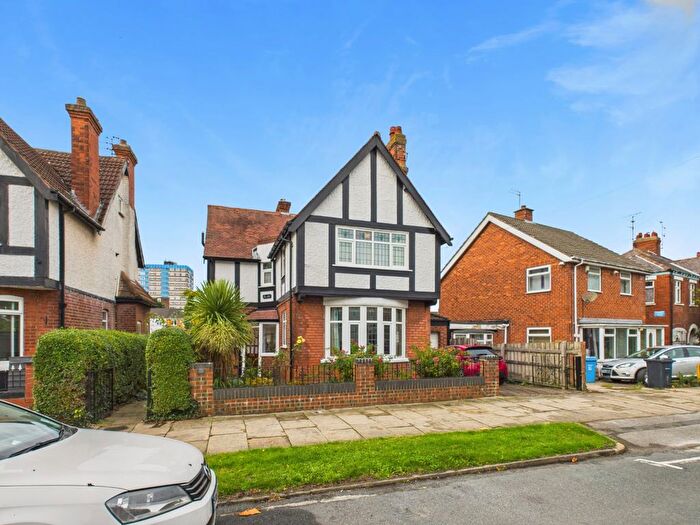
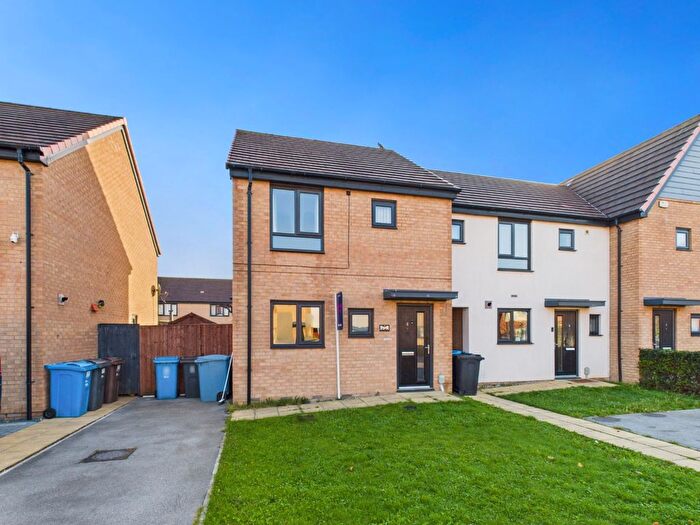
Houses for sale & to rent in Newington & Gipsyville, Hull
House Prices in Newington & Gipsyville
Properties in Newington & Gipsyville have an average house price of £167,515.00 and had 105 Property Transactions within the last 3 years¹.
Newington & Gipsyville is an area in Hull, City of Kingston upon Hull with 216 households², where the most expensive property was sold for £247,000.00.
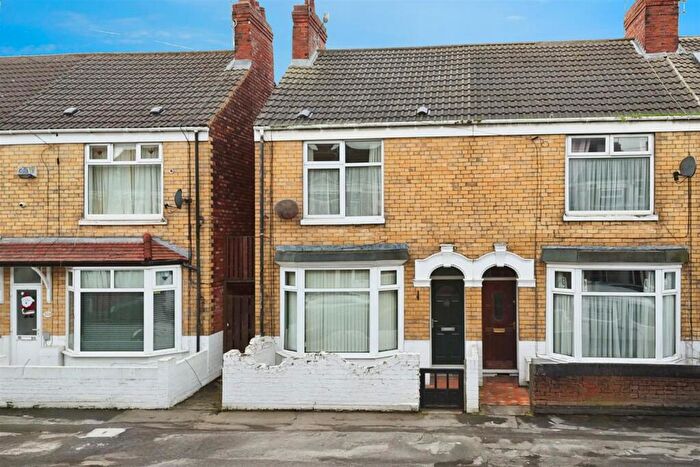
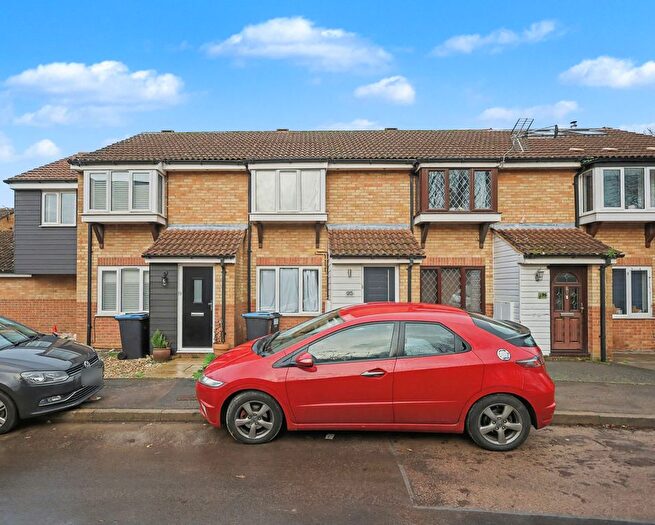
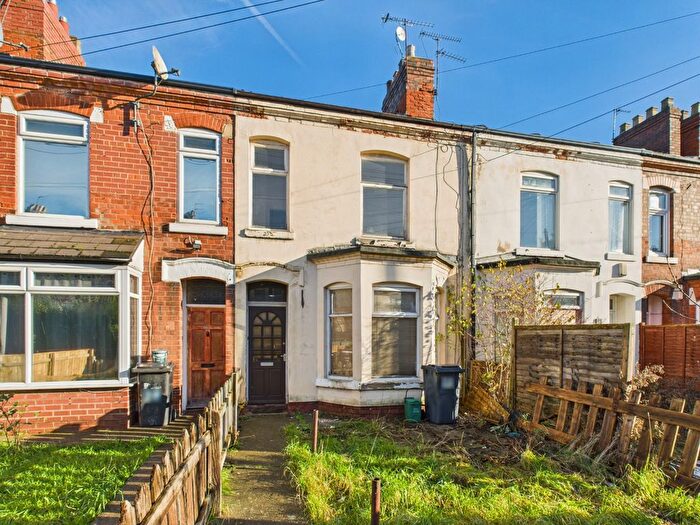
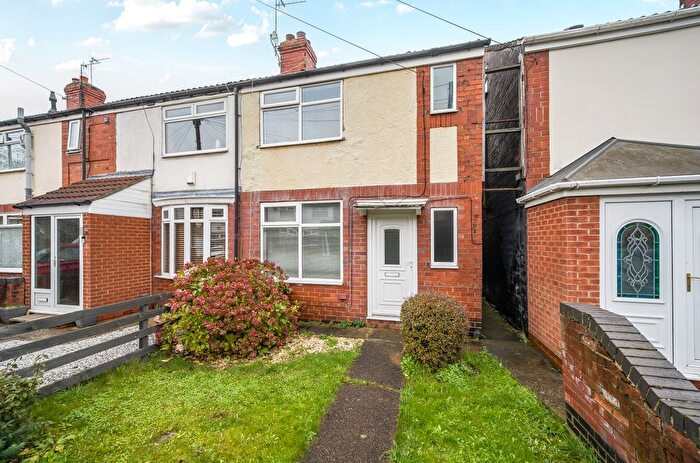
Properties for sale in Newington & Gipsyville
Roads and Postcodes in Newington & Gipsyville
Navigate through our locations to find the location of your next house in Newington & Gipsyville, Hull for sale or to rent.
| Streets | Postcodes |
|---|---|
| Anlaby Road | HU3 6AS HU3 6HU HU3 6PB HU3 6SQ |
| Athens Close | HU3 5QF |
| Boothferry Road | HU3 6UB |
| Bradgate Lane | HU3 5QU |
| Brindle Road | HU3 5BY HU3 5BZ |
| Buxworth Close | HU3 5DZ |
| Carlton Street | HU3 5JL |
| Cecil Street | HU3 5SB |
| Chesterton Street | HU3 5BJ HU3 5QL |
| College Gardens | HU3 6AF HU3 6DS |
| Coppice View | HU3 6AE |
| Council Avenue | HU4 6RF |
| David Whitfield Close | HU3 5LA |
| East Grove | HU4 6NF |
| Eastbourne Street | HU3 5EJ |
| Edensand Road | HU3 5EG |
| Flemish Crescent | HU3 5BN |
| Fletton Avenue | HU3 5ED |
| Freightliner Road | HU3 4UN HU3 4UR HU3 4UW HU3 4XA HU3 4XL HU3 4XR HU3 4AP |
| Greek Street | HU3 6DD |
| Hawthorn Avenue | HU3 5GL HU3 5JF HU3 5SA |
| Hessle Road | HU3 5JA HU4 6RU HU4 6RY |
| Horseshoe Park | HU3 5FX |
| Kiln Avenue | HU3 5BX |
| Kiplington Close | HU3 6NP |
| Lees Walk | HU3 6NE |
| Longden Street | HU3 6NN |
| Marl Park | HU3 5BW |
| Newington Park | HU3 5ND |
| North Road | HU4 6JT HU4 6LQ |
| Olive Lane | HU3 6DX |
| Olivier Court | HU4 6RW |
| Paisley Street | HU3 6NJ |
| Park View | HU4 6NG |
| Parkfield Drive | HU3 6DR |
| Pickering Crescent | HU4 6RZ |
| Rhodes Street | HU3 5RE |
| Salvesen Way | HU3 4UQ HU3 4XN HU3 4XQ |
| Sledmere Grove | HU4 6LF |
| St Bede Court | HU4 6GA |
| Stable Walk | HU3 6AD |
| Stainton Walk | HU3 5EH |
| Tendley Avenue | HU3 5EB |
| The Jacobs Homes | HU4 6NW |
| Unit Factory Estate | HU3 5JB |
| Walton Street | HU3 6GA HU3 6JB |
| Wheeler Street | HU3 5AZ HU3 5QE |
| Wiltshire Road | HU4 6PA HU4 6PD HU4 6QQ |
| Woldcarr Road | HU3 6AU |
| Wykeland Industrial Estate | HU4 6PH |
Transport near Newington & Gipsyville
- FAQ
- Price Paid By Year
- Property Type Price
Frequently asked questions about Newington & Gipsyville
What is the average price for a property for sale in Newington & Gipsyville?
The average price for a property for sale in Newington & Gipsyville is £167,515. This amount is 25% higher than the average price in Hull. There are 1,985 property listings for sale in Newington & Gipsyville.
What streets have the most expensive properties for sale in Newington & Gipsyville?
The streets with the most expensive properties for sale in Newington & Gipsyville are Fletton Avenue at an average of £185,925, Stainton Walk at an average of £185,000 and Coppice View at an average of £184,588.
What streets have the most affordable properties for sale in Newington & Gipsyville?
The streets with the most affordable properties for sale in Newington & Gipsyville are Anlaby Road at an average of £83,000, Stable Walk at an average of £150,437 and Edensand Road at an average of £158,571.
Which train stations are available in or near Newington & Gipsyville?
Some of the train stations available in or near Newington & Gipsyville are Hull, New Holland and Hessle.
Property Price Paid in Newington & Gipsyville by Year
The average sold property price by year was:
| Year | Average Sold Price | Price Change |
Sold Properties
|
|---|---|---|---|
| 2025 | £157,860 | -8% |
18 Properties |
| 2024 | £170,577 | -4% |
25 Properties |
| 2023 | £177,033 | 7% |
24 Properties |
| 2022 | £164,063 | 2% |
38 Properties |
| 2021 | £160,587 | 14% |
17 Properties |
| 2020 | £137,411 | -1% |
12 Properties |
| 2019 | £138,746 | -4% |
47 Properties |
| 2018 | £144,988 | 8% |
75 Properties |
| 2017 | £133,965 | -8% |
81 Properties |
| 2016 | £144,320 | 3% |
89 Properties |
| 2015 | £139,826 | -8% |
60 Properties |
| 2014 | £151,610 | 59% |
13 Properties |
| 2012 | £62,000 | 9% |
1 Property |
| 2011 | £56,125 | 7% |
4 Properties |
| 2010 | £52,250 | 4% |
4 Properties |
| 2009 | £50,142 | -18% |
7 Properties |
| 2008 | £58,983 | -16% |
3 Properties |
| 2007 | £68,493 | 35% |
8 Properties |
| 2006 | £44,599 | 26% |
10 Properties |
| 2005 | £33,216 | 0,1% |
6 Properties |
| 2004 | £33,183 | 33% |
15 Properties |
| 2003 | £22,390 | 15% |
10 Properties |
| 2002 | £19,000 | -9% |
1 Property |
| 2001 | £20,750 | 13% |
8 Properties |
| 1997 | £18,050 | -27% |
3 Properties |
| 1996 | £22,995 | 4% |
1 Property |
| 1995 | £22,000 | - |
5 Properties |
Property Price per Property Type in Newington & Gipsyville
Here you can find historic sold price data in order to help with your property search.
The average Property Paid Price for specific property types in the last three years are:
| Property Type | Average Sold Price | Sold Properties |
|---|---|---|
| Semi Detached House | £170,733.00 | 51 Semi Detached Houses |
| Detached House | £195,028.00 | 10 Detached Houses |
| Terraced House | £159,629.00 | 42 Terraced Houses |
| Flat | £113,497.00 | 2 Flats |

