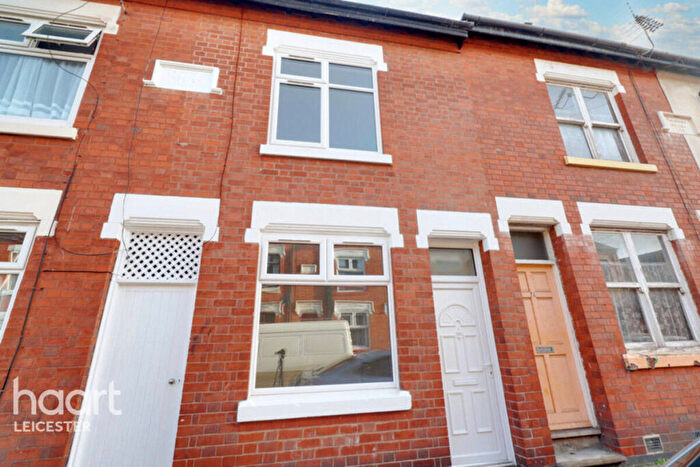
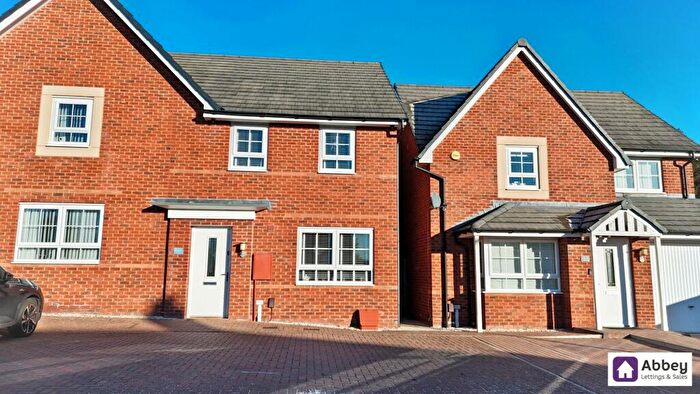
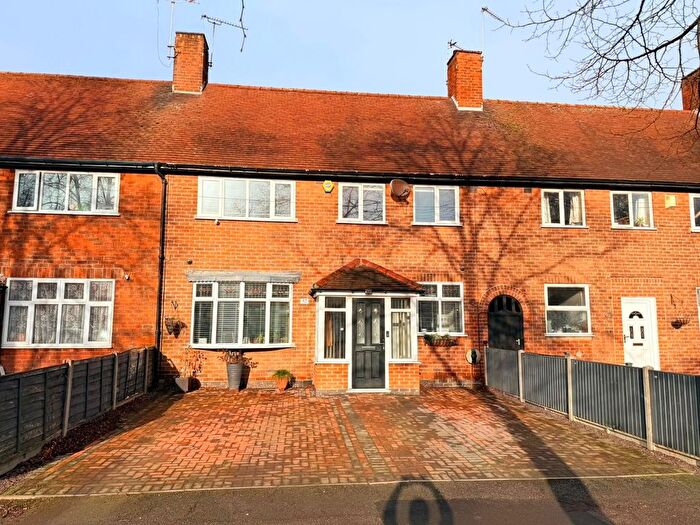
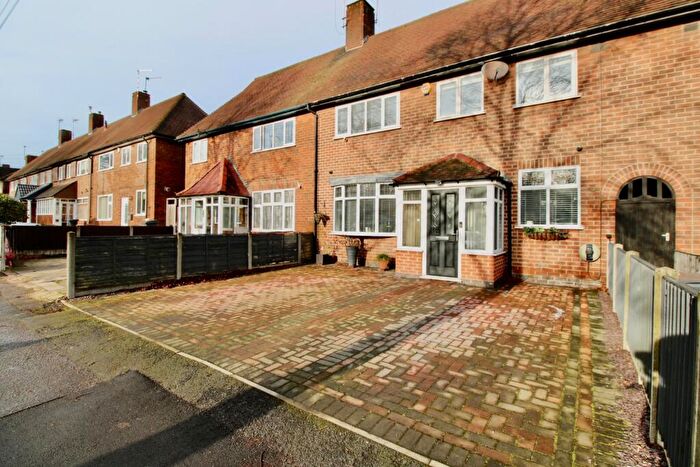
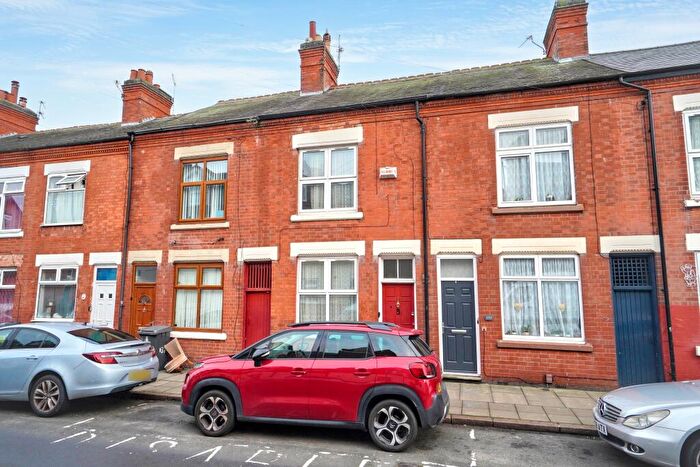
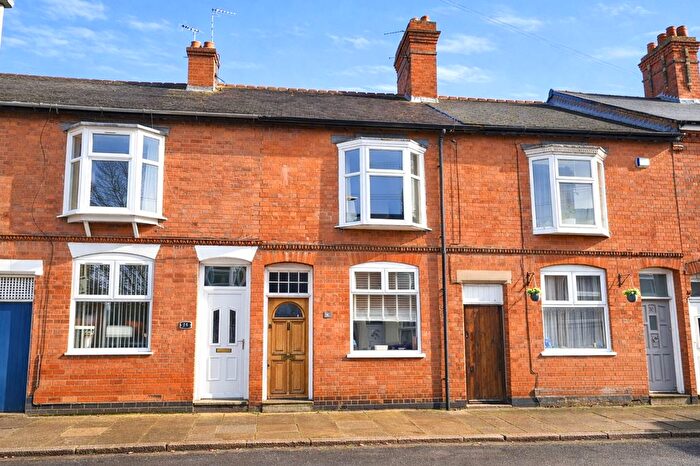
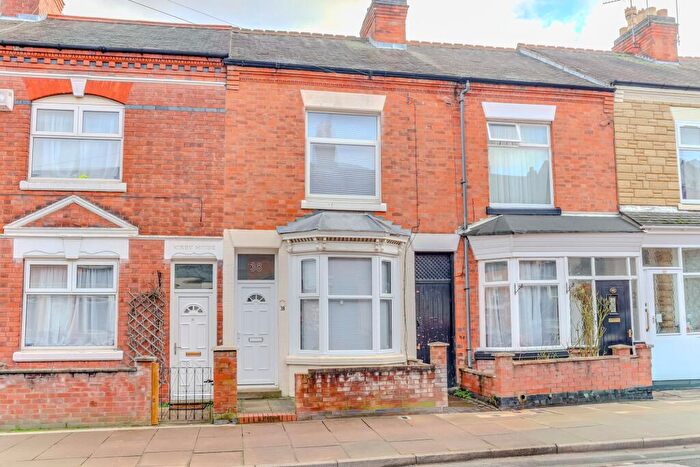
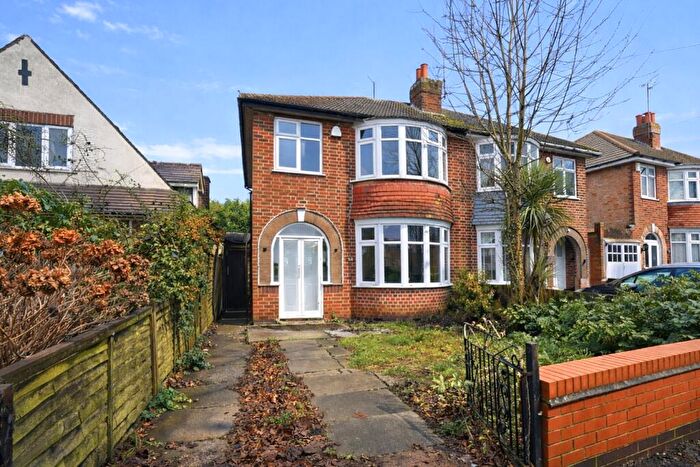
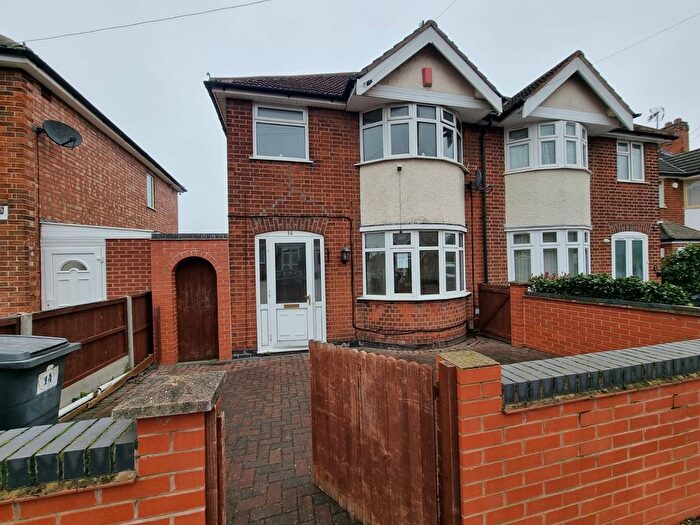
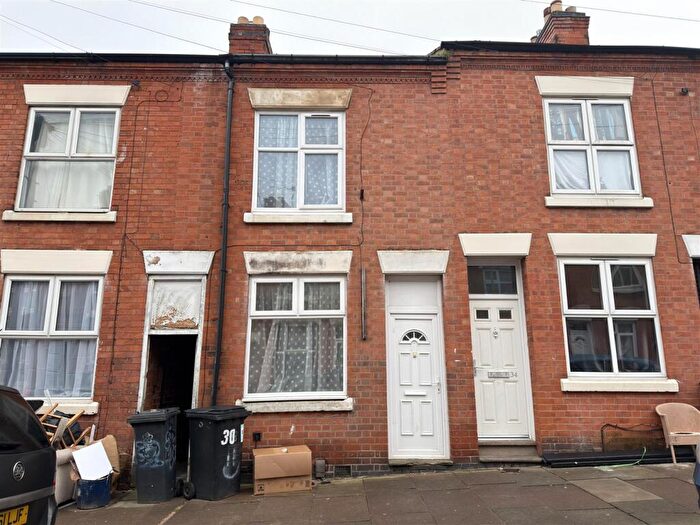
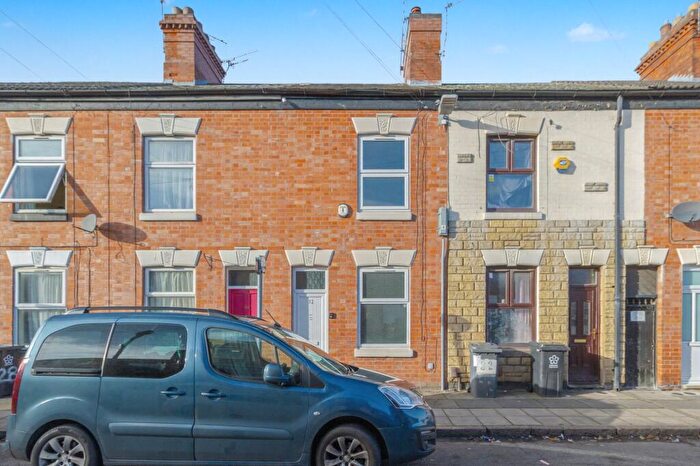
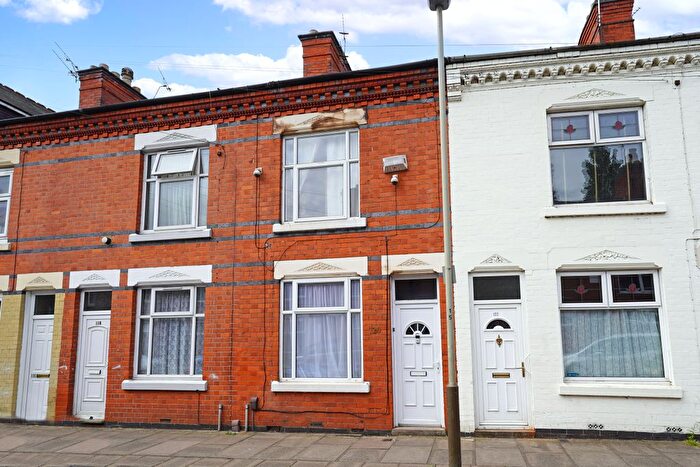
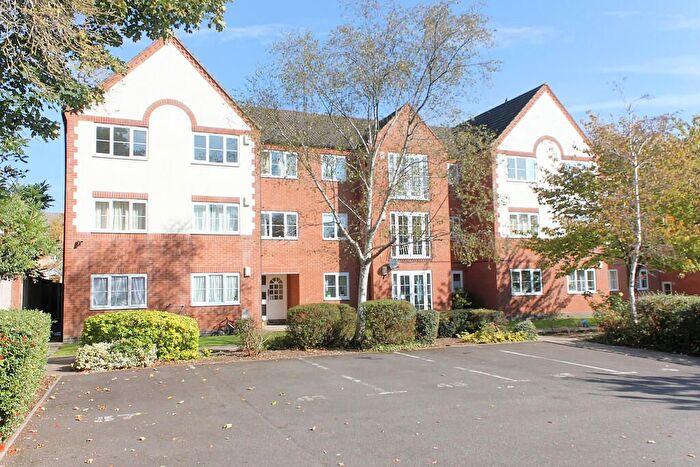
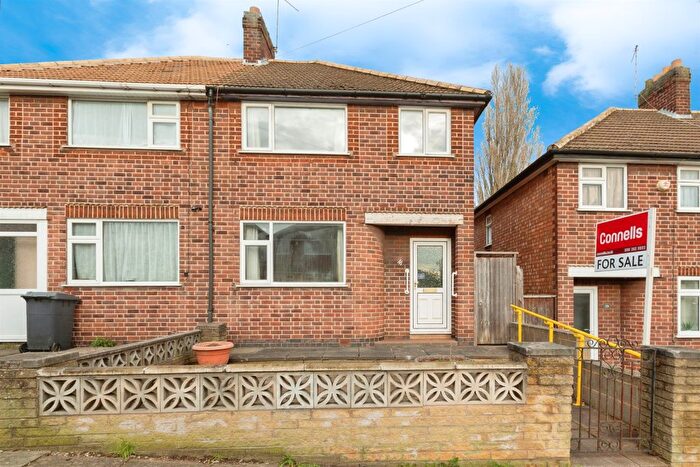
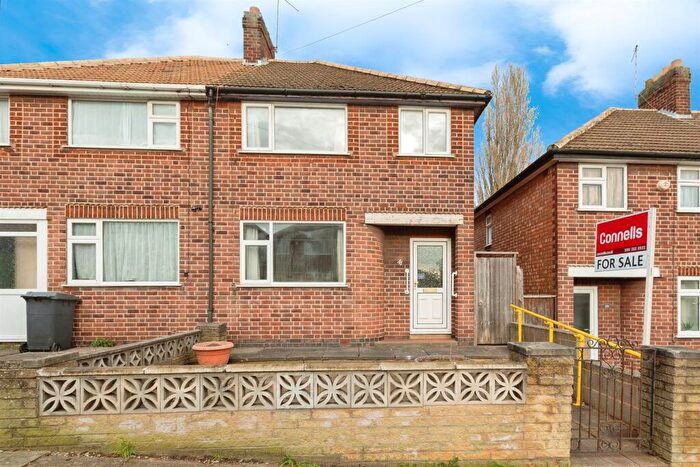
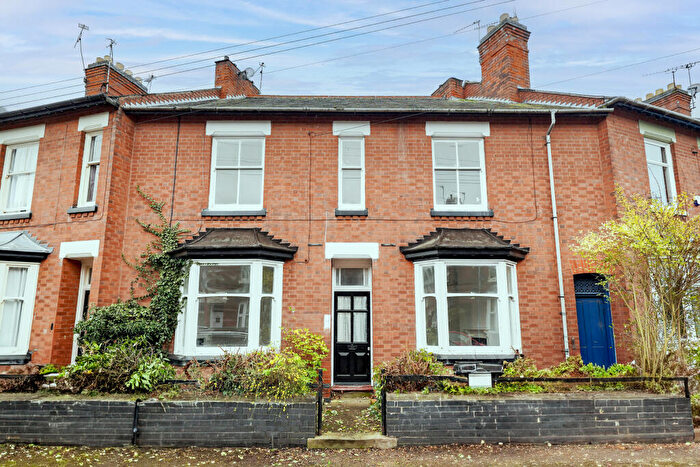
Houses for sale & to rent in Fosse, Leicester
House Prices in Fosse
Properties in Fosse have an average house price of £194,809.00 and had 673 Property Transactions within the last 3 years¹.
Fosse is an area in Leicester, City of Leicester with 5,563 households², where the most expensive property was sold for £425,000.00.
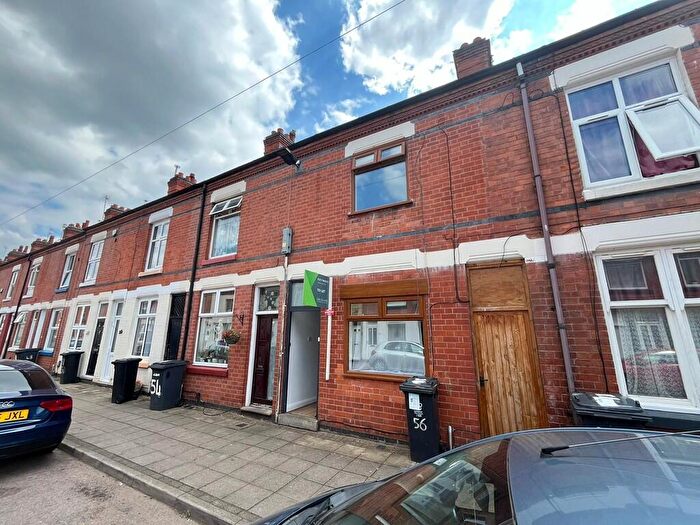
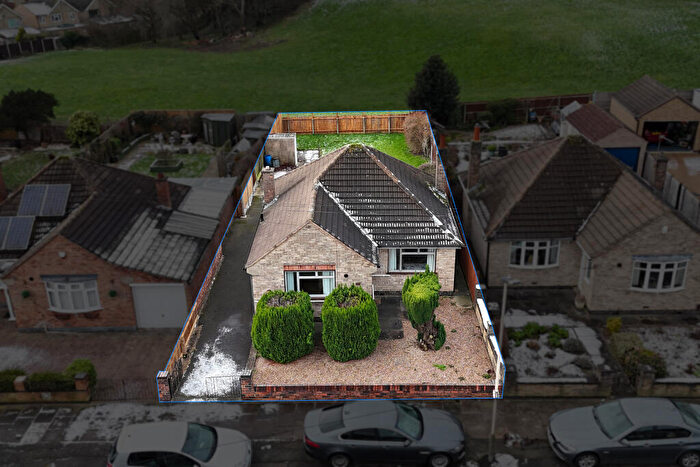
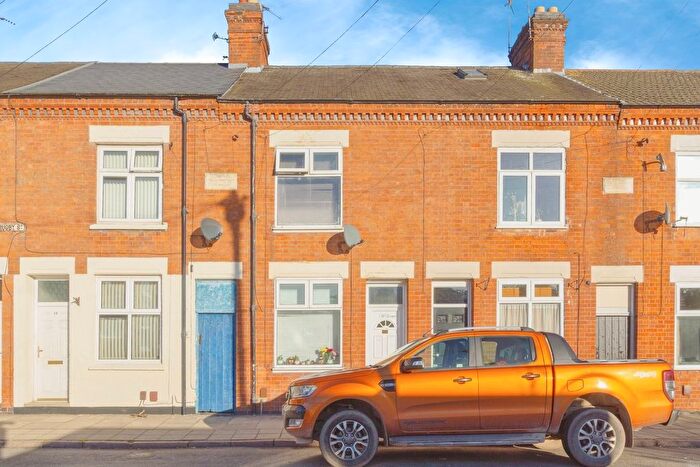
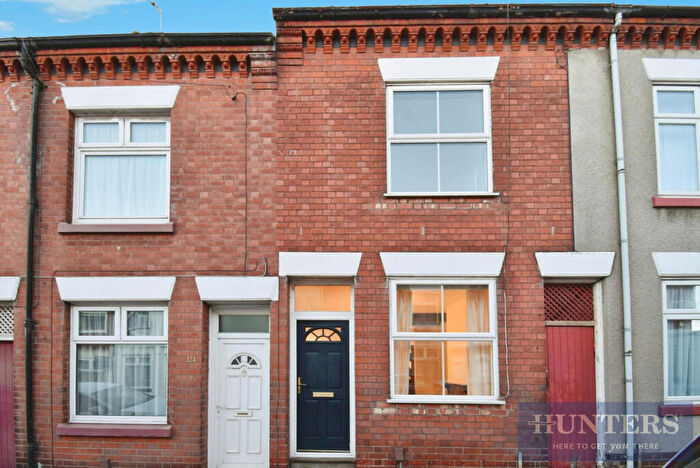
Properties for sale in Fosse
Roads and Postcodes in Fosse
Navigate through our locations to find the location of your next house in Fosse, Leicester for sale or to rent.
| Streets | Postcodes |
|---|---|
| Abbey Gate | LE4 0AA LE4 0AB |
| Alma Street | LE3 9FA LE3 9FB |
| Anstey Lane | LE4 0FA LE4 0FB LE4 0FD LE4 0FE LE4 0FF LE4 0FG LE4 0FH LE4 0FJ |
| Anthony Road | LE4 0HA |
| Avebury Avenue | LE4 0FN LE4 0FP LE4 0FQ LE4 0HB LE4 0HD LE4 0HE LE4 0HF |
| Axbridge Close | LE4 0FR |
| Balfour Street | LE3 5EA |
| Barton Road | LE3 9BB LE3 9BD |
| Bassett Street | LE3 5EB LE3 5ED |
| Battenberg Road | LE3 5HA LE3 5HB |
| Beatrice Road | LE3 9FD LE3 9FE LE3 9FF LE3 9FG LE3 9FH LE3 9FJ LE3 9FL LE3 9FN |
| Bembridge Close | LE3 9AP |
| Bembridge Road | LE3 9AQ |
| Blackbird Avenue | LE4 0AD |
| Blackbird Road | LE4 0AF LE4 0AH LE4 0AJ LE4 0AL LE4 0FW LE4 0AR LE4 0FS |
| Bonchurch Street | LE3 5EE LE3 5EG LE3 5EP |
| Borlace Street | LE3 5HD |
| Bosworth Street | LE3 5RA LE3 5RB LE3 5RD |
| Bradgate Street | LE4 0AW LE4 0BQ |
| Brading Road | LE3 9BG |
| Bristol Avenue | LE4 0HL |
| Buckminster Road | LE3 9AS LE3 9AT LE3 9AR |
| Butcombe Road | LE4 0FX LE4 0FY |
| Carlisle Street | LE3 6BP |
| Central Road | LE3 5EH LE3 5EJ |
| Clifford Street | LE3 5RF |
| Colwell Road | LE3 9AX |
| Combe Close | LE3 9TJ |
| Courtenay Road | LE3 9TA |
| Culver Road | LE3 9BH |
| Dannett Street | LE3 5RJ LE3 5RH |
| Dannett Walk | LE3 5RG |
| Devonshire Road | LE4 0BF |
| Dunton Street | LE3 5EL LE3 5EN |
| Empire Road | LE3 5HE |
| Englewood Close | LE4 0BU |
| Exmoor Avenue | LE4 0BH LE4 0BJ |
| Felley Way | LE3 9TP |
| Fineshade Avenue | LE3 9TN |
| Flora Street | LE3 5RN |
| Fosse Lane | LE3 9AJ |
| Fosse Road North | LE3 5EQ LE3 5ER LE3 5ES LE3 5ET LE3 5EZ LE3 5RR LE3 5RS LE3 5AJ LE3 5EX |
| Glenbarr Avenue | LE4 0AE |
| Glenfield Road | LE3 6AR |
| Glenfield Road East | LE3 5QW |
| Greenlawn Walk | LE4 0BN |
| Groby Road | LE3 9ED LE3 9EE LE3 9EF |
| Hawthorne Street | LE3 9FQ LE3 9FR |
| Hoby Street | LE3 5HF |
| Ingle Street | LE3 9FS |
| Ivanhoe Street | LE3 9GW LE3 9GX |
| Jean Drive | LE4 0GA LE4 0GB LE4 0GD LE4 0GE LE4 0GF |
| Kate Street | LE3 5RL LE3 5RQ LE3 5RP |
| King Richards Road | LE3 5QG |
| Larchmont Road | LE4 0BE LE4 0BW |
| Littleton Street | LE4 0BP |
| Mantle Road | LE3 5HG |
| Marshall Street | LE3 5FA LE3 5FB |
| Medina Road | LE3 9AY |
| Mendip Avenue | LE4 0GG LE4 0GH |
| Milverton Avenue | LE4 0HX LE4 0HY |
| Minster Crescent | LE4 0JA LE4 0JB |
| Montvale Gardens | LE4 0BL |
| Newport Street | LE3 9FT LE3 9FU |
| Newstead Avenue | LE3 9TB |
| Noble Street | LE3 5RW |
| Nook Street | LE3 9FW |
| Nugent Street | LE3 5HH LE3 5HX |
| Oakwood Road | LE4 0BD |
| Oban Street | LE3 9GA LE3 9GB |
| Paget Road | LE3 5HL LE3 5HN |
| Pool Road | LE3 9GD LE3 9GE LE3 9GF LE3 9GG LE3 9GH LE3 9GJ LE3 9GL |
| Ranton Way | LE3 9TH |
| Ravensbridge Drive | LE4 0BX |
| Repton Street | LE3 5FD |
| Richard Iii Road | LE3 5QT |
| Rivers Street | LE3 5RX |
| Rockley Road | LE4 0GJ |
| Rowan Street | LE3 9GN LE3 9GP |
| Roydene Crescent | LE4 0GL LE4 0GN LE4 0GP LE4 0GQ |
| Ruby Street | LE3 9GR LE3 9GS |
| Rugby Street | LE3 5FF |
| Savernake Road | LE4 0GT LE4 0GU |
| Silbury Road | LE4 0GW |
| Snow Hill | LE4 0GX |
| St Augustine Road | LE3 5QS |
| St Helens Close | LE4 0GR |
| St Helens Drive | LE4 0GS |
| St Margarets Way | LE4 0BT |
| Stephenson Drive | LE3 9AE |
| Stoneleigh Way | LE3 9TD LE3 9TE |
| Storey Street | LE3 5GR |
| Sylvan Street | LE3 9GT LE3 9GU |
| Tetuan Road | LE3 9SG |
| Tewkesbury Street | LE3 5HP LE3 5HQ LE3 5HR |
| Totland Road | LE3 9AL LE3 9AN |
| Tudor Close | LE3 5RU |
| Tudor Road | LE3 5HS LE3 5HT LE3 5HU LE3 5HW LE3 5JF LE3 5JG LE3 5JH LE3 5JJ LE3 5AE LE3 5HY |
| Tyrrell Street | LE3 5SA LE3 5SB |
| Vaughan Street | LE3 5JL LE3 5JN LE3 5JP |
| Vernon Street | LE3 5JQ |
| Warren Street | LE3 5JR |
| Warwick Street | LE3 5SD LE3 5SE LE3 5SF |
| Whitley Close | LE3 9TF |
| Whitwick Way | LE3 9TG |
| Woodgate | LE3 5GE LE3 5GF LE3 5GG LE3 5GH |
| Wroxall Way | LE3 9TL |
| LE3 9AZ |
Transport near Fosse
- FAQ
- Price Paid By Year
- Property Type Price
Frequently asked questions about Fosse
What is the average price for a property for sale in Fosse?
The average price for a property for sale in Fosse is £194,809. This amount is 19% lower than the average price in Leicester. There are 2,455 property listings for sale in Fosse.
What streets have the most expensive properties for sale in Fosse?
The streets with the most expensive properties for sale in Fosse are Axbridge Close at an average of £352,000, St Helens Drive at an average of £315,416 and Glenfield Road East at an average of £300,000.
What streets have the most affordable properties for sale in Fosse?
The streets with the most affordable properties for sale in Fosse are Bradgate Street at an average of £129,285, Montvale Gardens at an average of £139,412 and Clifford Street at an average of £148,300.
Which train stations are available in or near Fosse?
Some of the train stations available in or near Fosse are Leicester, South Wigston and Syston.
Property Price Paid in Fosse by Year
The average sold property price by year was:
| Year | Average Sold Price | Price Change |
Sold Properties
|
|---|---|---|---|
| 2025 | £200,122 | 1% |
131 Properties |
| 2024 | £198,786 | 6% |
175 Properties |
| 2023 | £186,214 | -5% |
172 Properties |
| 2022 | £195,253 | 9% |
195 Properties |
| 2021 | £177,132 | 9% |
227 Properties |
| 2020 | £162,010 | 6% |
165 Properties |
| 2019 | £151,627 | 9% |
171 Properties |
| 2018 | £138,732 | 4% |
231 Properties |
| 2017 | £133,118 | 5% |
211 Properties |
| 2016 | £126,093 | 9% |
188 Properties |
| 2015 | £114,257 | 3% |
236 Properties |
| 2014 | £110,596 | 3% |
219 Properties |
| 2013 | £107,743 | 3% |
132 Properties |
| 2012 | £104,948 | 3% |
120 Properties |
| 2011 | £102,306 | -4% |
131 Properties |
| 2010 | £106,668 | 4% |
118 Properties |
| 2009 | £102,224 | -19% |
106 Properties |
| 2008 | £121,910 | 1% |
162 Properties |
| 2007 | £120,568 | 5% |
318 Properties |
| 2006 | £114,587 | -0,2% |
393 Properties |
| 2005 | £114,815 | -1% |
332 Properties |
| 2004 | £115,873 | 18% |
392 Properties |
| 2003 | £95,178 | 29% |
542 Properties |
| 2002 | £67,647 | 28% |
394 Properties |
| 2001 | £48,720 | 16% |
398 Properties |
| 2000 | £40,833 | 7% |
346 Properties |
| 1999 | £38,097 | 5% |
303 Properties |
| 1998 | £36,371 | 4% |
248 Properties |
| 1997 | £34,759 | 2% |
223 Properties |
| 1996 | £33,978 | 1% |
262 Properties |
| 1995 | £33,712 | - |
222 Properties |
Property Price per Property Type in Fosse
Here you can find historic sold price data in order to help with your property search.
The average Property Paid Price for specific property types in the last three years are:
| Property Type | Average Sold Price | Sold Properties |
|---|---|---|
| Flat | £126,578.00 | 53 Flats |
| Semi Detached House | £247,049.00 | 161 Semi Detached Houses |
| Detached House | £285,987.00 | 35 Detached Houses |
| Terraced House | £175,976.00 | 424 Terraced Houses |

