
Houses for sale & to rent in City of Leicester, England
House Prices in City of Leicester
Properties in City of Leicester have
an average house price of
£243k
and had 7,845 Property Transactions
within the last 3 years.¹
City of Leicester is a location in
England with
116,796 households², where the most expensive property was sold for £1.75M.
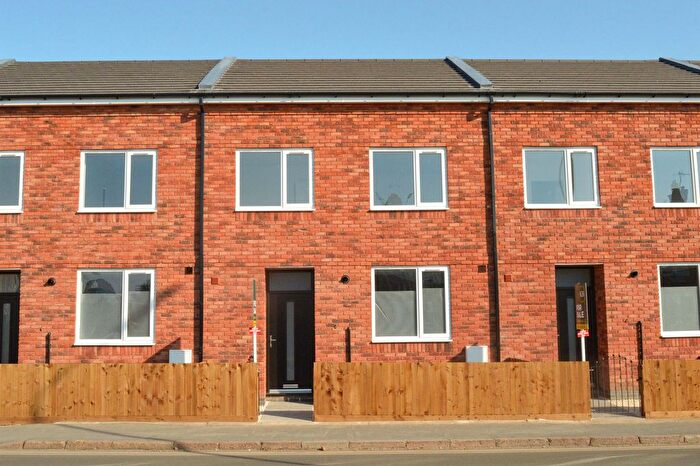
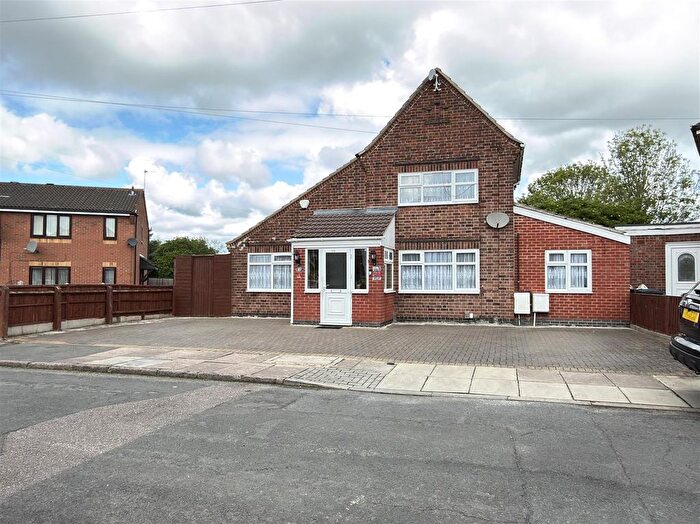
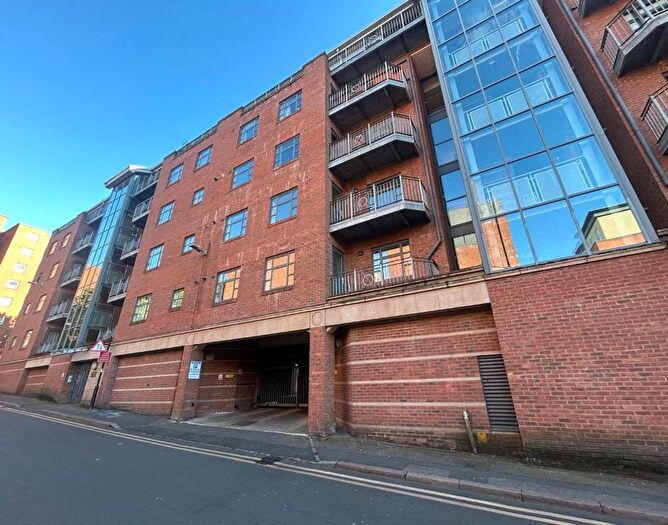
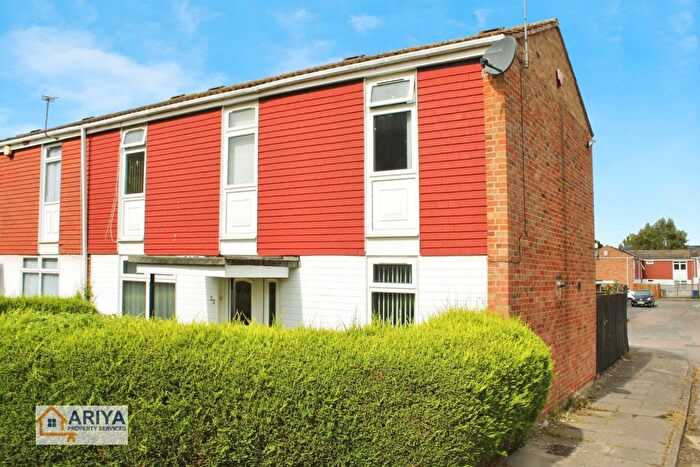
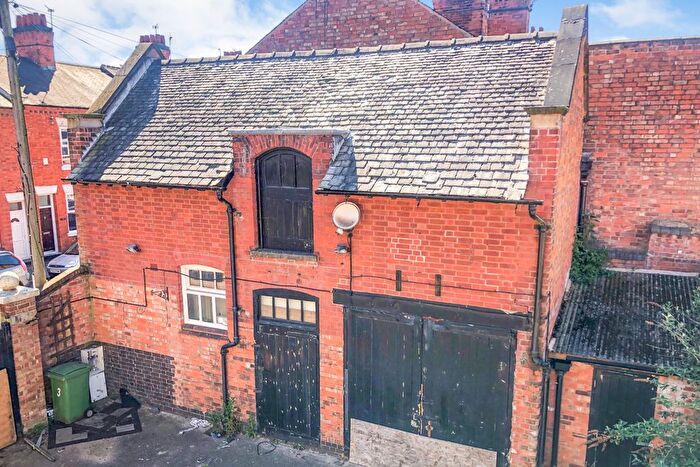
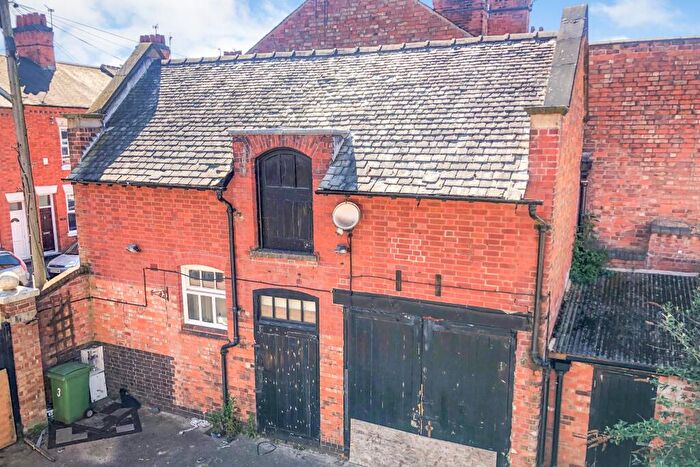
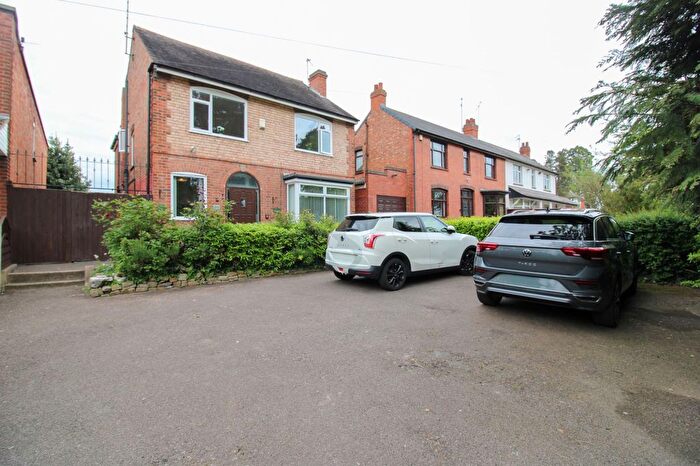
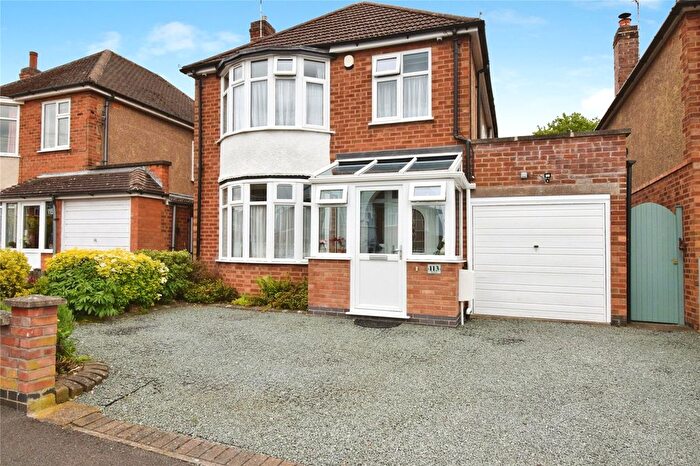
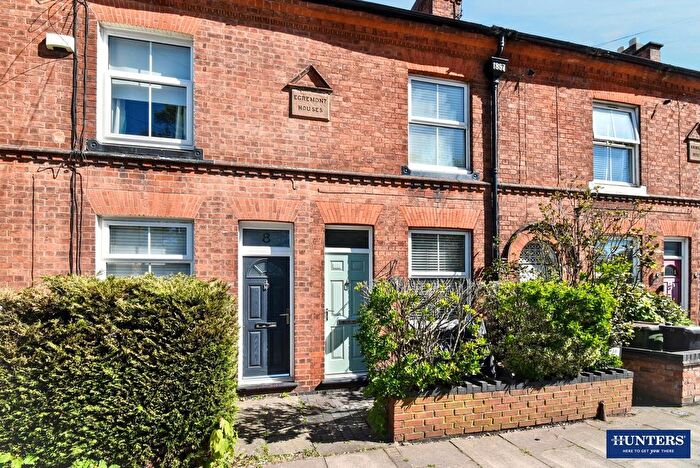
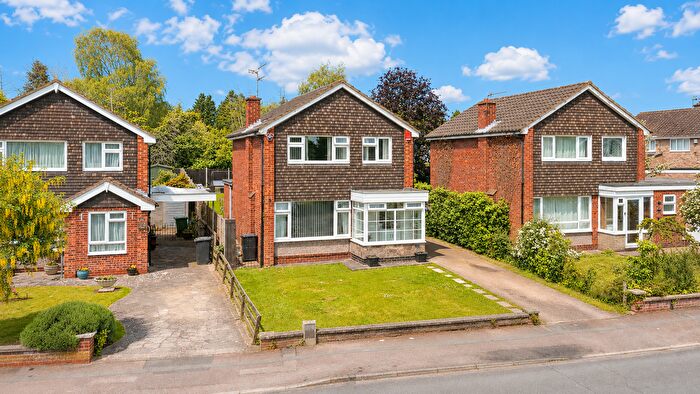
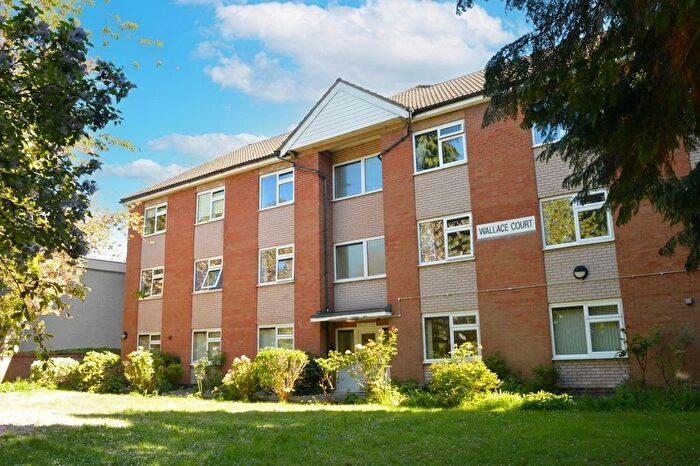
Properties for sale in City of Leicester
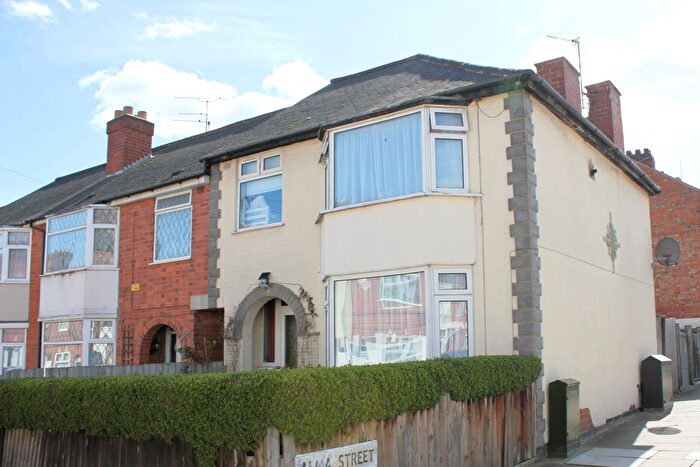
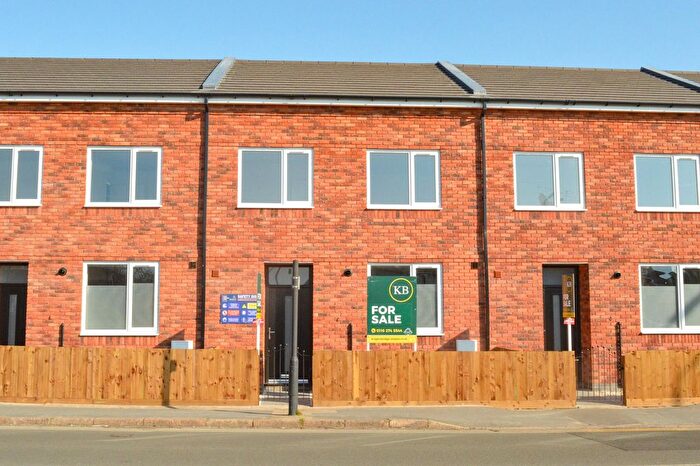
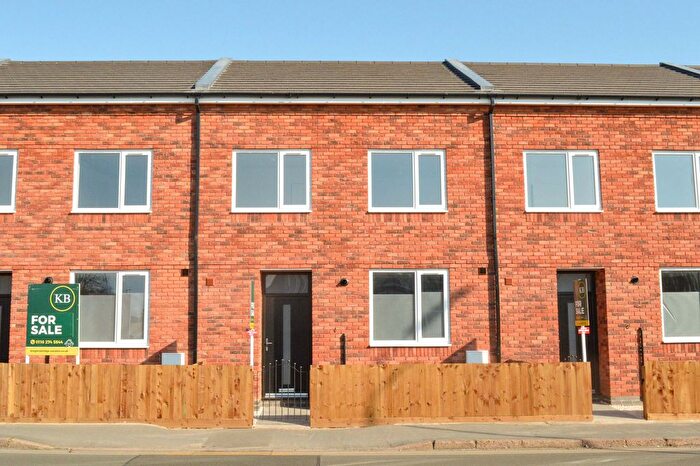
![]()
If you are looking to sell your house, let it out, or receive a property valuation, an expert can help you.
Click the button below to get started.

Towns in City of Leicester
Navigate through our locations to find the location of your next house in City of Leicester, England for sale or to rent.
Transport in City of Leicester
Please see below transportation links in this area:

- FAQ
- Price Paid By Year
- Property Type Price
Frequently asked questions about City of Leicester
What is the average price for a property for sale in City of Leicester?
The average price for a property for sale in City of Leicester is £242,593. This amount is 32% lower than the average price in England. There are more than 10,000 property listings for sale in City of Leicester.
Which train stations are available in or near City of Leicester?
Some of the train stations available in or near City of Leicester are Leicester, South Wigston and Syston.
Property Price Paid in City of Leicester by Year
The average sold property price by year was:
| Year | Average Sold Price | Price Change |
Sold Properties
|
|---|---|---|---|
| 2026 | £245,011 | -0,1% |
192 Properties |
| 2025 | £245,258 | 1% |
2,503 Properties |
| 2024 | £242,103 | 1% |
2,638 Properties |
| 2023 | £240,269 | 1% |
2,512 Properties |
| 2022 | £238,926 | 6% |
3,190 Properties |
| 2021 | £224,419 | 9% |
3,721 Properties |
| 2020 | £204,692 | 7% |
2,577 Properties |
| 2019 | £190,744 | -3% |
3,374 Properties |
| 2018 | £195,973 | 10% |
3,682 Properties |
| 2017 | £175,685 | 7% |
3,715 Properties |
| 2016 | £163,229 | 8% |
3,854 Properties |
| 2015 | £150,542 | 4% |
3,696 Properties |
| 2014 | £143,868 | 4% |
3,713 Properties |
| 2013 | £138,200 | 1% |
2,664 Properties |
| 2012 | £137,334 | -1% |
2,367 Properties |
| 2011 | £138,968 | 1% |
2,550 Properties |
| 2010 | £138,126 | 1% |
2,860 Properties |
| 2009 | £137,050 | -5% |
2,469 Properties |
| 2008 | £144,537 | -0,3% |
2,814 Properties |
| 2007 | £144,974 | 6% |
5,596 Properties |
| 2006 | £136,365 | 3% |
5,819 Properties |
| 2005 | £132,584 | 4% |
4,580 Properties |
| 2004 | £126,716 | 17% |
5,609 Properties |
| 2003 | £105,439 | 21% |
6,094 Properties |
| 2002 | £83,679 | 22% |
5,949 Properties |
| 2001 | £65,113 | 12% |
5,572 Properties |
| 2000 | £57,326 | 7% |
5,119 Properties |
| 1999 | £53,434 | 8% |
4,742 Properties |
| 1998 | £48,936 | 6% |
3,935 Properties |
| 1997 | £45,927 | 3% |
3,536 Properties |
| 1996 | £44,694 | -2% |
3,538 Properties |
| 1995 | £45,806 | - |
3,523 Properties |
Property Price per Property Type in City of Leicester
Here you can find historic sold price data in order to help with your property search.
The average Property Paid Price for specific property types in the last three years are:
| Property Type | Average Sold Price | Sold Properties |
|---|---|---|
| Semi Detached House | £267,443.00 | 2,655 Semi Detached Houses |
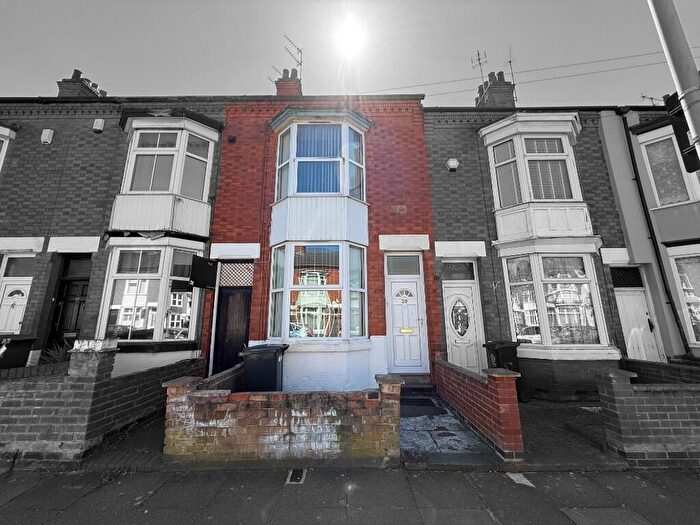
| Terraced House | £217,392.00 | 3,502 Terraced Houses |
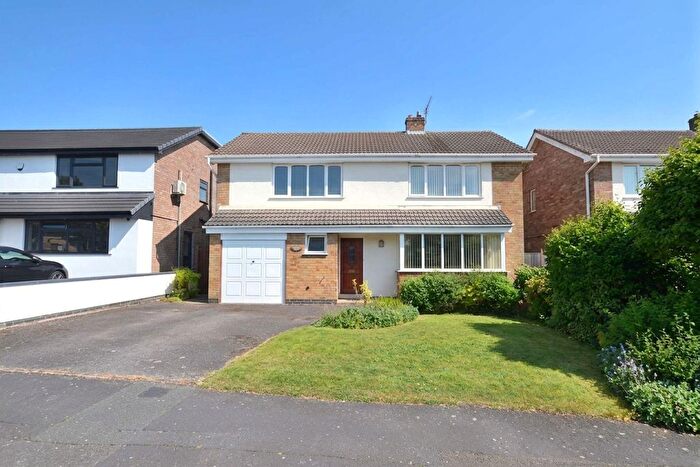
| Detached House | £396,278.00 | 791 Detached Houses |
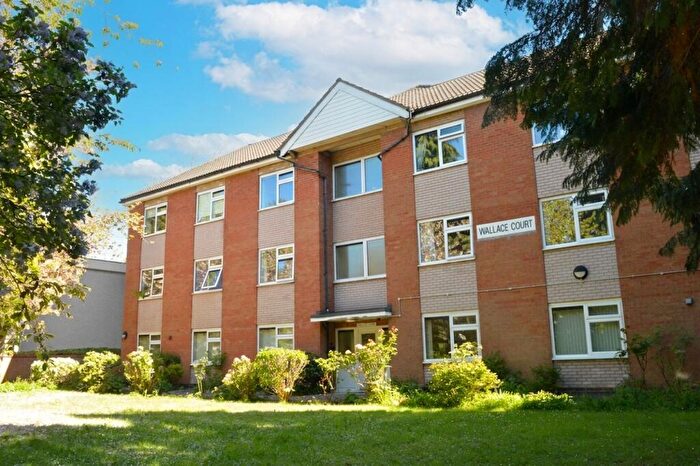
| Flat | £131,910.00 | 897 Flats |