
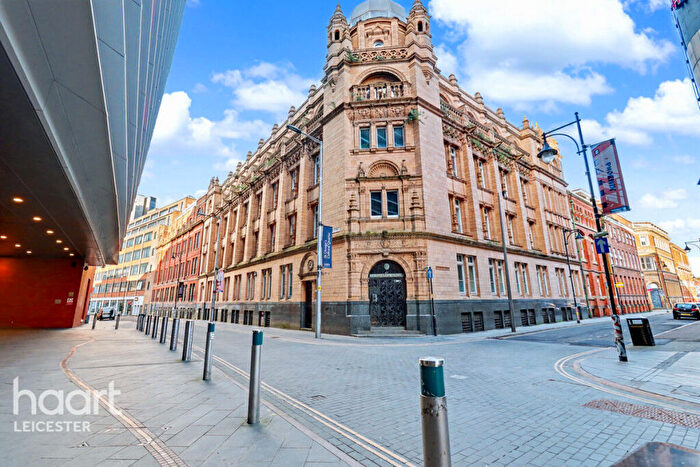
Houses for sale & to rent in Leicester, City of Leicester
House Prices in Leicester
Properties in Leicester have an average house price of £242k and had 7,277 Property Transactions within the last 3 years.¹
Leicester is an area in City of Leicester with 116,796 households², where the most expensive property was sold for £1.75M.
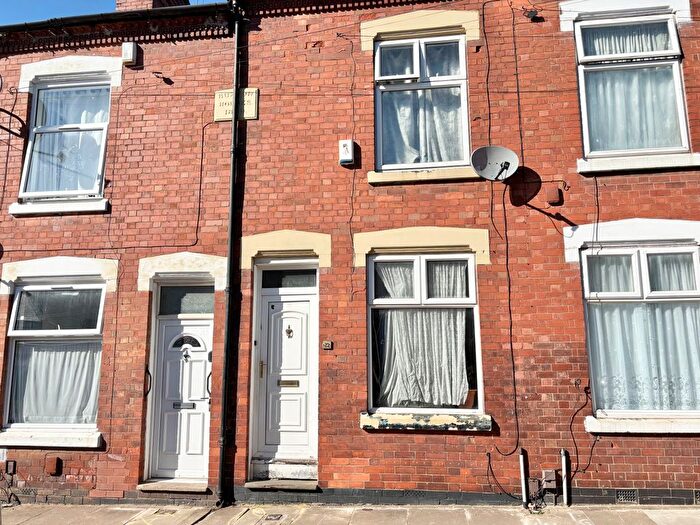
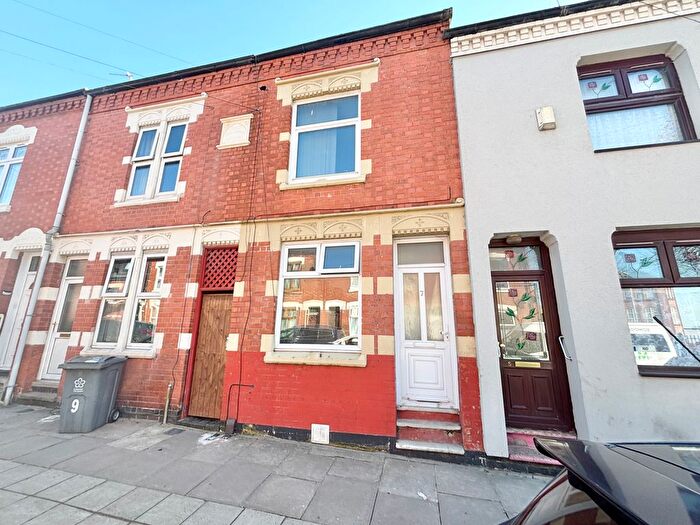
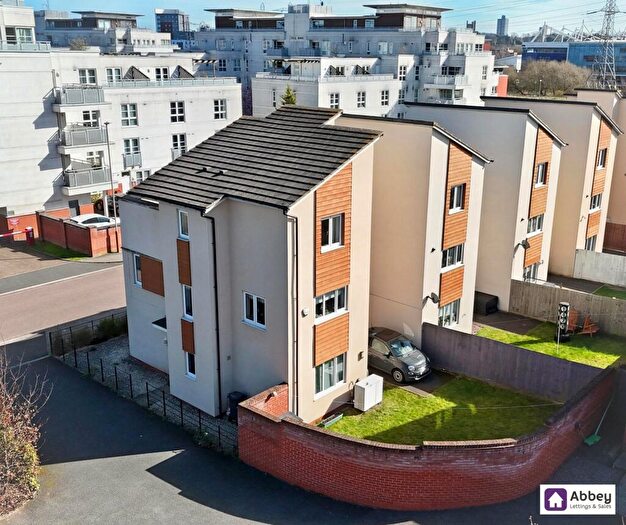
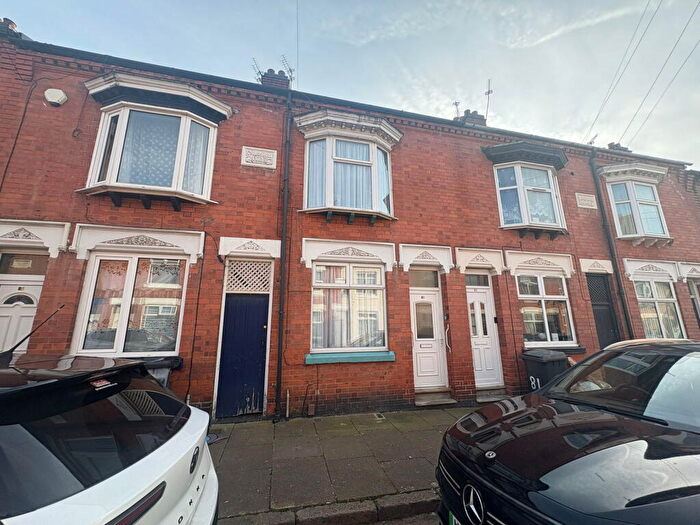
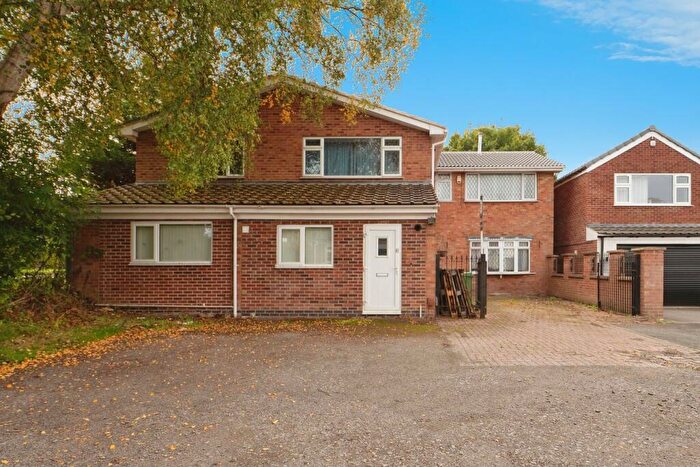
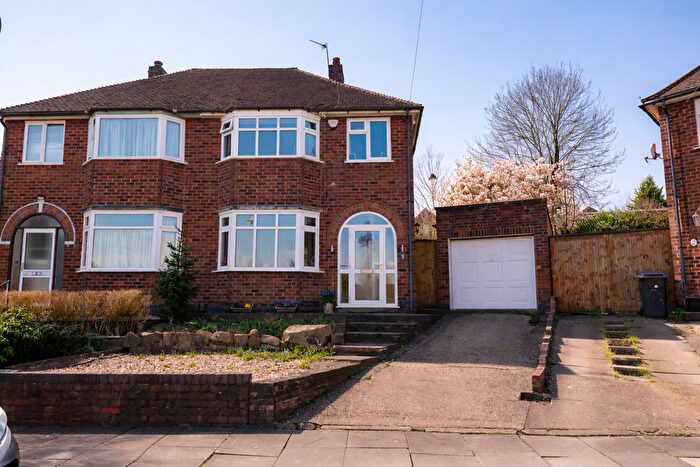
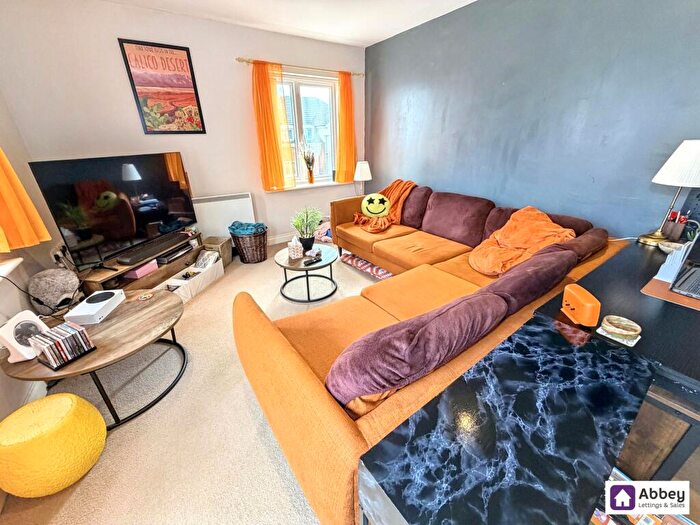
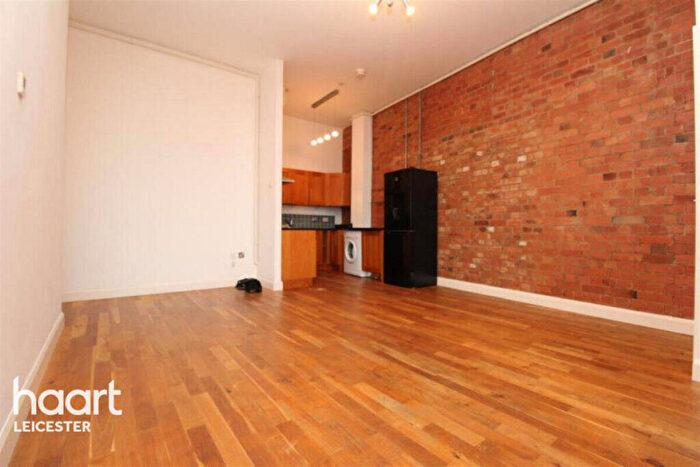
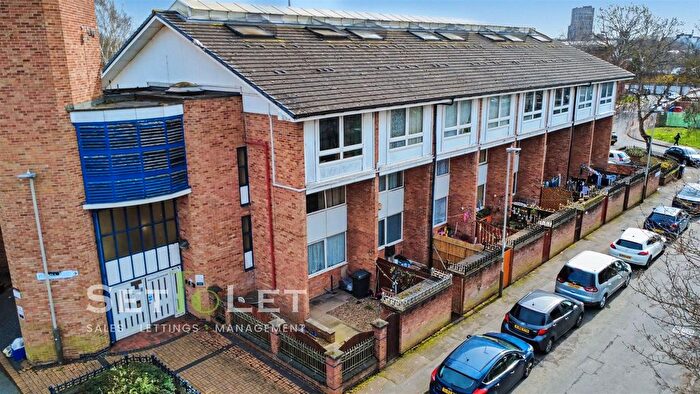
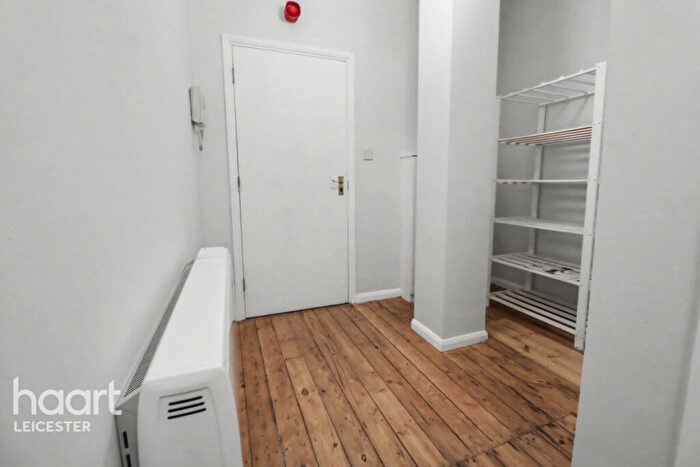
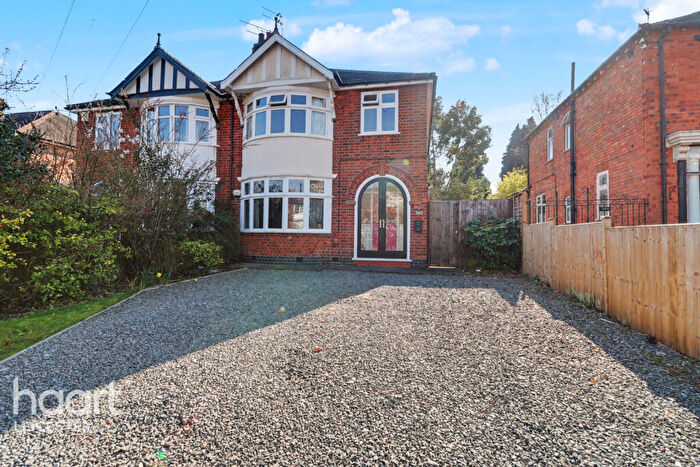
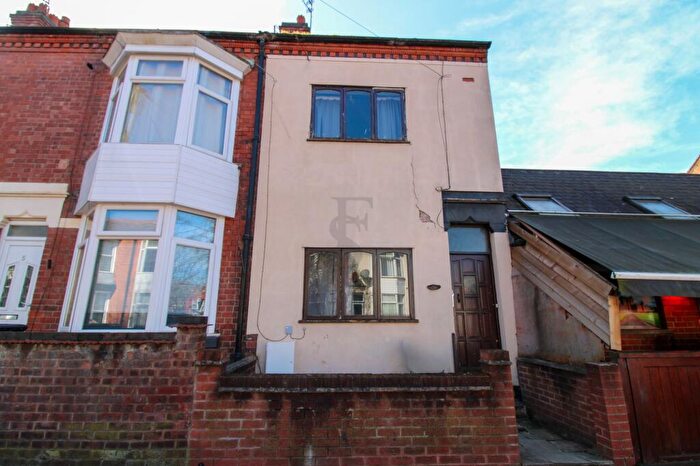
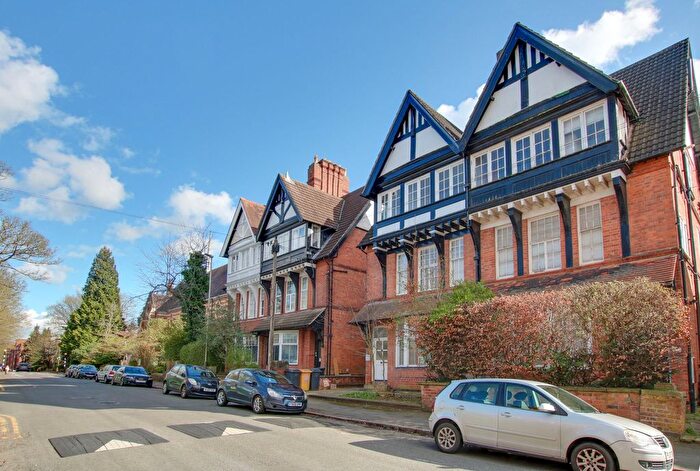
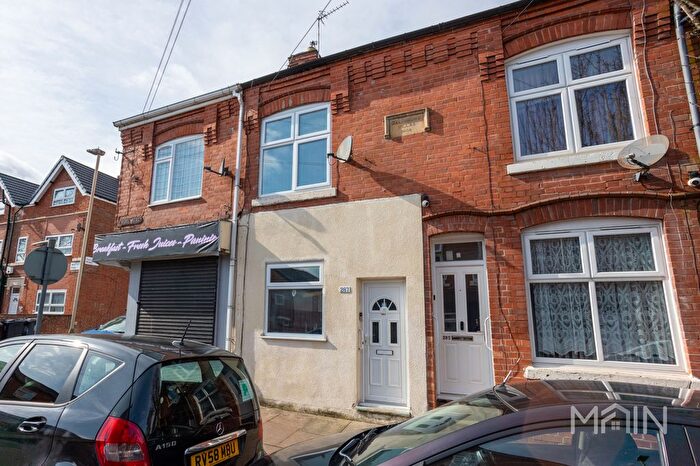
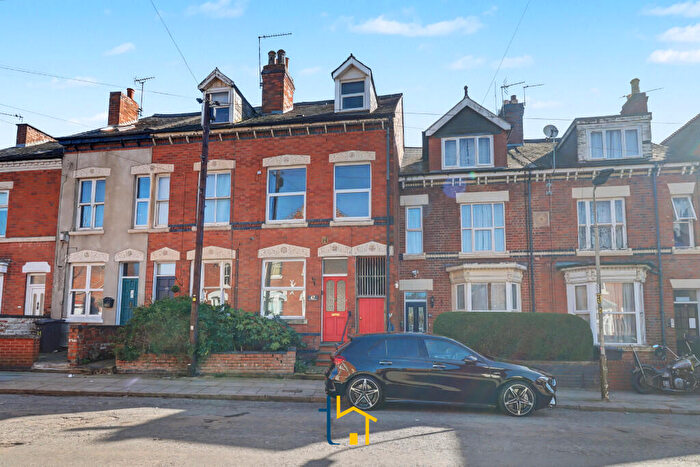
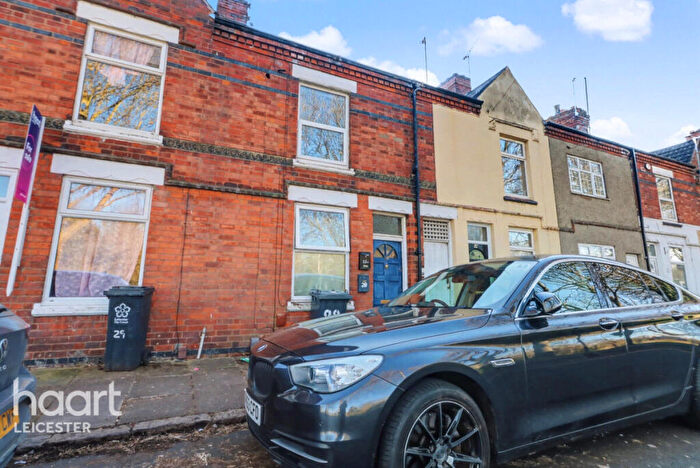
Properties for sale in Leicester
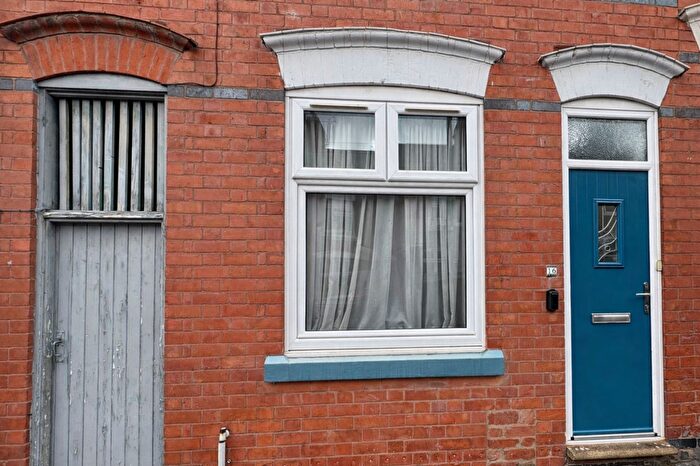

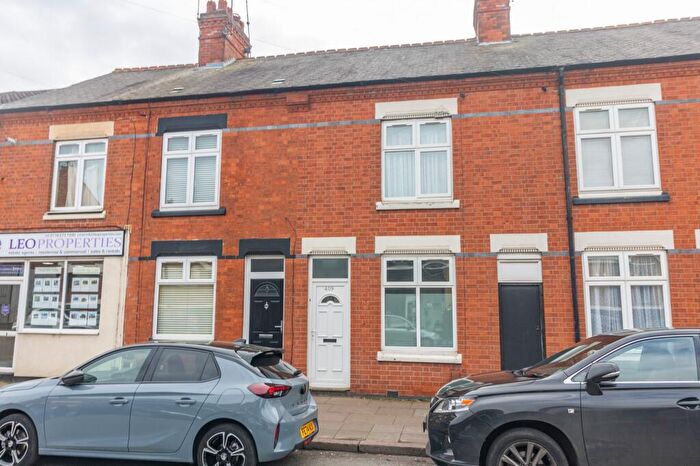
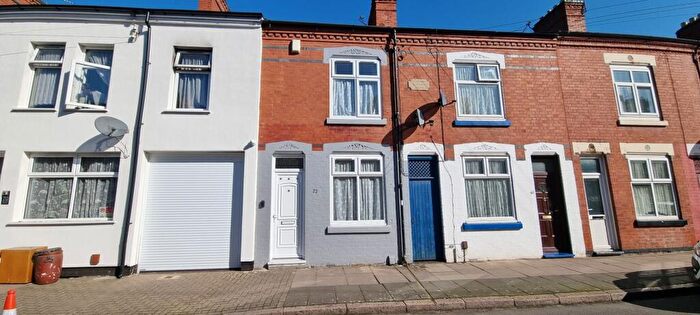
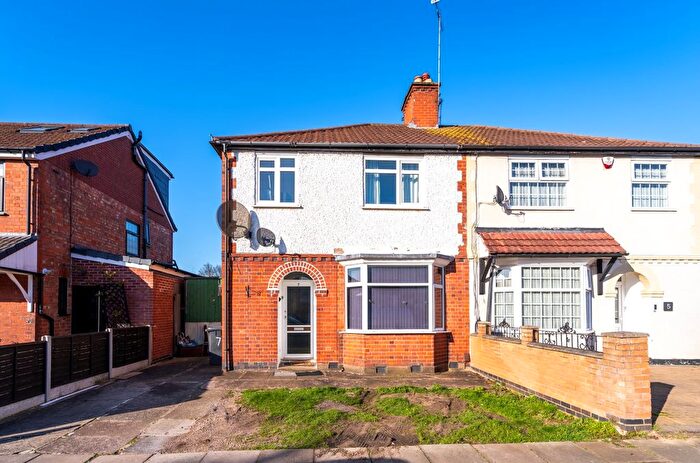
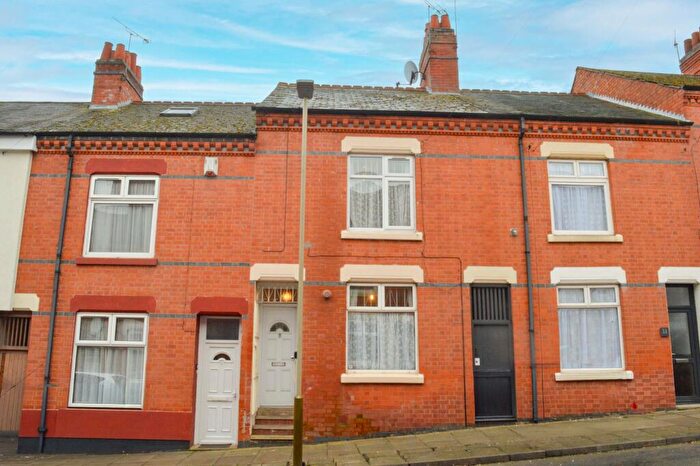
![]()
If you are looking to sell your house, let it out, or receive a property valuation, an expert can help you.
Click the button below to get started.

Neighbourhoods in Leicester
Navigate through our locations to find the location of your next house in Leicester, City of Leicester for sale or to rent.
- Braunstone Park & Rowley Fields
- Abbey
- Aylestone
- Beaumont Leys
- Belgrave
- Braunstone Park And Rowley Fields
- Castle
- Charnwood
- Coleman
- Evington
- Eyres Monsell
- Fosse
- Freemen
- Humberstone And Hamilton
- Knighton
- Latimer
- New Parks
- Rushey Mead
- Spinney Hills
- Stoneygate
- Thurncourt
- Westcotes
- Western Park
- Wycliffe
- Saffron
- North Evington
- Humberstone & Hamilton
- Winstanley
- Queniborough
- Western
- Troon
Transport in Leicester
Please see below transportation links in this area:

- FAQ
- Price Paid By Year
- Property Type Price
Frequently asked questions about Leicester
What is the average price for a property for sale in Leicester?
The average price for a property for sale in Leicester is £242,378. There are more than 10,000 property listings for sale in Leicester.
What locations have the most expensive properties for sale in Leicester?
The locations with the most expensive properties for sale in Leicester are Humberstone & Hamilton at an average of £361,438, Knighton at an average of £354,105 and Evington at an average of £330,252.
What locations have the most affordable properties for sale in Leicester?
The locations with the most affordable properties for sale in Leicester are Wycliffe at an average of £135,250, Westcotes at an average of £176,858 and Freemen at an average of £195,539.
Which train stations are available in or near Leicester?
Some of the train stations available in or near Leicester are Leicester, South Wigston and Syston.
Property Price Paid in Leicester by Year
The average sold property price by year was:
| Year | Average Sold Price | Price Change |
Sold Properties
|
|---|---|---|---|
| 2025 | £245,037 | 1% |
2,138 Properties |
| 2024 | £242,205 | 1% |
2,629 Properties |
| 2023 | £240,294 | 1% |
2,510 Properties |
| 2022 | £238,895 | 6% |
3,189 Properties |
| 2021 | £224,414 | 9% |
3,719 Properties |
| 2020 | £204,623 | 7% |
2,575 Properties |
| 2019 | £190,744 | -3% |
3,374 Properties |
| 2018 | £195,973 | 10% |
3,682 Properties |
| 2017 | £175,685 | 7% |
3,715 Properties |
| 2016 | £163,229 | 8% |
3,854 Properties |
| 2015 | £150,542 | 4% |
3,696 Properties |
| 2014 | £143,868 | 4% |
3,713 Properties |
| 2013 | £138,200 | 1% |
2,664 Properties |
| 2012 | £137,334 | -1% |
2,367 Properties |
| 2011 | £138,968 | 1% |
2,550 Properties |
| 2010 | £138,126 | 1% |
2,860 Properties |
| 2009 | £137,050 | -5% |
2,469 Properties |
| 2008 | £144,537 | -0,3% |
2,814 Properties |
| 2007 | £144,974 | 6% |
5,596 Properties |
| 2006 | £136,359 | 3% |
5,818 Properties |
| 2005 | £132,584 | 4% |
4,580 Properties |
| 2004 | £126,716 | 17% |
5,609 Properties |
| 2003 | £105,439 | 21% |
6,094 Properties |
| 2002 | £83,679 | 22% |
5,949 Properties |
| 2001 | £65,113 | 12% |
5,572 Properties |
| 2000 | £57,326 | 7% |
5,119 Properties |
| 1999 | £53,434 | 8% |
4,742 Properties |
| 1998 | £48,936 | 6% |
3,935 Properties |
| 1997 | £45,927 | 3% |
3,536 Properties |
| 1996 | £44,694 | -2% |
3,538 Properties |
| 1995 | £45,806 | - |
3,523 Properties |
Property Price per Property Type in Leicester
Here you can find historic sold price data in order to help with your property search.
The average Property Paid Price for specific property types in the last three years are:
| Property Type | Average Sold Price | Sold Properties |
|---|---|---|
| Semi Detached House | £267,432.00 | 2,458 Semi Detached Houses |
| Terraced House | £217,166.00 | 3,256 Terraced Houses |
| Detached House | £397,856.00 | 722 Detached Houses |
| Flat | £133,284.00 | 841 Flats |