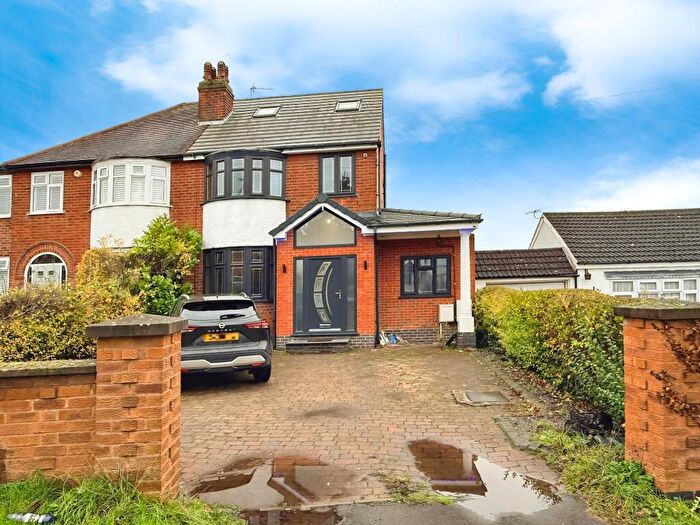
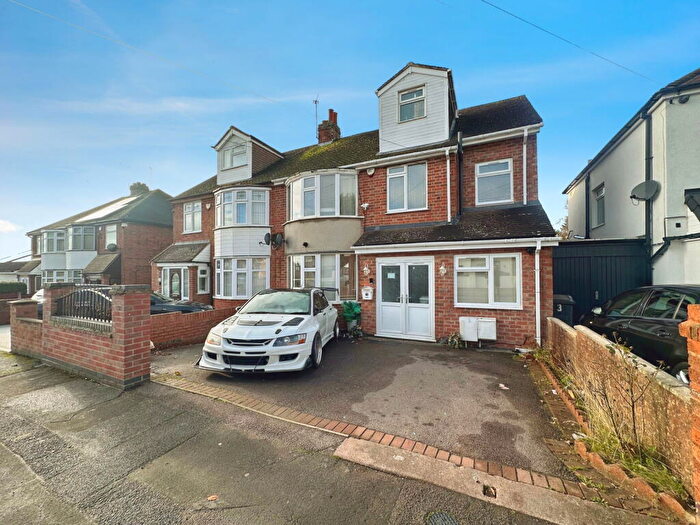
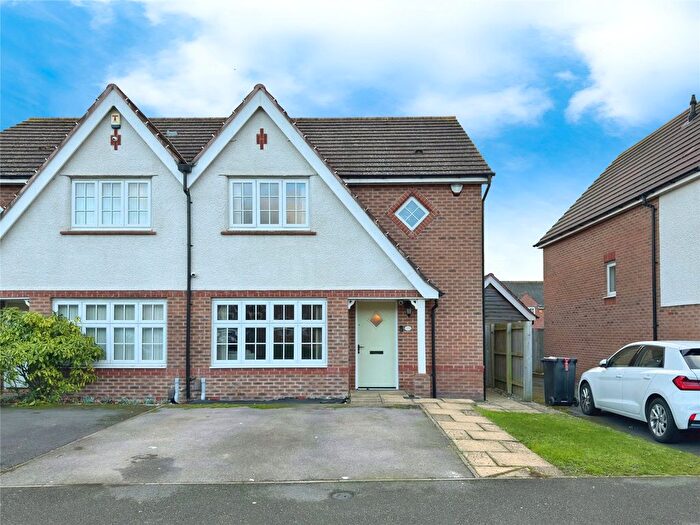
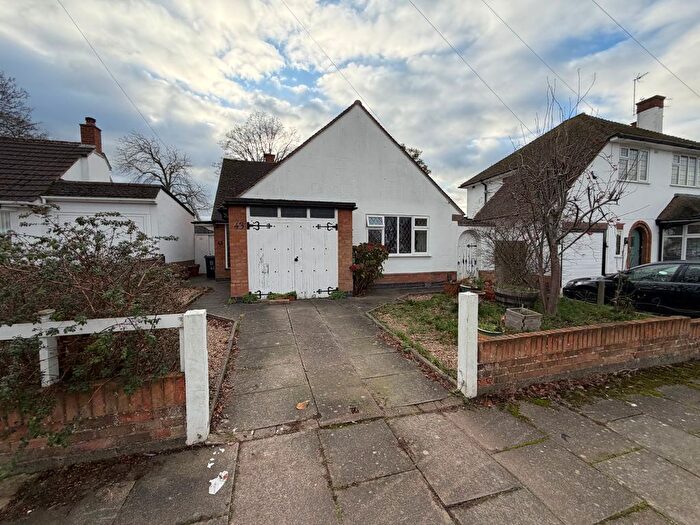
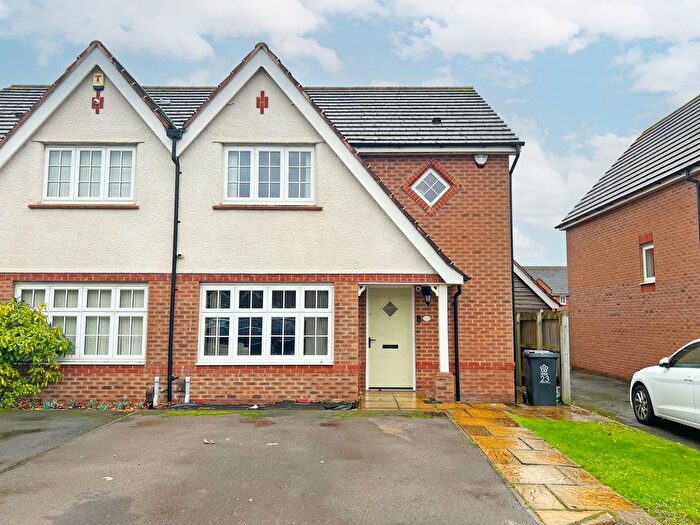
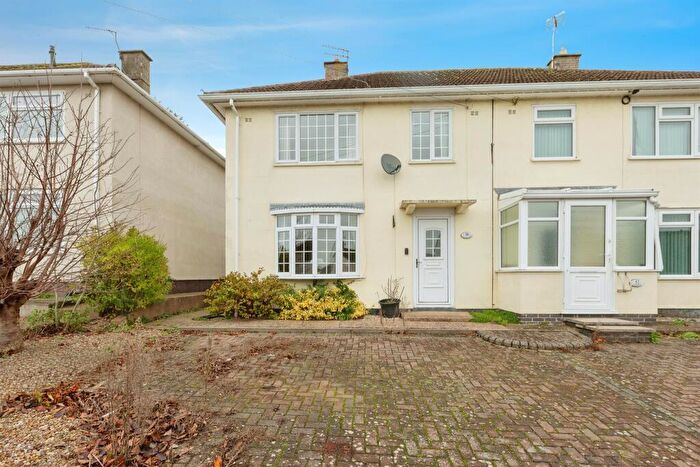
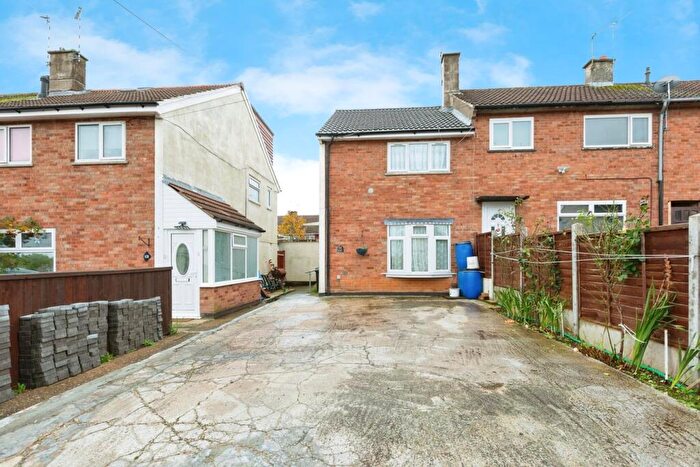
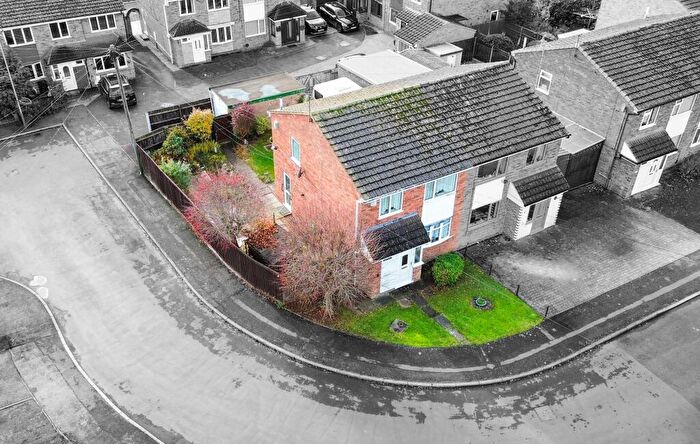
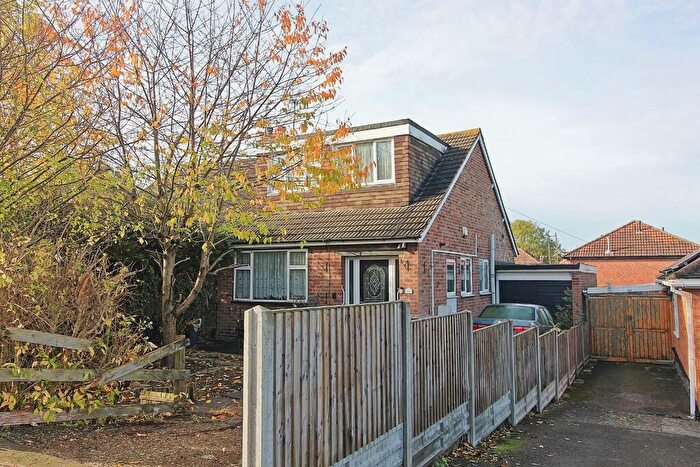
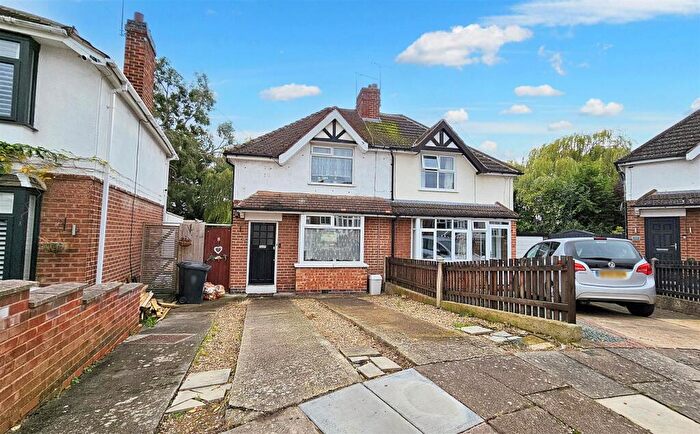
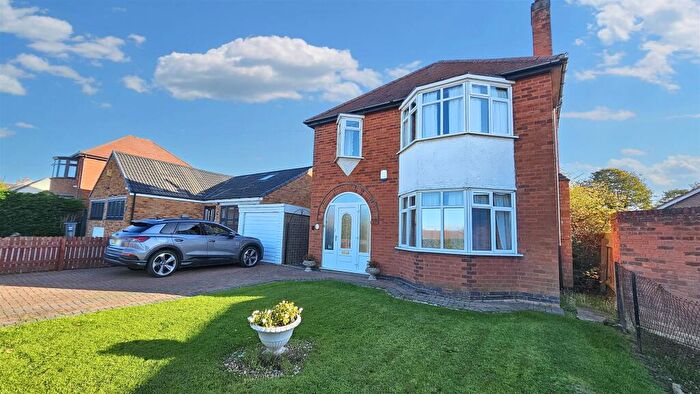
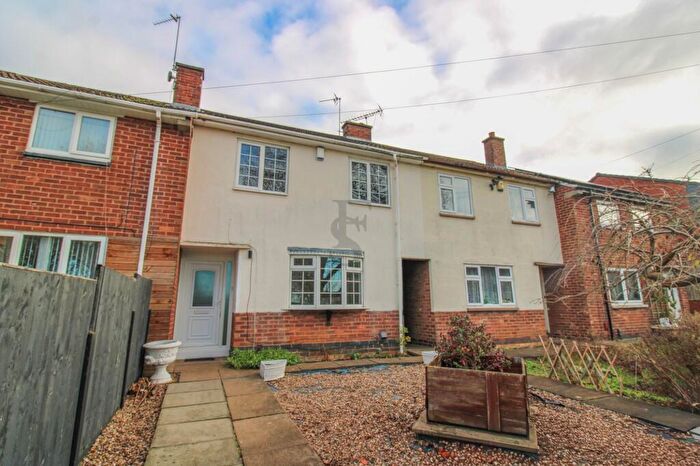
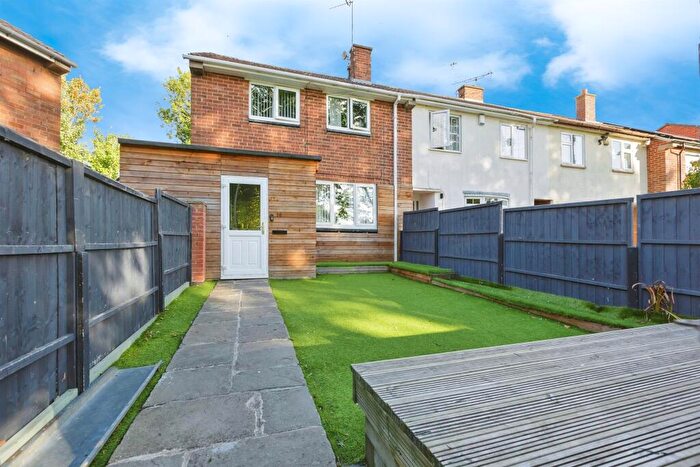
Houses for sale & to rent in Thurncourt, Leicester
House Prices in Thurncourt
Properties in Thurncourt have an average house price of £262,159.00 and had 340 Property Transactions within the last 3 years¹.
Thurncourt is an area in Leicester, City of Leicester with 3,866 households², where the most expensive property was sold for £750,000.00.
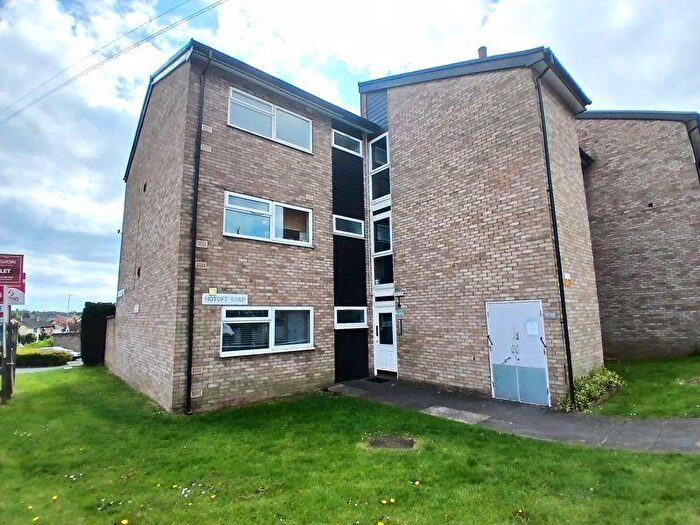
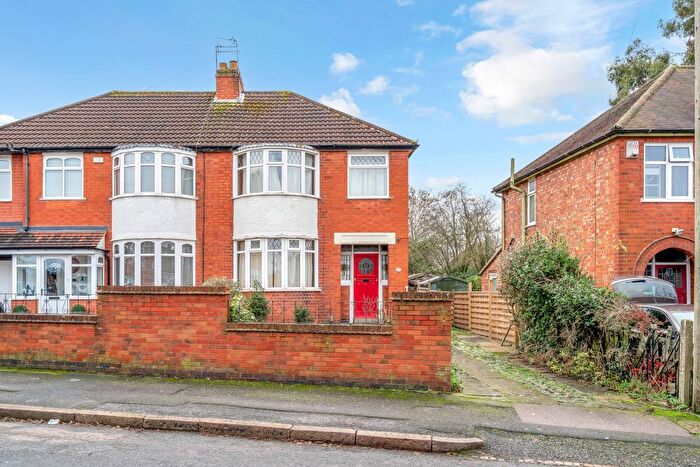
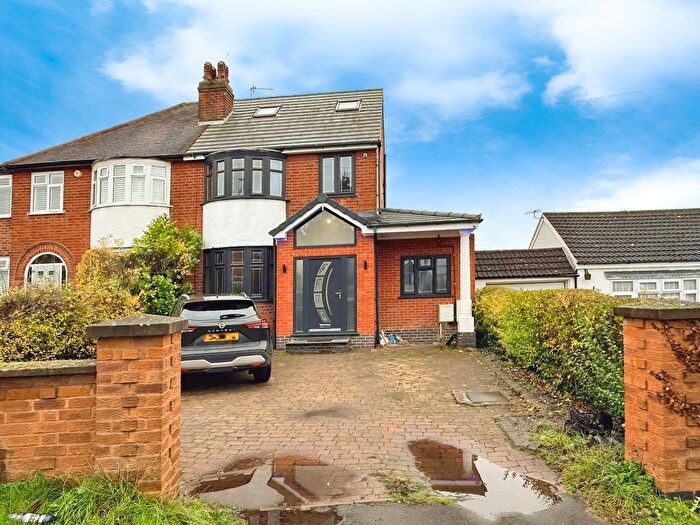
Properties for sale in Thurncourt
Roads and Postcodes in Thurncourt
Navigate through our locations to find the location of your next house in Thurncourt, Leicester for sale or to rent.
| Streets | Postcodes |
|---|---|
| Amyson Road | LE5 2EA LE5 2EB |
| Averil Road | LE5 2DA LE5 2DB LE5 2DD LE5 2DE |
| Barbara Avenue | LE5 2AA LE5 2AB LE5 2AD LE5 2AE |
| Bowhill Grove | LE5 2PB LE5 2PD LE5 2PE LE5 2PF |
| Bowhill Way | LE5 2PA |
| Brent Knowle Gardens | LE5 2GA |
| Briar Road | LE5 2HA LE5 2HB |
| Brixworth Rise | LE5 2LA |
| Brook Road | LE5 2HD LE5 2HE |
| Bryngarth Crescent | LE5 2AF |
| Century Court | LE5 2DZ |
| Chater Close | LE5 2HX |
| Chrisett Close | LE5 6RD |
| Colchester Road | LE5 2DF LE5 2DG LE5 2DH LE5 2DJ |
| Colthurst Way | LE5 2LF |
| Compass Road | LE5 2HF LE5 2HH |
| Cowley Way | LE5 2PJ |
| Crofters Drive | LE5 2FH |
| Cross Keys Green | LE5 2PG LE5 2PH |
| Croyland Green | LE5 2LB LE5 2LD LE5 2LE |
| Dakyn Road | LE5 2ED |
| Donnett Close | LE5 6RE |
| Drumcliff Road | LE5 2LG LE5 2LH |
| Dudley Avenue | LE5 2EE LE5 2EF LE5 2EG |
| Dudley Close | LE5 2FG |
| Eddystone Road | LE5 2PL LE5 2PN |
| Elmcroft Avenue | LE5 2DL |
| Fastnet Road | LE5 2PP |
| Flamborough Road | LE5 2HL LE5 2HN |
| Fredscott Close | LE5 2RA |
| Gelert Avenue | LE5 2NS |
| Gervas Road | LE5 2EH LE5 2EJ |
| Glendower Close | LE5 2DN |
| Gretna Way | LE5 2PQ |
| Haven Walk | LE5 2LN |
| Havencrest Drive | LE5 2AG LE5 2AH LE5 2AJ LE5 2AL |
| Herthull Road | LE5 2EL |
| Hollybush Close | LE5 2HZ |
| Homestone Gardens | LE5 2LJ |
| Homestone Rise | LE5 2LL |
| Jennett Close | LE5 2EZ |
| Kinross Avenue | LE5 2LP LE5 2LQ LE5 2LR LE5 2LS |
| Kinsdale Drive | LE5 2PR LE5 2PS LE5 2PT LE5 2PU |
| Kirkwall Crescent | LE5 2QA LE5 2QB LE5 2QD LE5 2QE |
| Kirminton Gardens | LE5 2EN |
| Langholm Road | LE5 2LT |
| Lodge Farm Road | LE5 2GB |
| Milnroy Road | LE5 2LU LE5 2LW |
| Nursery Road | LE5 2HP LE5 2HQ |
| Ocean Close | LE5 2EP |
| Ocean Road | LE5 2EQ LE5 2ER LE5 2ES LE5 2ET LE5 2EU |
| Ogwen Close | LE5 2EY |
| Perkyn Road | LE5 2EW LE5 2EX |
| Peters Drive | LE5 2AN LE5 2AP LE5 2AQ LE5 2AR |
| Radiant Road | LE5 2HR |
| Roborough Green | LE5 2NA LE5 2NB |
| Rona Gardens | LE5 2QF |
| Scraptoft Lane | LE5 2FD LE5 2FE LE5 2FF LE5 2HS LE5 2HT LE5 2HU |
| Scraptoft Mews | LE5 2BH |
| Sextant Road | LE5 2JA LE5 2JB |
| Somers Road | LE5 2FA LE5 2FB |
| Springway Close | LE5 2GD |
| St Austell Road | LE5 2RF LE5 2RH |
| St Swithins Road | LE5 2GE |
| Stornaway Road | LE5 2QN LE5 2QP |
| Summerlea Road | LE5 2GF |
| Sunbury Green | LE5 2QJ LE5 2QL |
| The Parkway | LE5 2BA LE5 2BB |
| Thurncourt Road | LE5 2NF LE5 2NH LE5 2NJ LE5 2NL LE5 2NN |
| Treetops Close | LE5 2FJ |
| Uppingham Road | LE5 2BD LE5 2BE LE5 2BF LE5 2DP LE5 2GG |
| Valentine Road | LE5 2GH |
| Weaver Road | LE5 2RL |
| Wendys Close | LE5 2HY |
| Wintersdale Road | LE5 2GJ LE5 2GL LE5 2GN LE5 2GP LE5 2GQ LE5 2GR LE5 2GS |
| Woodleigh Close | LE5 2HW |
| Wreford Crescent | LE5 2QG LE5 2QH |
Transport near Thurncourt
- FAQ
- Price Paid By Year
- Property Type Price
Frequently asked questions about Thurncourt
What is the average price for a property for sale in Thurncourt?
The average price for a property for sale in Thurncourt is £262,159. This amount is 9% higher than the average price in Leicester. There are 1,198 property listings for sale in Thurncourt.
What streets have the most expensive properties for sale in Thurncourt?
The streets with the most expensive properties for sale in Thurncourt are Uppingham Road at an average of £433,666, Crofters Drive at an average of £425,000 and Valentine Road at an average of £368,800.
What streets have the most affordable properties for sale in Thurncourt?
The streets with the most affordable properties for sale in Thurncourt are Wendys Close at an average of £174,687, Rona Gardens at an average of £180,000 and Scraptoft Mews at an average of £181,666.
Which train stations are available in or near Thurncourt?
Some of the train stations available in or near Thurncourt are Leicester, Syston and South Wigston.
Property Price Paid in Thurncourt by Year
The average sold property price by year was:
| Year | Average Sold Price | Price Change |
Sold Properties
|
|---|---|---|---|
| 2025 | £256,153 | -8% |
49 Properties |
| 2024 | £275,585 | 6% |
93 Properties |
| 2023 | £259,355 | 1% |
85 Properties |
| 2022 | £255,824 | 5% |
113 Properties |
| 2021 | £243,668 | 6% |
144 Properties |
| 2020 | £229,039 | 9% |
92 Properties |
| 2019 | £208,754 | 3% |
112 Properties |
| 2018 | £203,392 | 11% |
151 Properties |
| 2017 | £180,338 | 9% |
136 Properties |
| 2016 | £163,563 | 6% |
118 Properties |
| 2015 | £154,054 | 9% |
130 Properties |
| 2014 | £140,181 | 5% |
107 Properties |
| 2013 | £132,752 | -2% |
88 Properties |
| 2012 | £135,272 | -4% |
83 Properties |
| 2011 | £141,076 | 6% |
79 Properties |
| 2010 | £132,531 | 3% |
94 Properties |
| 2009 | £129,040 | - |
69 Properties |
| 2008 | £129,089 | -14% |
71 Properties |
| 2007 | £147,317 | 11% |
176 Properties |
| 2006 | £131,742 | 6% |
173 Properties |
| 2005 | £124,280 | -2% |
111 Properties |
| 2004 | £126,353 | 19% |
142 Properties |
| 2003 | £102,052 | 14% |
160 Properties |
| 2002 | £88,246 | 28% |
178 Properties |
| 2001 | £63,838 | 7% |
147 Properties |
| 2000 | £59,314 | 6% |
125 Properties |
| 1999 | £55,655 | 1% |
129 Properties |
| 1998 | £55,054 | 9% |
113 Properties |
| 1997 | £50,115 | 5% |
94 Properties |
| 1996 | £47,652 | -25% |
84 Properties |
| 1995 | £59,742 | - |
108 Properties |
Property Price per Property Type in Thurncourt
Here you can find historic sold price data in order to help with your property search.
The average Property Paid Price for specific property types in the last three years are:
| Property Type | Average Sold Price | Sold Properties |
|---|---|---|
| Semi Detached House | £271,301.00 | 166 Semi Detached Houses |
| Detached House | £339,203.00 | 44 Detached Houses |
| Terraced House | £225,219.00 | 129 Terraced Houses |
| Flat | £120,000.00 | 1 Flat |

