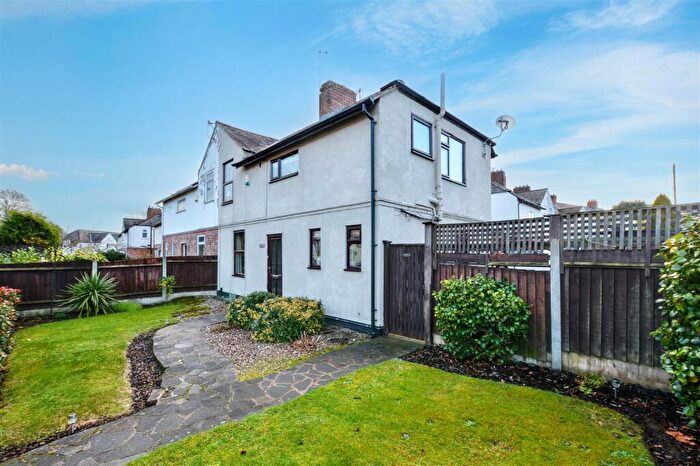
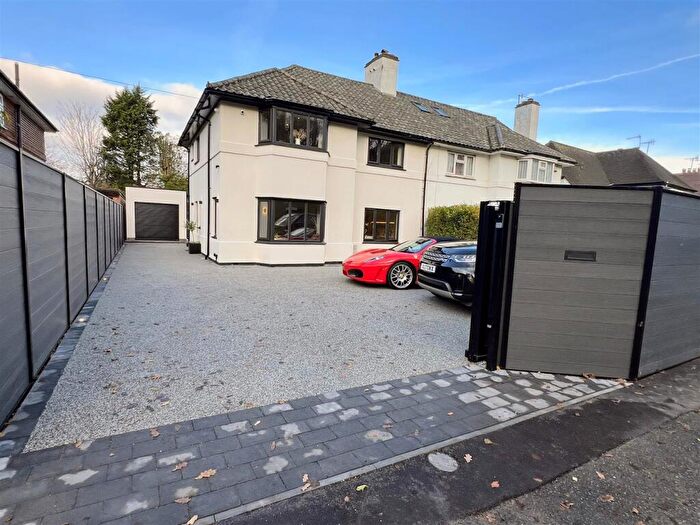
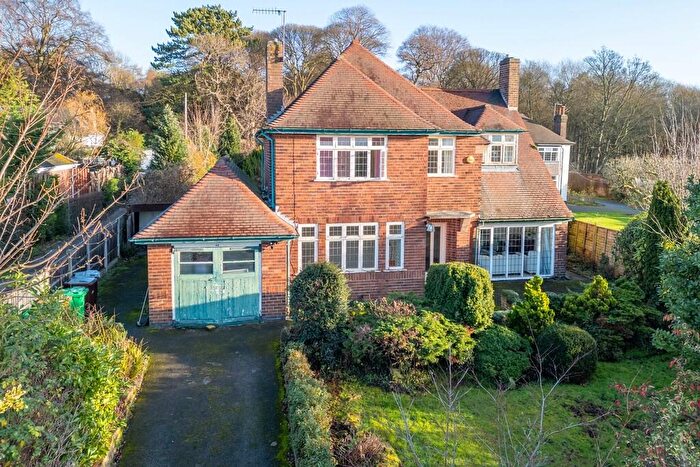
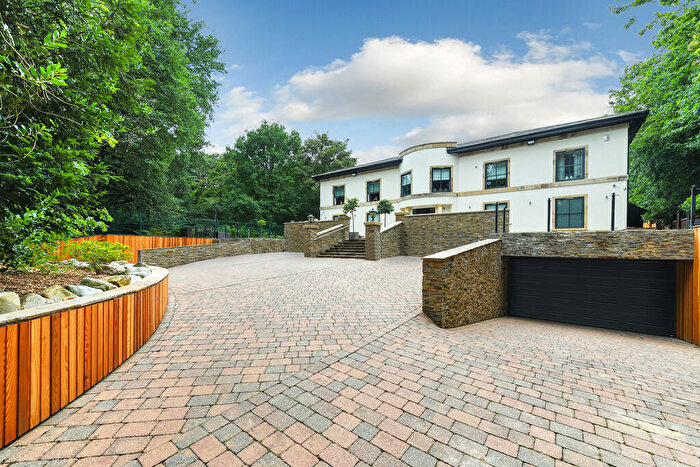
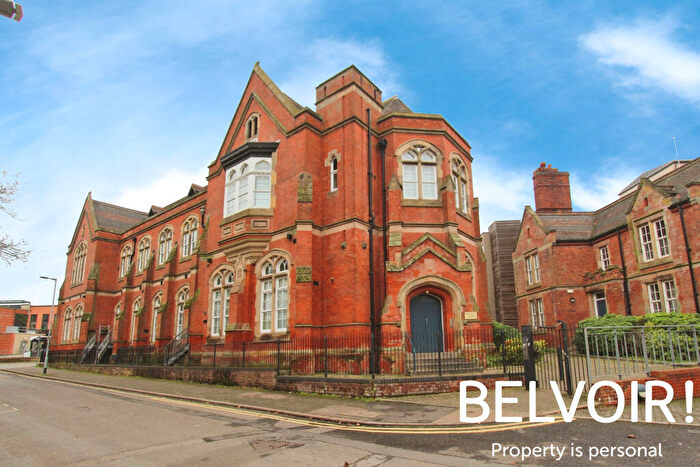
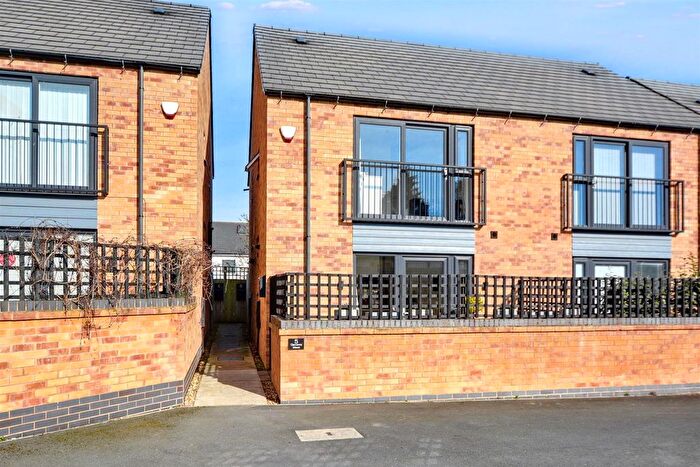
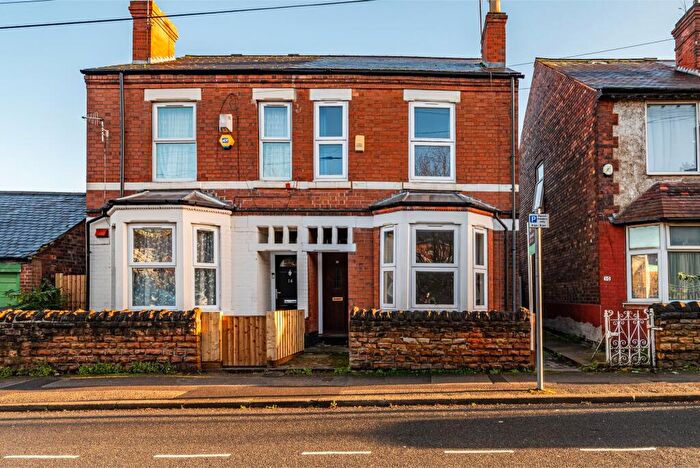
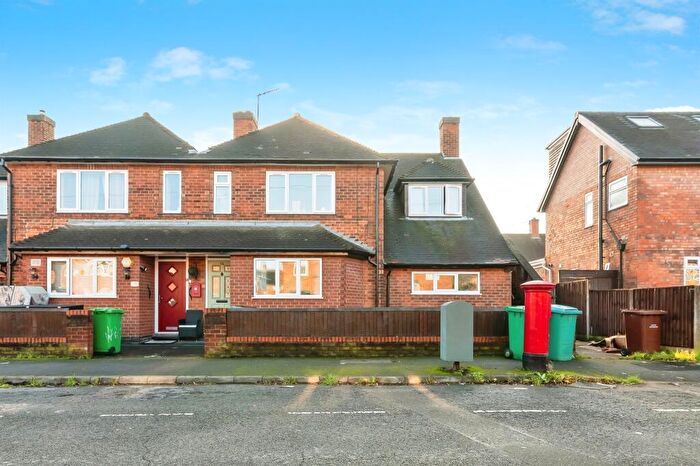
Houses for sale & to rent in Wollaton East And Lenton Abbey, Nottingham
House Prices in Wollaton East And Lenton Abbey
Properties in Wollaton East And Lenton Abbey have an average house price of £251,095.00 and had 180 Property Transactions within the last 3 years¹.
Wollaton East And Lenton Abbey is an area in Nottingham, City of Nottingham with 1,930 households², where the most expensive property was sold for £870,000.00.
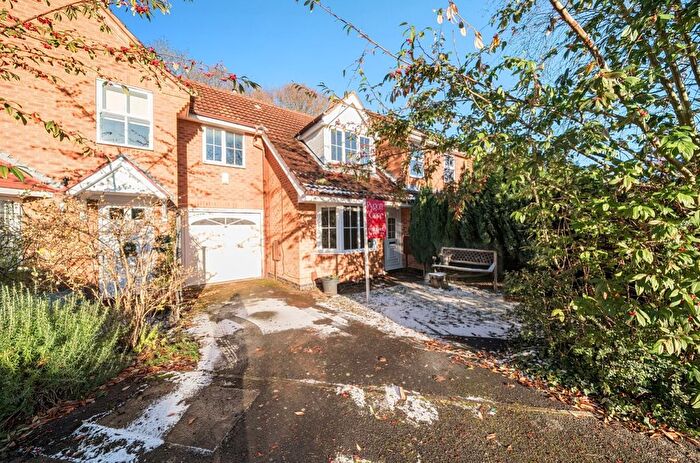
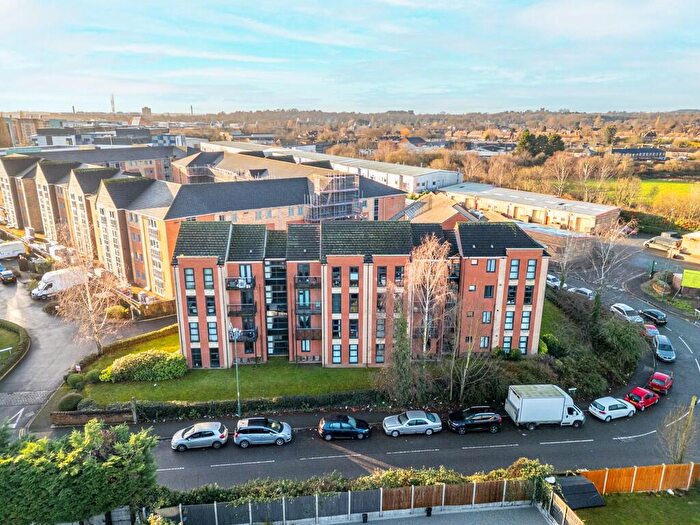
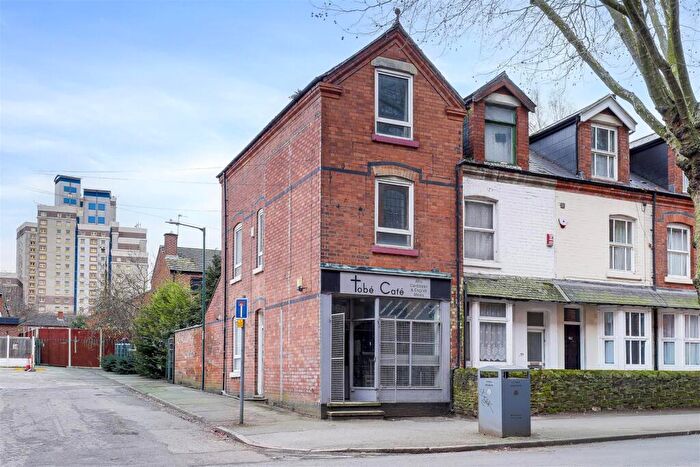
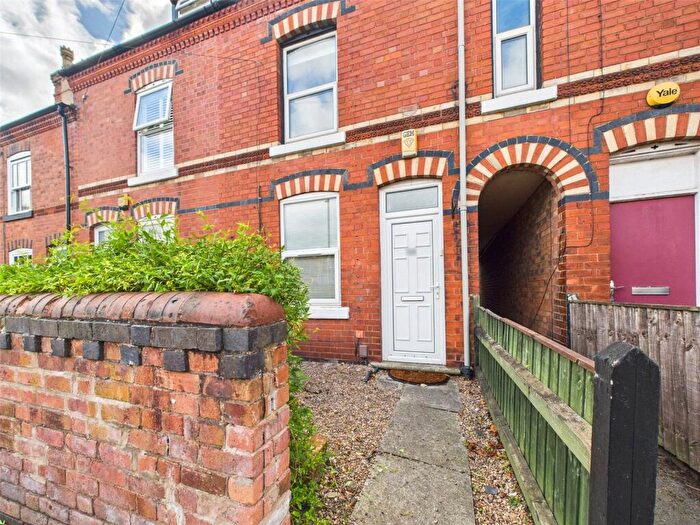
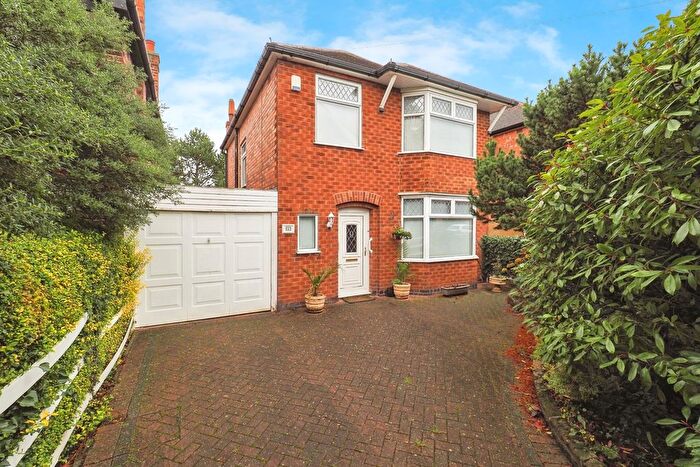
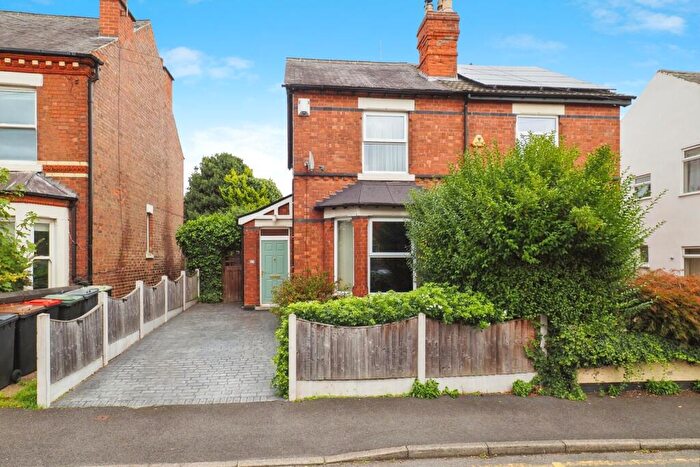
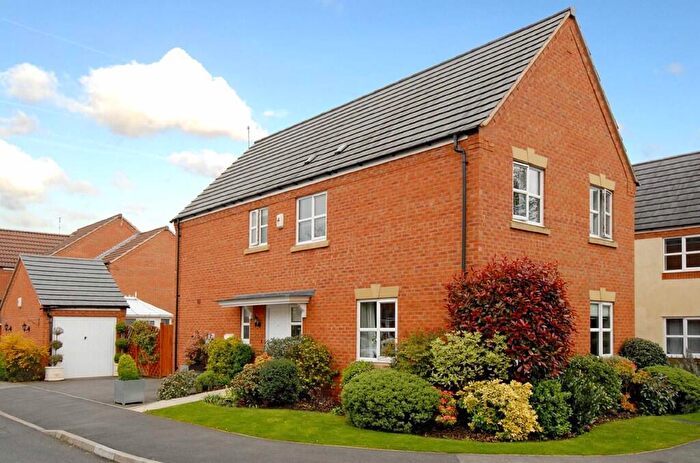
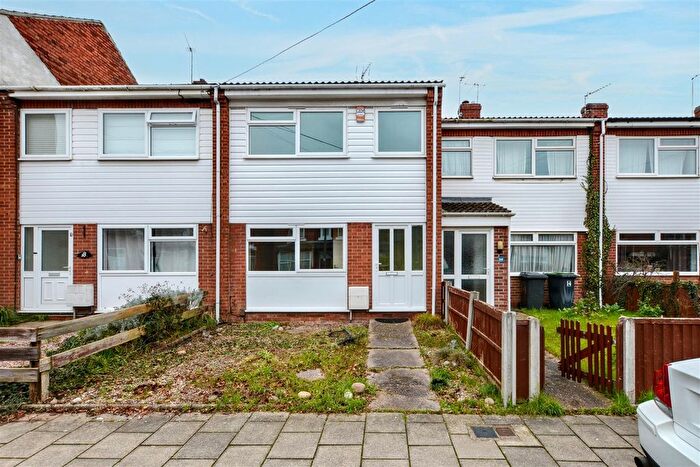
Properties for sale in Wollaton East And Lenton Abbey
Roads and Postcodes in Wollaton East And Lenton Abbey
Navigate through our locations to find the location of your next house in Wollaton East And Lenton Abbey, Nottingham for sale or to rent.
| Streets | Postcodes |
|---|---|
| Adams Hill | NG7 2GZ |
| Anslow Avenue | NG9 2SW |
| Arden Close | NG9 2FZ |
| Aston Avenue | NG9 2SS |
| Audley Drive | NG9 2SF |
| Austrey Avenue | NG9 2SX |
| Averton Square | NG8 1AN |
| Baildon Close | NG8 1BS |
| Baslow Drive | NG9 2SR NG9 2SU |
| Bosley Square | NG9 2TS |
| Broughton Drive | NG8 1DW NG8 1DX |
| Calver Close | NG8 1AT |
| Charles Avenue | NG9 2SH |
| Charnock Avenue | NG8 1AE NG8 1AG |
| Coombe Close | NG8 1BP |
| Dalby Square | NG8 1DF |
| Derby Road | NG7 2GY NG9 2SN |
| Dorket Drive | NG8 1AD |
| Enderby Square | NG9 2TQ |
| Fairham Drive | NG8 1AL |
| Farndon Green | NG8 1DU |
| Harby Drive | NG8 1AR |
| Hathern Green | NG9 2TP |
| Hawton Crescent | NG8 1BZ NG8 1DD NG8 1ED NG8 1EG |
| Hawton Spinney | NG8 1EB |
| Kilverton Close | NG8 1EF |
| Lanark Close | NG8 1BQ |
| Lawley Avenue | NG9 2SL |
| Longore Square | NG8 1AP |
| Manton Crescent | NG9 2GA NG9 2GB NG9 2GD NG9 2GE NG9 2GF |
| Meriden Avenue | NG9 2TR |
| Middleton Boulevard | NG8 1AA NG8 1AB NG8 1BG NG8 1BH NG8 1BY NG8 1FX NG8 1FY |
| Olton Avenue | NG9 2SP NG9 2SQ |
| Orston Drive | NG8 1AJ NG8 1AQ NG8 1AS NG8 1AU |
| Orston Green | NG8 1AH |
| Oundle Drive | NG8 1BN |
| Radmarsh Road | NG7 2GN |
| Romilay Close | NG9 2ST |
| Scalford Drive | NG8 1DT NG8 1EE |
| Selston Drive | NG8 1DB NG8 1DE NG8 1EJ |
| Sutton Passeys Crescent | NG8 1BU NG8 1BW NG8 1BX NG8 1DY NG8 1DZ NG8 1EA |
| Toston Drive | NG8 1DA NG8 1EH |
| University Boulevard | NG9 2GJ |
| Varden Avenue | NG9 2SJ |
| Wemyss Gardens | NG8 1BJ |
| Wensor Avenue | NG9 2HT |
| Wingfield Drive | NG9 2SG |
| Winster Close | NG9 2SE |
| Wollaton Hall Drive | NG8 1AF |
| Woodside Road | NG9 2SA NG9 2SB NG9 2SD NG9 2TL NG9 2TN NG9 2TT |
Transport near Wollaton East And Lenton Abbey
- FAQ
- Price Paid By Year
- Property Type Price
Frequently asked questions about Wollaton East And Lenton Abbey
What is the average price for a property for sale in Wollaton East And Lenton Abbey?
The average price for a property for sale in Wollaton East And Lenton Abbey is £251,095. This amount is 20% higher than the average price in Nottingham. There are 3,931 property listings for sale in Wollaton East And Lenton Abbey.
What streets have the most expensive properties for sale in Wollaton East And Lenton Abbey?
The streets with the most expensive properties for sale in Wollaton East And Lenton Abbey are Oundle Drive at an average of £720,187, Lanark Close at an average of £620,000 and University Boulevard at an average of £446,666.
What streets have the most affordable properties for sale in Wollaton East And Lenton Abbey?
The streets with the most affordable properties for sale in Wollaton East And Lenton Abbey are Austrey Avenue at an average of £158,333, Olton Avenue at an average of £163,857 and Aston Avenue at an average of £167,500.
Which train stations are available in or near Wollaton East And Lenton Abbey?
Some of the train stations available in or near Wollaton East And Lenton Abbey are Beeston, Nottingham and Attenborough.
Property Price Paid in Wollaton East And Lenton Abbey by Year
The average sold property price by year was:
| Year | Average Sold Price | Price Change |
Sold Properties
|
|---|---|---|---|
| 2025 | £222,960 | -20% |
38 Properties |
| 2024 | £268,200 | -2% |
45 Properties |
| 2023 | £273,588 | 15% |
51 Properties |
| 2022 | £232,668 | 1% |
46 Properties |
| 2021 | £231,143 | 18% |
79 Properties |
| 2020 | £189,932 | 9% |
54 Properties |
| 2019 | £173,166 | -2% |
72 Properties |
| 2018 | £176,973 | -40% |
67 Properties |
| 2017 | £248,015 | 28% |
54 Properties |
| 2016 | £177,950 | 10% |
87 Properties |
| 2015 | £159,585 | 8% |
83 Properties |
| 2014 | £147,569 | 1% |
80 Properties |
| 2013 | £145,689 | -3% |
55 Properties |
| 2012 | £150,125 | -3% |
55 Properties |
| 2011 | £154,022 | -11% |
44 Properties |
| 2010 | £170,357 | 19% |
53 Properties |
| 2009 | £137,654 | -2% |
50 Properties |
| 2008 | £140,286 | -1% |
66 Properties |
| 2007 | £141,032 | -19% |
93 Properties |
| 2006 | £167,918 | 6% |
87 Properties |
| 2005 | £158,092 | 2% |
63 Properties |
| 2004 | £154,931 | 20% |
107 Properties |
| 2003 | £124,429 | 14% |
111 Properties |
| 2002 | £106,492 | 10% |
92 Properties |
| 2001 | £96,069 | 38% |
69 Properties |
| 2000 | £59,475 | -1% |
93 Properties |
| 1999 | £60,235 | -24% |
88 Properties |
| 1998 | £74,449 | 20% |
87 Properties |
| 1997 | £59,271 | 10% |
82 Properties |
| 1996 | £53,305 | - |
65 Properties |
| 1995 | £53,283 | - |
68 Properties |
Property Price per Property Type in Wollaton East And Lenton Abbey
Here you can find historic sold price data in order to help with your property search.
The average Property Paid Price for specific property types in the last three years are:
| Property Type | Average Sold Price | Sold Properties |
|---|---|---|
| Semi Detached House | £239,776.00 | 85 Semi Detached Houses |
| Detached House | £458,644.00 | 26 Detached Houses |
| Terraced House | £186,833.00 | 69 Terraced Houses |

