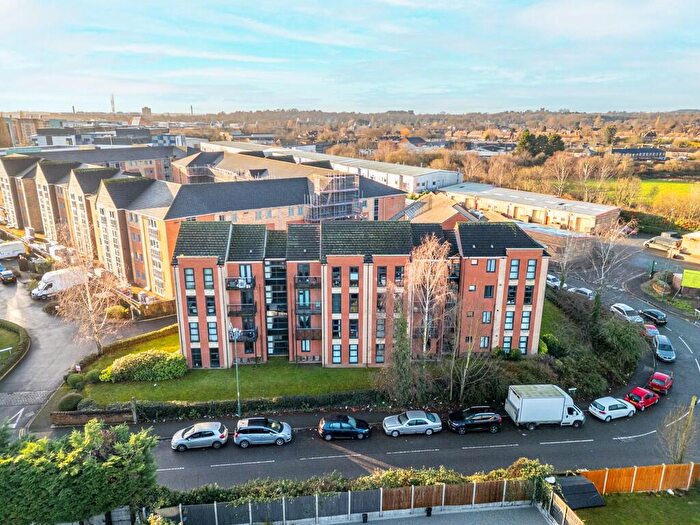
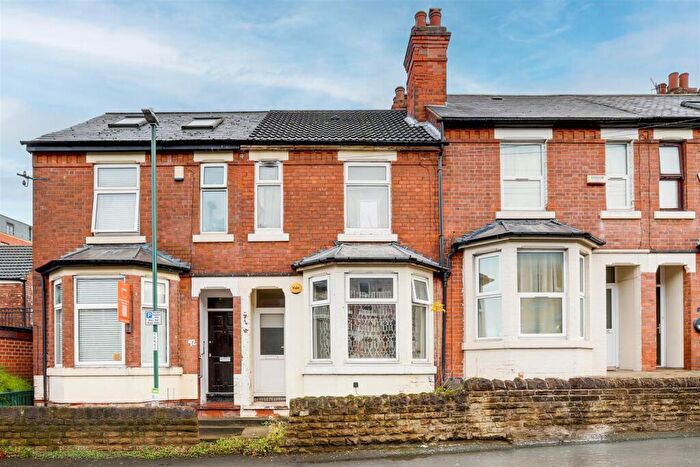
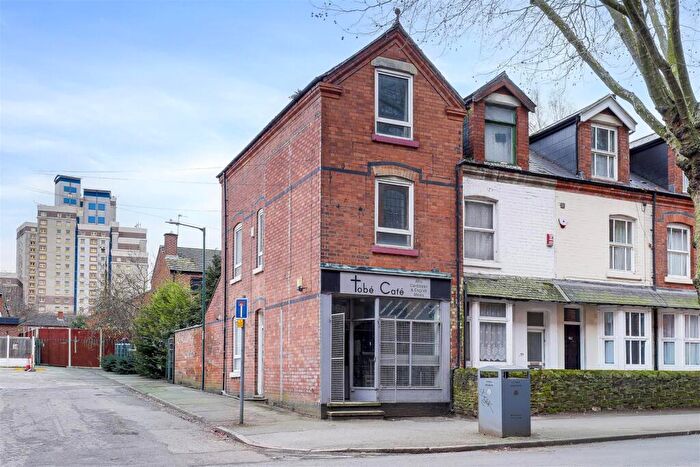
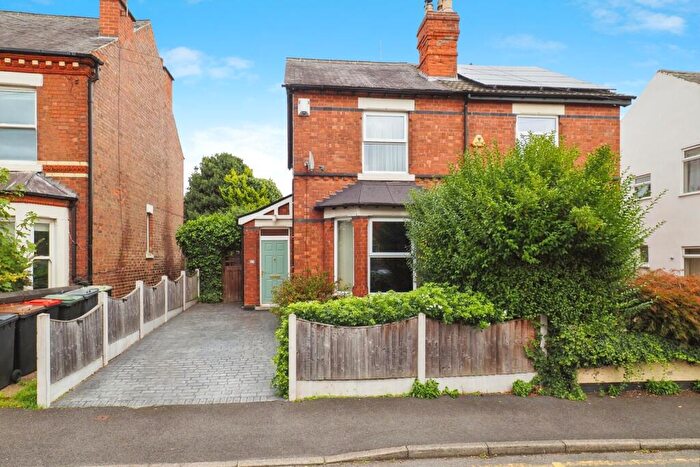
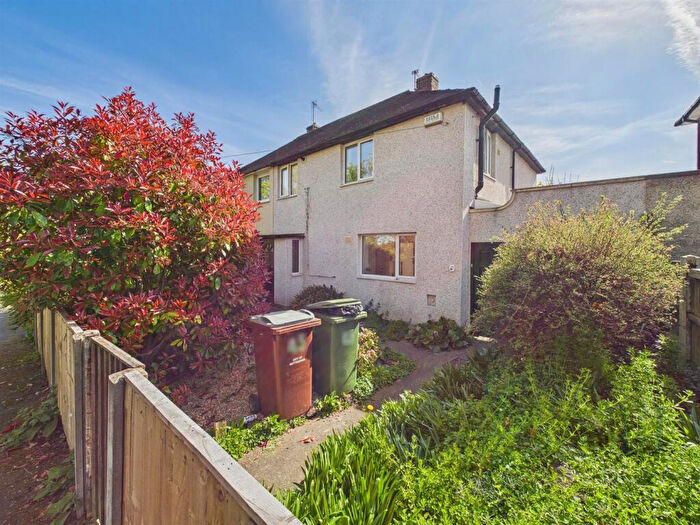
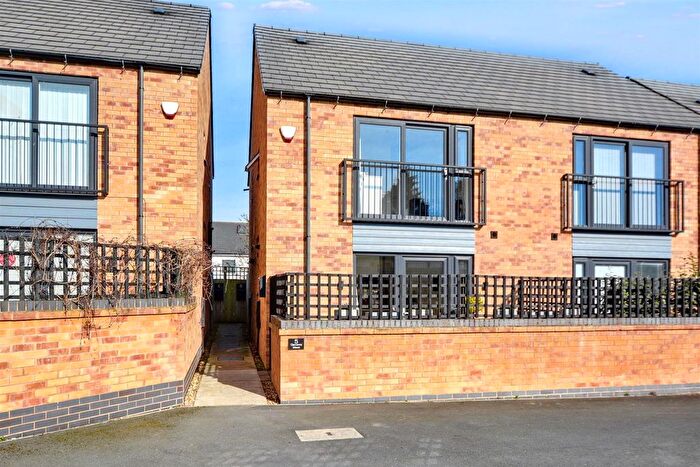
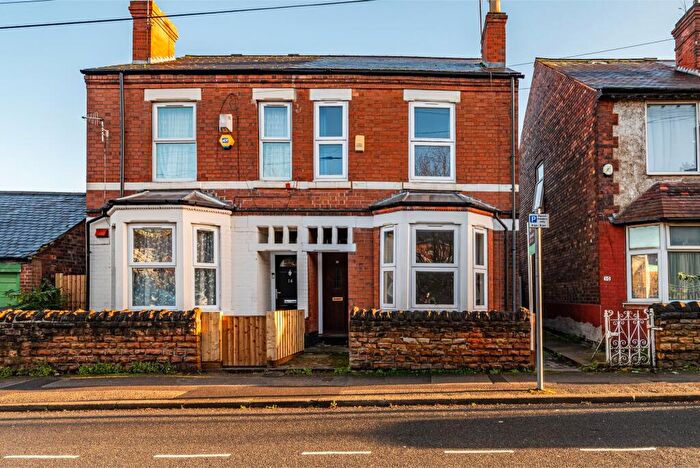
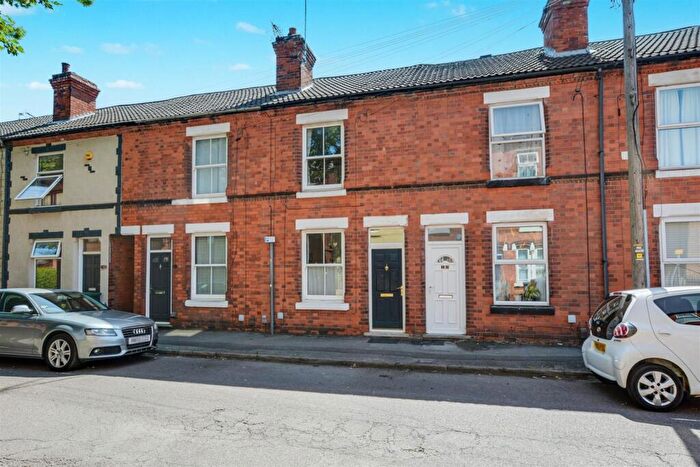
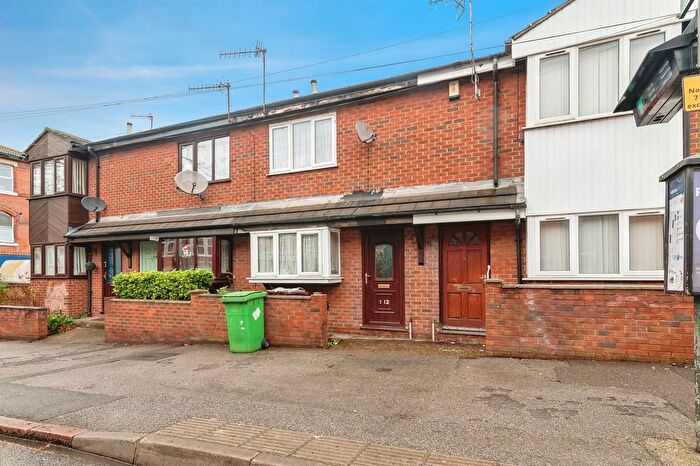
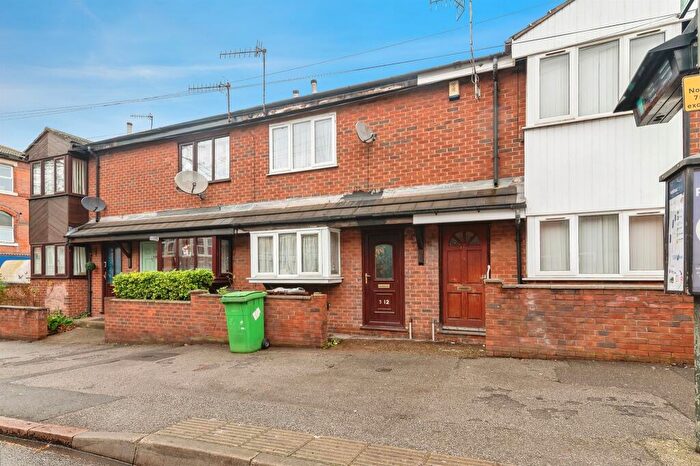
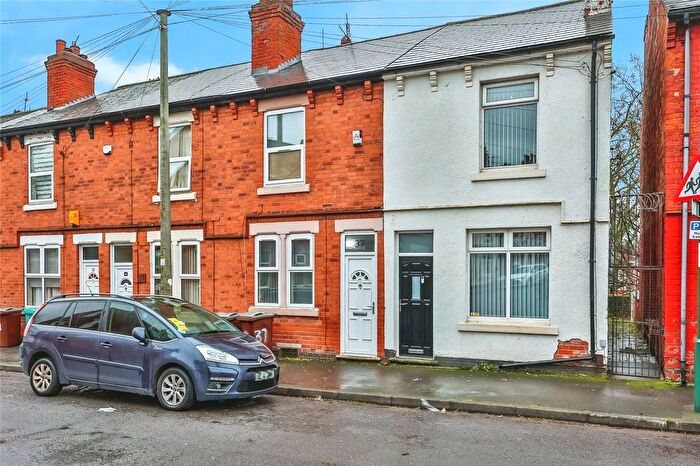
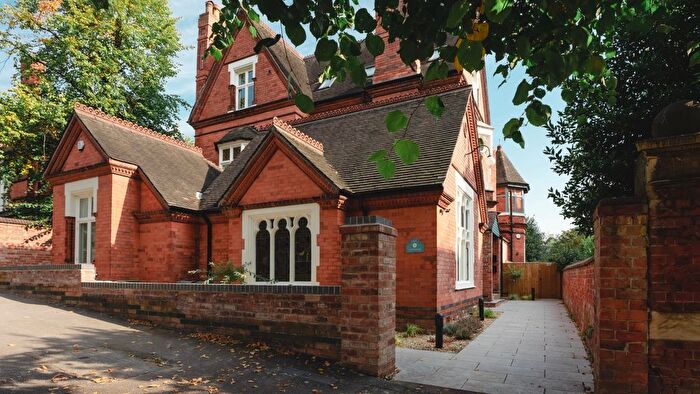
Houses for sale & to rent in Lenton & Wollaton East, Nottingham
House Prices in Lenton & Wollaton East
Properties in Lenton & Wollaton East have an average house price of £450,462.00 and had 8 Property Transactions within the last 3 years¹.
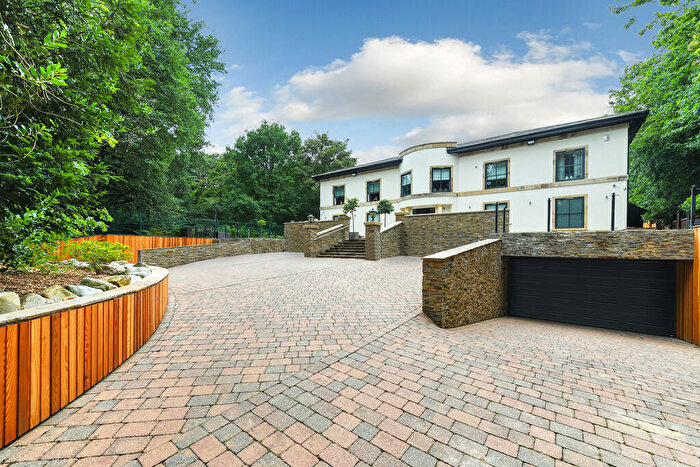
Lenton & Wollaton East is an area in Nottingham, Nottinghamshire with 423 households², where the most expensive property was sold for £1,765,200.00.
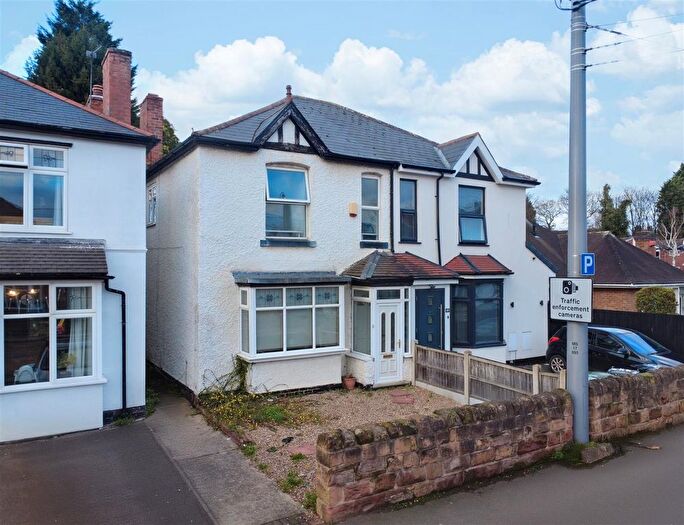
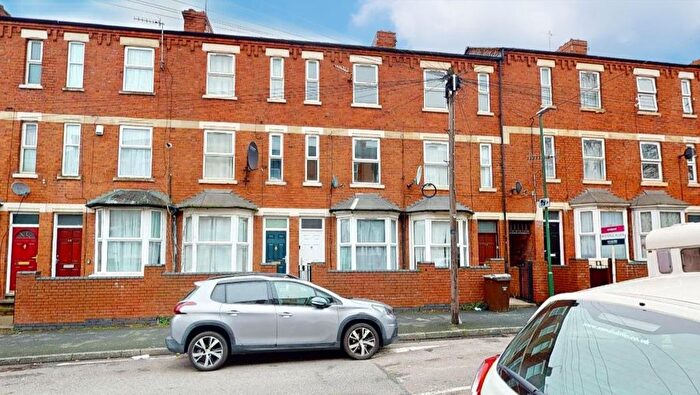
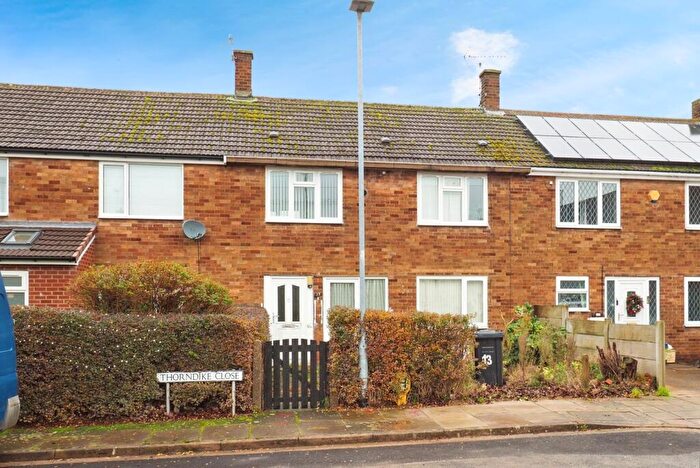
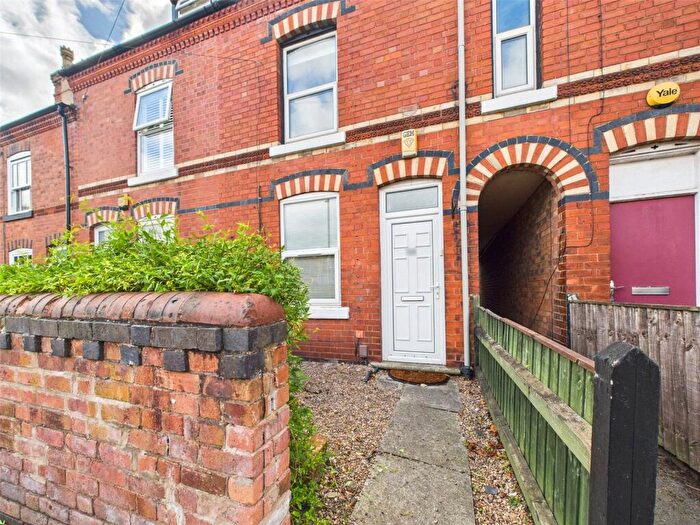
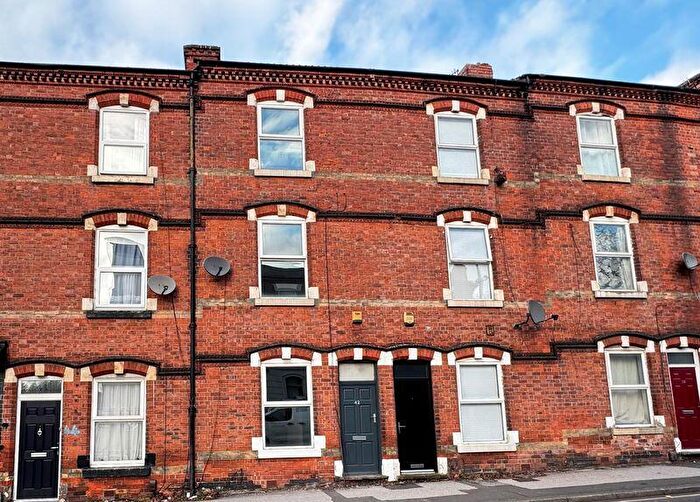
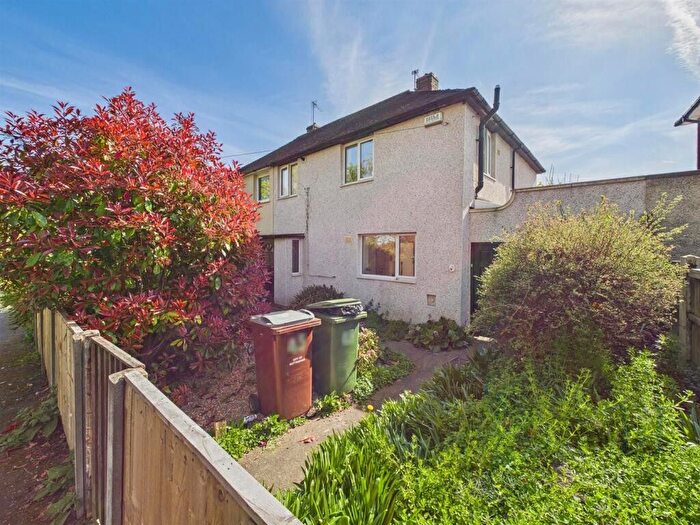
Properties for sale in Lenton & Wollaton East
Roads and Postcodes in Lenton & Wollaton East
Navigate through our locations to find the location of your next house in Lenton & Wollaton East, Nottingham for sale or to rent.
| Streets | Postcodes |
|---|---|
| Abbeyfield Road | NG7 2SX NG7 2SZ |
| Acorn Park | NG7 2TR |
| Alcester Street | NG7 2SF NG7 2UR |
| Arthur Avenue | NG7 2HE |
| Baslow Drive | NG9 2RZ |
| Beeston Lane | NG7 2QD |
| Broadholme Street | NG7 1HQ |
| Bull Close Road | NG7 2UL NG7 2UT |
| Canterbury Road | NG8 1PT |
| Castle Boulevard | NG7 1FP |
| Cavendish Street | NG7 2TJ |
| Charles Avenue | NG9 2SY |
| Claude Street | NG7 2LG |
| Derby Road | NG7 2ED NG7 2GQ NG7 2GS NG7 2GU NG7 2GW NG7 2QA NG7 2UH |
| East Drive | NG7 2TW |
| Electric Avenue | NG2 1AR |
| Finch Close | NG7 2NN |
| Florence Boot Close | NG7 2QF |
| George Green Way | NG7 2UD |
| Godfrey Lane | NG7 1SQ |
| Green Close | NG7 2RX |
| Gregory Street | NG7 2NP NG7 2NS |
| Harrimans Lane | NG7 2SD |
| Harrowby Mews | NG7 1SU |
| Heath Close | NG7 1SR |
| Jesse Boot Avenue | NG7 2RU |
| Kenyon Road | NG7 2HG |
| Kyte Street | NG7 1RT |
| Leengate | NG7 2LX NG7 2PN |
| Lenton Lane | NG7 2AX NG7 2NR NG7 2PQ NG7 2PT NG7 2PW NG7 2PX NG7 2SA |
| Lister Road | NG7 2FT |
| Lombard Street | NG7 1SS |
| Maple Court | NG7 1LL |
| Maxwell Close | NG7 1UR |
| Medway Street | NG8 1PN |
| Middleton Boulevard | NG8 1BL |
| Nazareth Road | NG7 2RS |
| Newton Street | NG7 2SG |
| Nightingale Close | NG7 2QG |
| Nottingham Science & Technology Park | NG7 2RF NG7 2RQ |
| Nottingham Science & Technology Park | NG7 2PZ NG7 2QJ NG7 2QN NG7 2QP NG7 2RG NG7 2RH NG7 2RL NG7 2TN |
| Park Road | NG7 1JF |
| Park Street | NG7 1ST |
| Penn Avenue | NG7 2LU |
| Phoenix Court | NG7 2PU |
| Poplars Court | NG7 2RR |
| Prospect Place | NG7 1RS |
| Radmarsh Road | NG7 2GJ NG7 2GL NG7 2TY |
| Redfield Road | NG7 2UJ |
| Redfield Way | NG7 2UW |
| Sherwin Road | NG7 2FE NG7 2FJ |
| Tenants Hall Close | NG9 2RW |
| Thane Road | NG7 2AA NG7 2TG NG90 1BS |
| The Friary | NG7 2PB |
| The Midway | NG7 2TS |
| Triumph Road | NG7 2GA NG7 2GG NG7 2GT NG7 2TU NG8 1DH |
| Turnpike Lane | NG9 2RU NG9 2RX NG9 2UR NG9 2US NG9 2UT NG9 2UU NG9 2UW NG9 2UX |
| University Boulevard | NG7 2PS |
| University Park | NG7 2AF NG7 2BF NG7 2GP NG7 2GR NG7 2QH NG7 2QL NG7 2QR NG7 2QS NG7 2QT NG7 2QU NG7 2QW NG7 2QX NG7 2QY NG7 2QZ NG7 2RA NG7 2RB NG7 2RD NG7 2RE NG7 2RJ NG7 2SJ NG7 2TQ |
| Willoughby Close | NG7 2QE |
| Willoughby Street | NG7 1US |
| Willow Road | NG7 2PR NG7 2TA NG7 2WS |
| Wollaton Road | NG8 1BB NG8 1FD |
| Wortley Hall Close | NG7 2QB |
| NG7 2HA NG90 1LZ NG90 4FS NG90 4HQ NG90 4RU NG90 4XY NG90 5EF NG90 5GT NG90 5PY NG90 7GP |
Transport near Lenton & Wollaton East
- FAQ
- Price Paid By Year
- Property Type Price
Frequently asked questions about Lenton & Wollaton East
What is the average price for a property for sale in Lenton & Wollaton East?
The average price for a property for sale in Lenton & Wollaton East is £450,462. This amount is 60% higher than the average price in Nottingham. There are 3,408 property listings for sale in Lenton & Wollaton East.
Which train stations are available in or near Lenton & Wollaton East?
Some of the train stations available in or near Lenton & Wollaton East are Beeston, Nottingham and Attenborough.
Property Price Paid in Lenton & Wollaton East by Year
The average sold property price by year was:
| Year | Average Sold Price | Price Change |
Sold Properties
|
|---|---|---|---|
| 2024 | £1,765,200 | 91% |
1 Property |
| 2023 | £151,666 | -128% |
3 Properties |
| 2022 | £345,875 | 51% |
4 Properties |
| 2021 | £168,333 | 5% |
3 Properties |
| 2020 | £160,000 | 39% |
1 Property |
| 2019 | £97,000 | -26% |
2 Properties |
| 2018 | £122,295 | -14% |
22 Properties |
| 2017 | £139,700 | 5% |
5 Properties |
| 2016 | £132,500 | 34% |
1 Property |
| 2015 | £87,000 | -32% |
1 Property |
| 2009 | £115,000 | 13% |
1 Property |
| 2006 | £100,000 | 18% |
1 Property |
| 2002 | £82,000 | 33% |
1 Property |
| 1996 | £55,000 | - |
1 Property |
Property Price per Property Type in Lenton & Wollaton East
Here you can find historic sold price data in order to help with your property search.
The average Property Paid Price for specific property types in the last three years are:
| Property Type | Average Sold Price | Sold Properties |
|---|---|---|
| Semi Detached House | £165,000.00 | 2 Semi Detached Houses |
| Detached House | £1,310,100.00 | 2 Detached Houses |
| Terraced House | £210,000.00 | 2 Terraced Houses |
| Flat | £116,750.00 | 2 Flats |

