
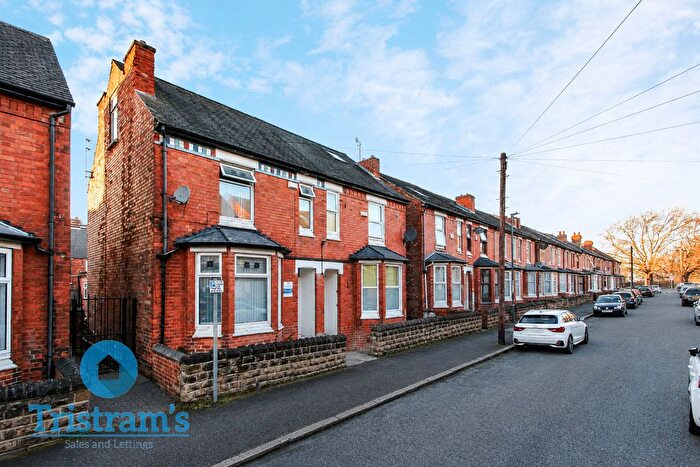
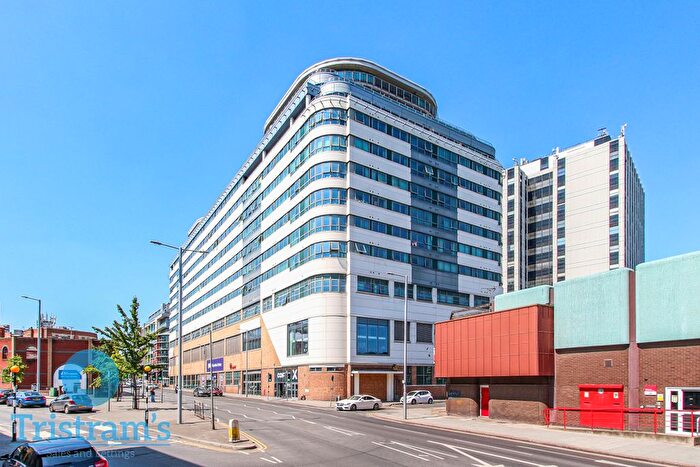
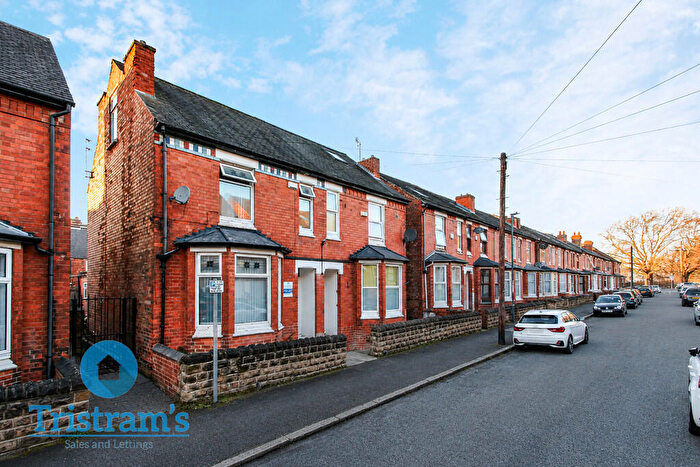
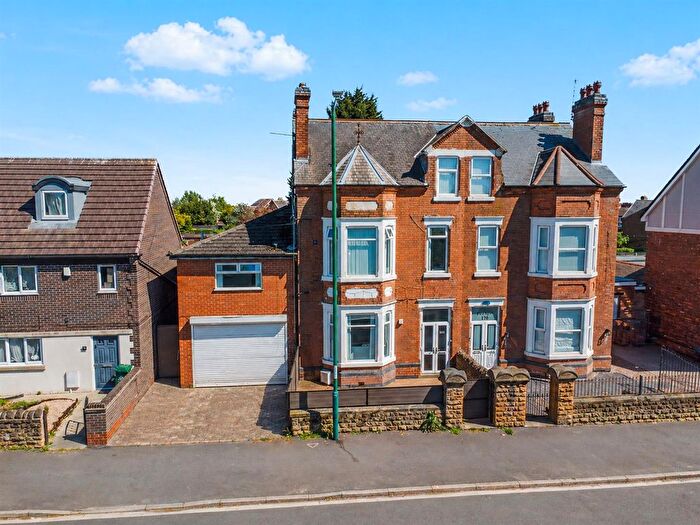
Houses for sale & to rent in City of Nottingham, England
House Prices in City of Nottingham
Properties in City of Nottingham have
an average house price of
£209k
and had 10,112 Property Transactions
within the last 3 years.¹
City of Nottingham is a location in
England with
115,096 households², where the most expensive property was sold for £2.3M.
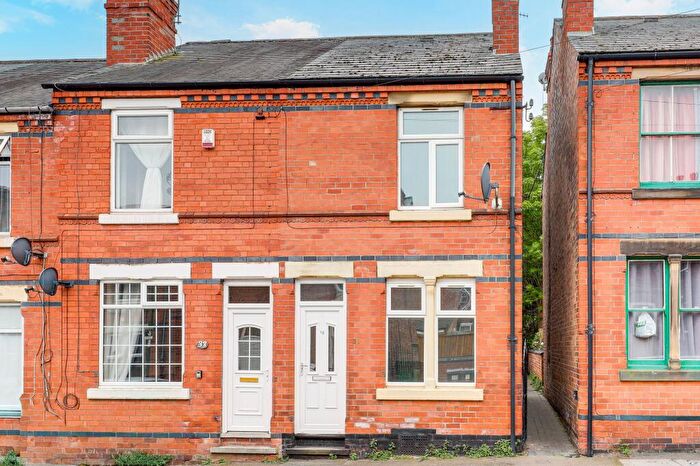
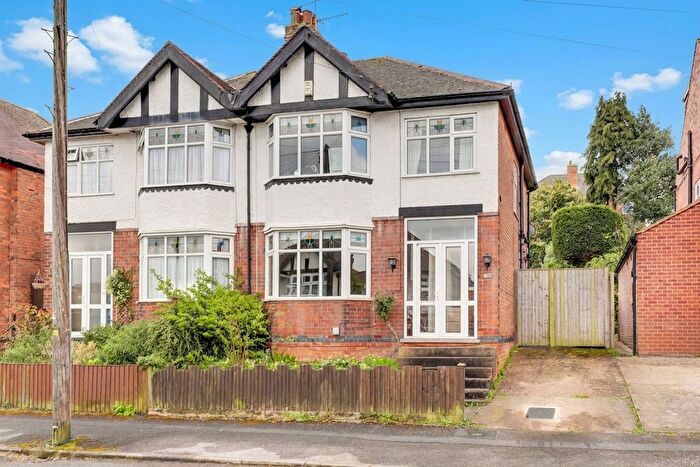
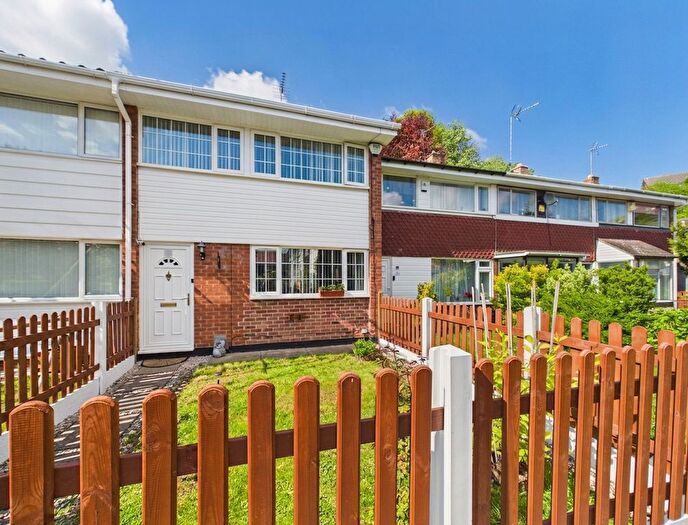
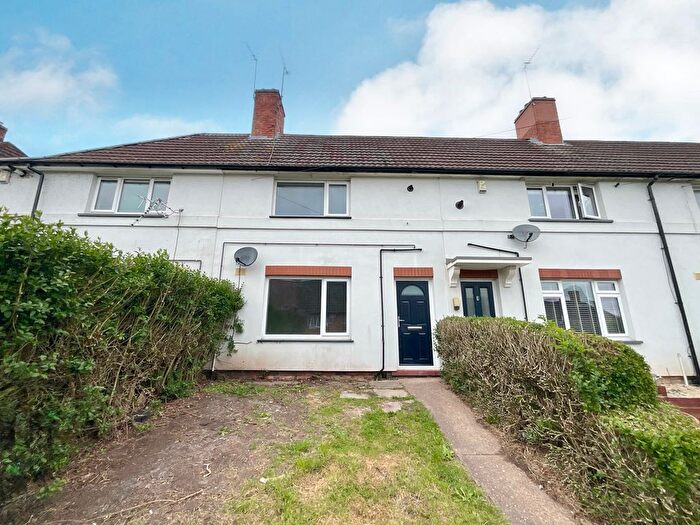
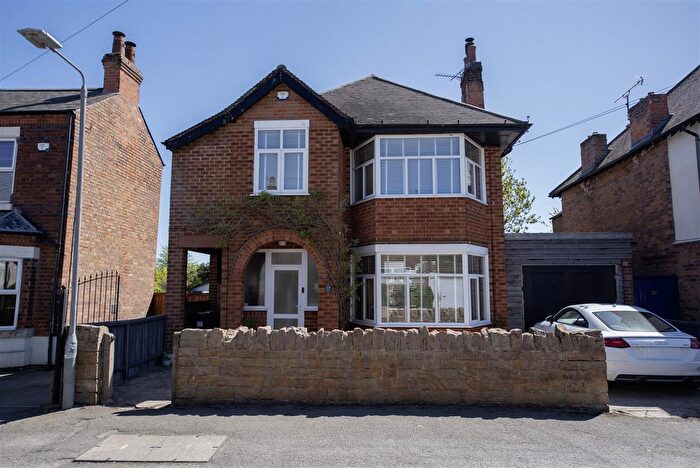
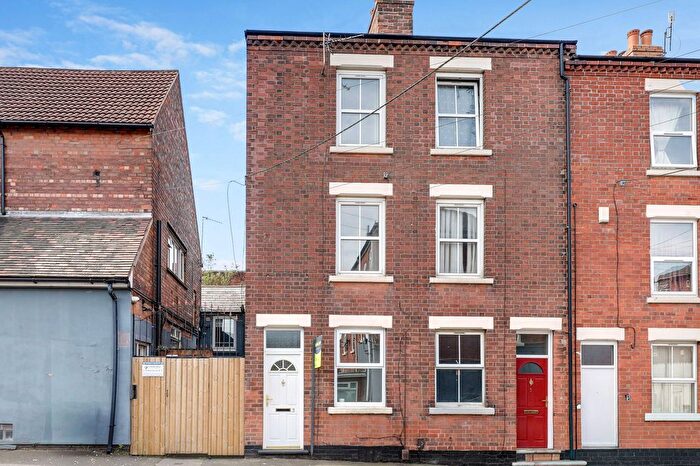
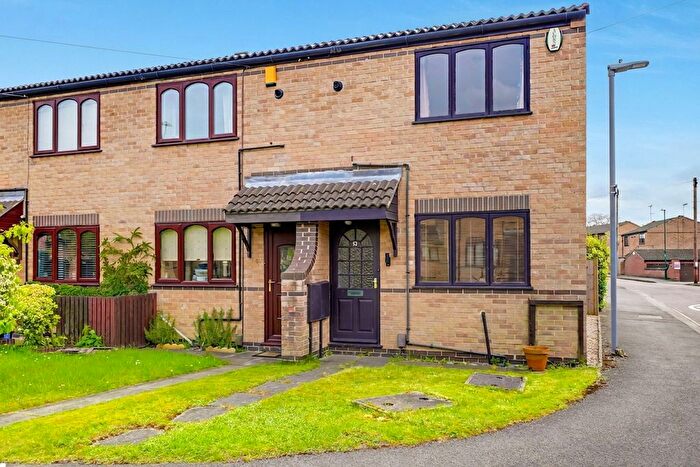
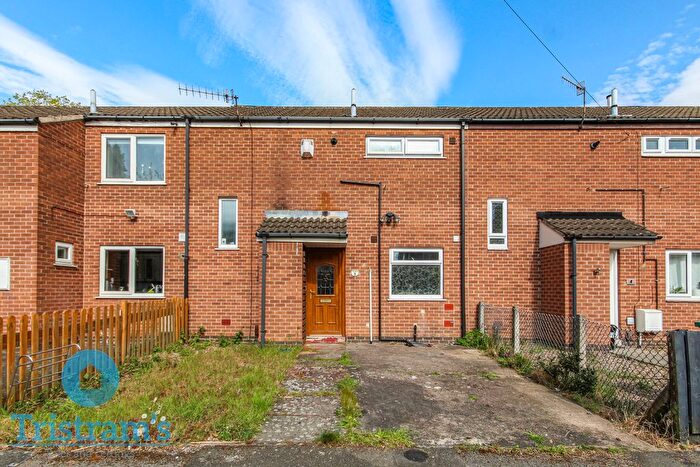
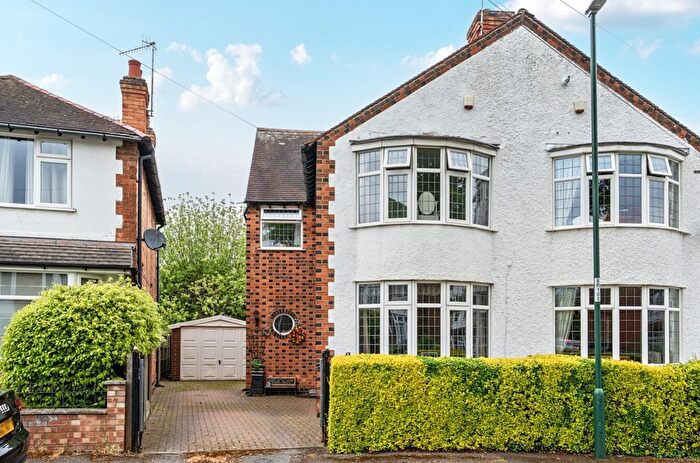
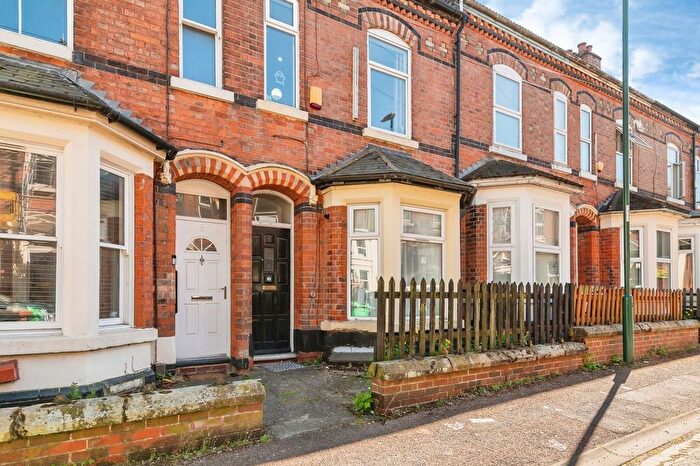
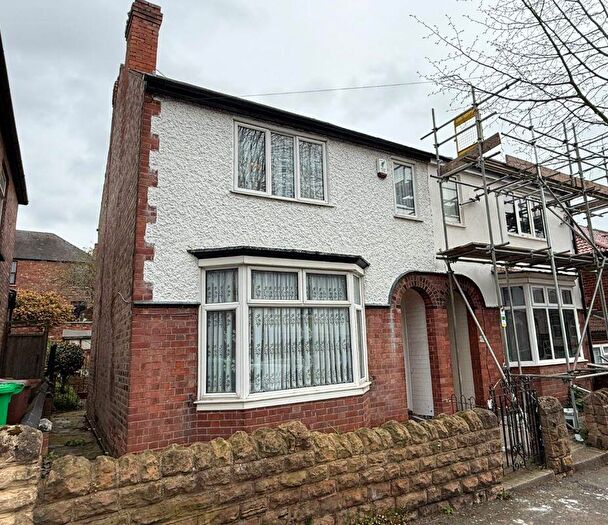
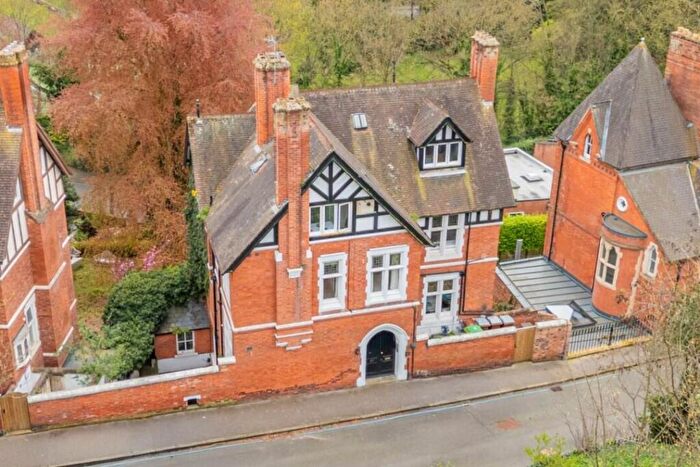
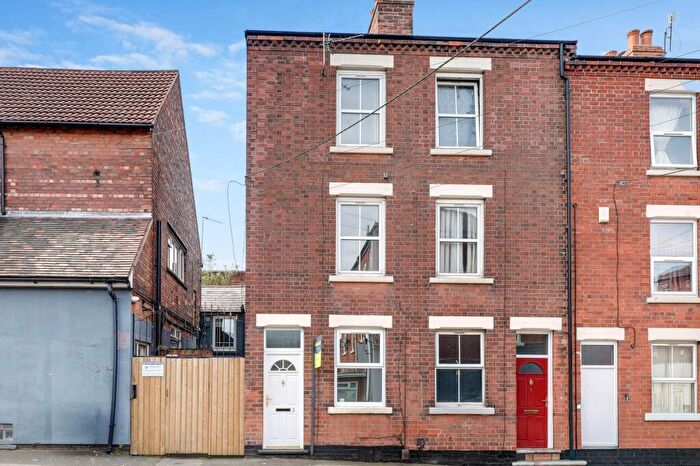
Properties for sale in City of Nottingham
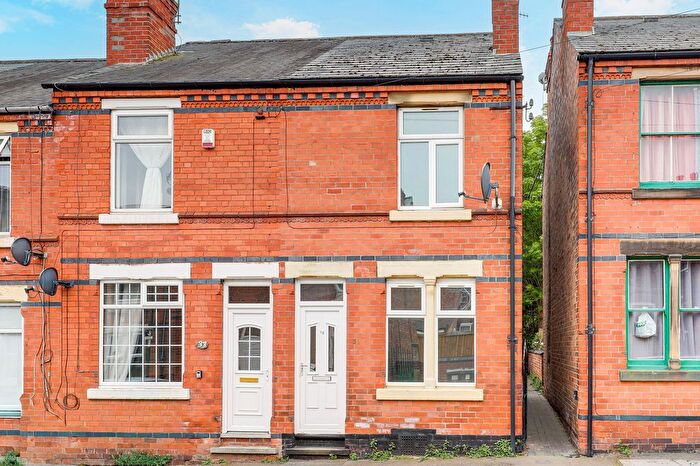
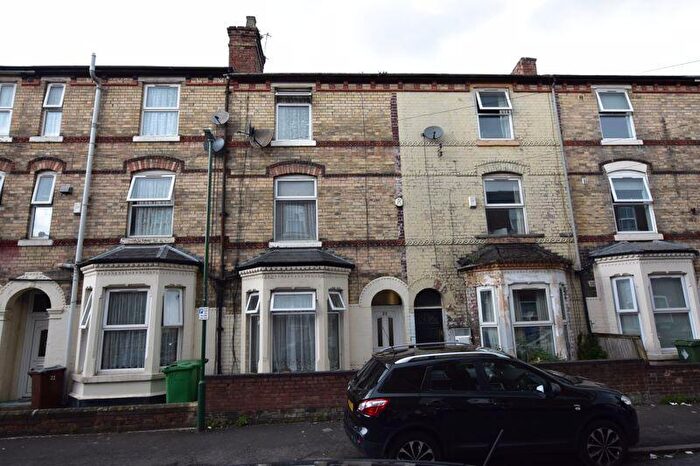
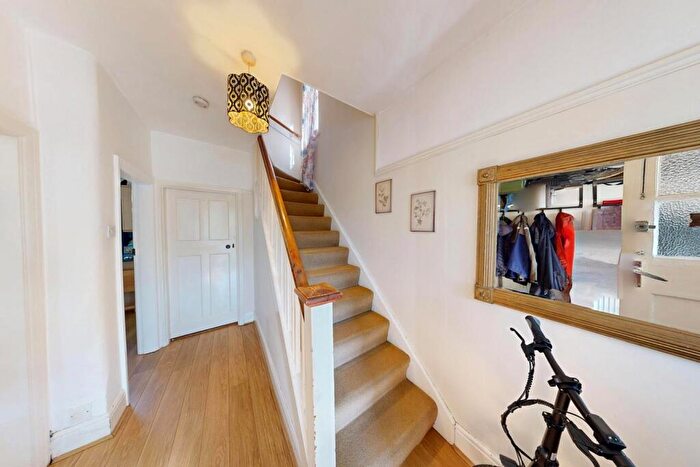
![]()
If you are looking to sell your house, let it out, or receive a property valuation, an expert can help you.
Click the button below to get started.

Towns in City of Nottingham
Navigate through our locations to find the location of your next house in City of Nottingham, England for sale or to rent.
Transport in City of Nottingham
Please see below transportation links in this area:
-
 Nottingham Station
 -
Bulwell Station
-
Beeston Station
-
Netherfield Station
-
Carlton Station
-
Attenborough Station
- FAQ
- Price Paid By Year
- Property Type Price
Frequently asked questions about City of Nottingham
What is the average price for a property for sale in City of Nottingham?
The average price for a property for sale in City of Nottingham is £209,423. This amount is 42% lower than the average price in England. There are more than 10,000 property listings for sale in City of Nottingham.
Which train stations are available in or near City of Nottingham?
Some of the train stations available in or near City of Nottingham are Nottingham, Bulwell and Beeston.
Property Price Paid in City of Nottingham by Year
The average sold property price by year was:
| Year | Average Sold Price | Price Change |
Sold Properties
|
|---|---|---|---|
| 2026 | £213,602 | 1% |
243 Properties |
| 2025 | £210,922 | 1% |
3,184 Properties |
| 2024 | £208,184 | -0,4% |
3,362 Properties |
| 2023 | £208,934 | 3% |
3,323 Properties |
| 2022 | £202,032 | 4% |
3,938 Properties |
| 2021 | £192,945 | 9% |
4,249 Properties |
| 2020 | £175,588 | 11% |
3,260 Properties |
| 2019 | £157,041 | -1% |
4,257 Properties |
| 2018 | £159,135 | 6% |
4,313 Properties |
| 2017 | £149,321 | 7% |
4,205 Properties |
| 2016 | £139,585 | 5% |
4,218 Properties |
| 2015 | £132,626 | 3% |
4,074 Properties |
| 2014 | £128,445 | 7% |
3,980 Properties |
| 2013 | £119,632 | 0,5% |
3,023 Properties |
| 2012 | £119,044 | 1% |
2,517 Properties |
| 2011 | £118,047 | -3% |
2,629 Properties |
| 2010 | £121,264 | -3% |
2,750 Properties |
| 2009 | £124,392 | -1% |
2,609 Properties |
| 2008 | £125,259 | -3% |
3,114 Properties |
| 2007 | £129,248 | 1% |
6,015 Properties |
| 2006 | £128,452 | 2% |
5,954 Properties |
| 2005 | £125,392 | 5% |
4,981 Properties |
| 2004 | £118,942 | 11% |
6,176 Properties |
| 2003 | £105,982 | 20% |
6,009 Properties |
| 2002 | £84,574 | 20% |
6,233 Properties |
| 2001 | £67,664 | 13% |
5,594 Properties |
| 2000 | £58,651 | 6% |
4,895 Properties |
| 1999 | £55,172 | 7% |
4,379 Properties |
| 1998 | £51,282 | 5% |
4,060 Properties |
| 1997 | £48,846 | 5% |
4,133 Properties |
| 1996 | £46,305 | 2% |
3,602 Properties |
| 1995 | £45,175 | - |
3,197 Properties |
Property Price per Property Type in City of Nottingham
Here you can find historic sold price data in order to help with your property search.
The average Property Paid Price for specific property types in the last three years are:
| Property Type | Average Sold Price | Sold Properties |
|---|---|---|
| Semi Detached House | £217,464.00 | 3,222 Semi Detached Houses |
| Terraced House | £172,882.00 | 4,014 Terraced Houses |
| Detached House | £344,094.00 | 1,456 Detached Houses |
| Flat | £156,383.00 | 1,420 Flats |