
Houses for sale & to rent in PL4 6ES, Nottingham Gardens, Drake, Plymouth
House Prices in PL4 6ES, Nottingham Gardens, Drake
Properties in PL4 6ES have no sales history available within the last 3 years. PL4 6ES is a postcode in Nottingham Gardens located in Drake, an area in Plymouth, City of Plymouth, with 4 households².
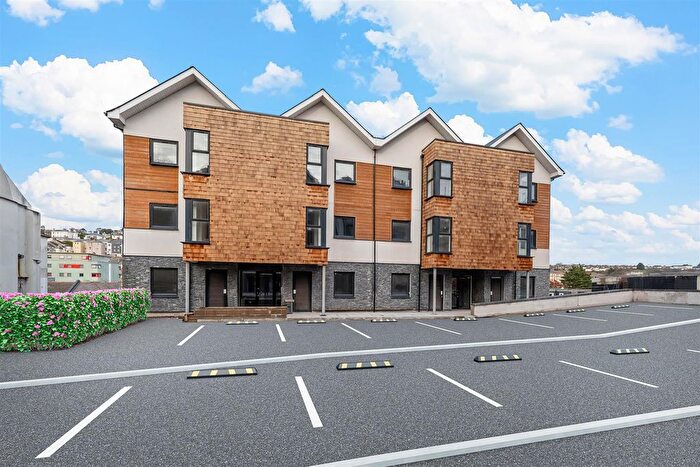
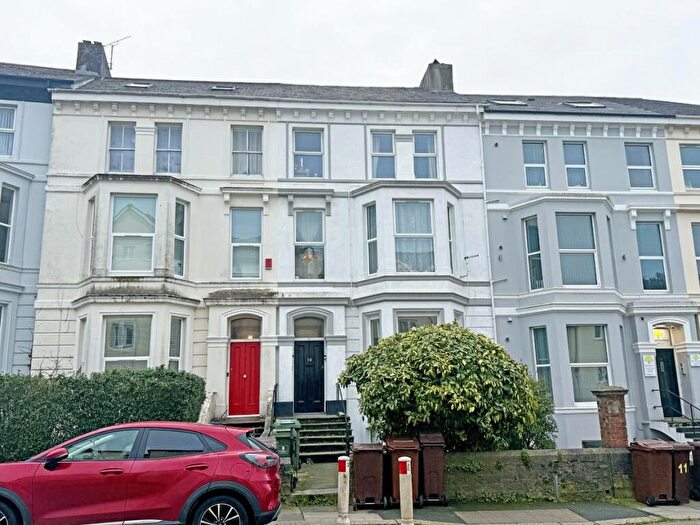
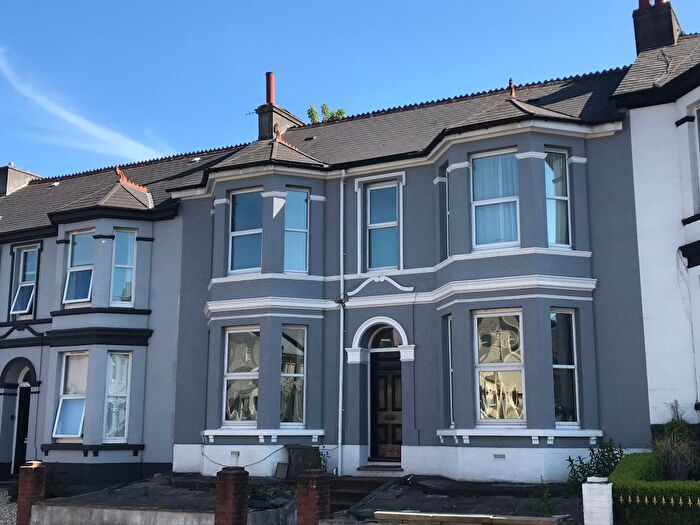
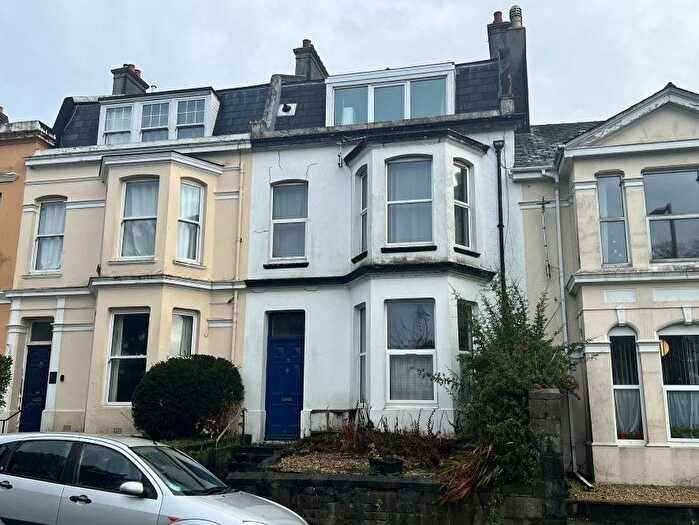
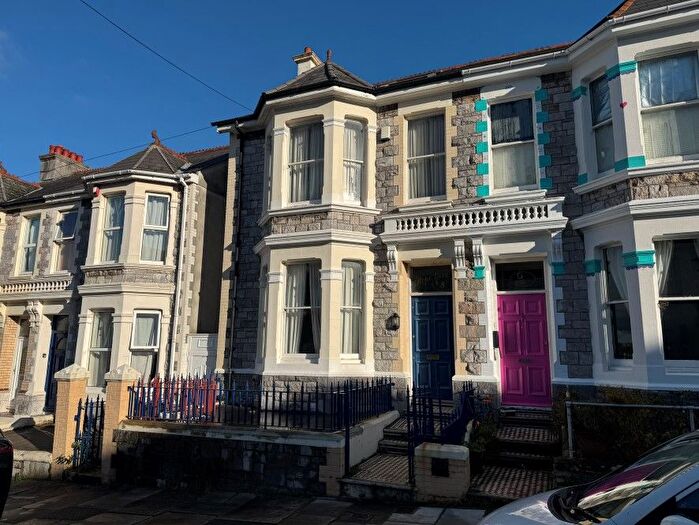
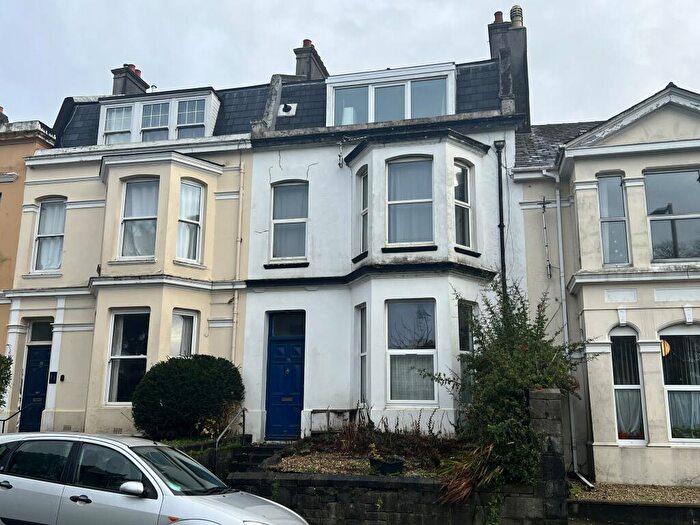
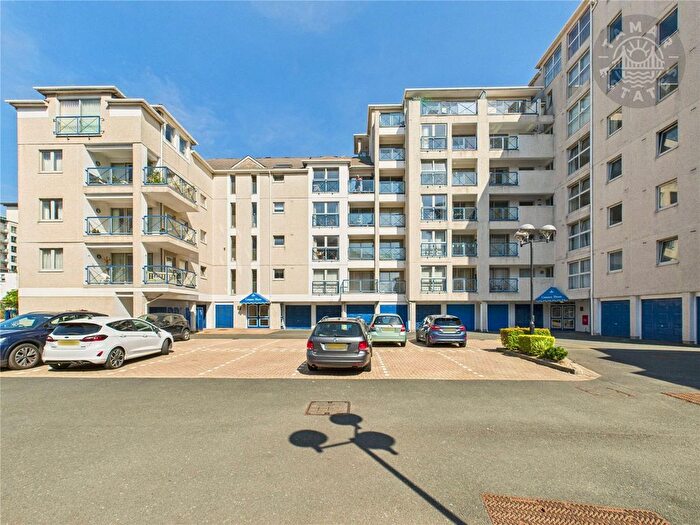
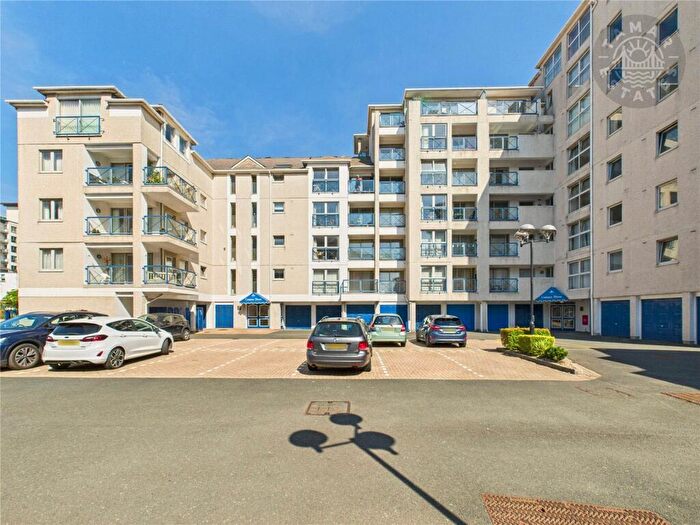
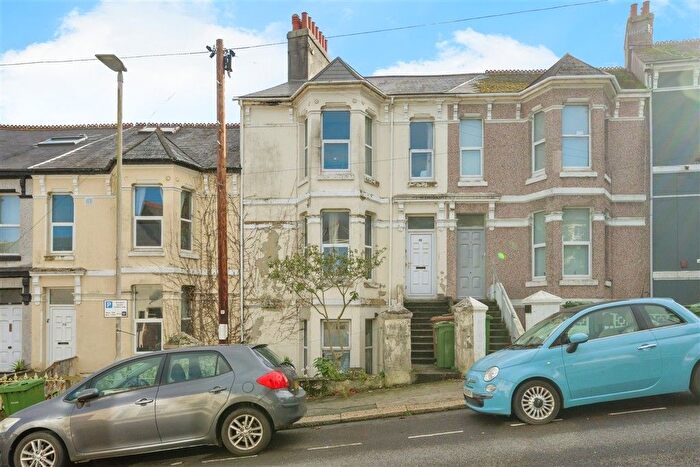
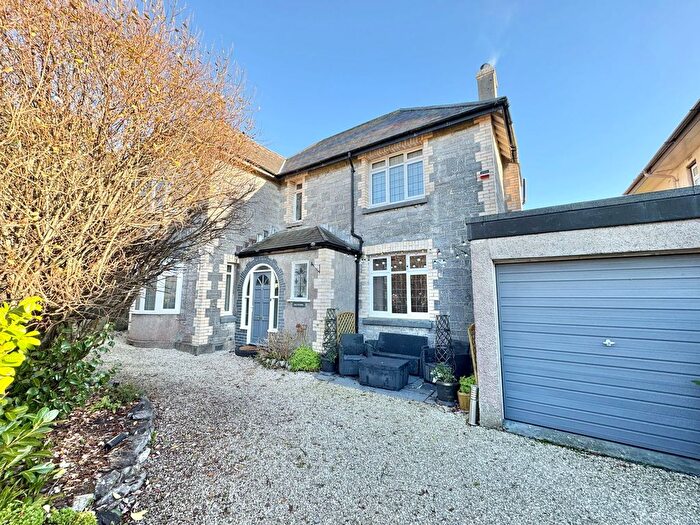
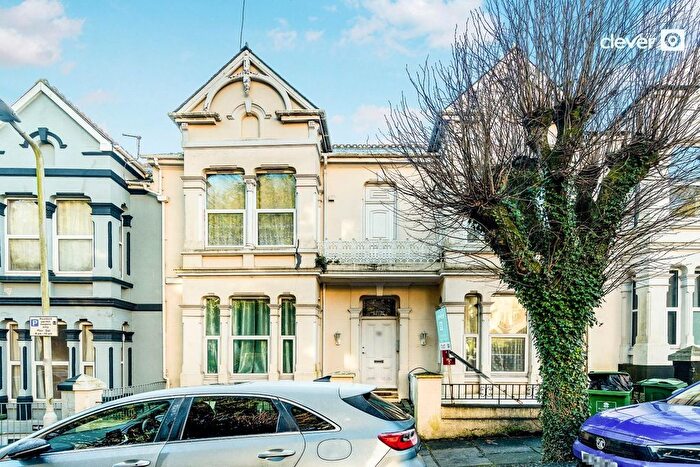
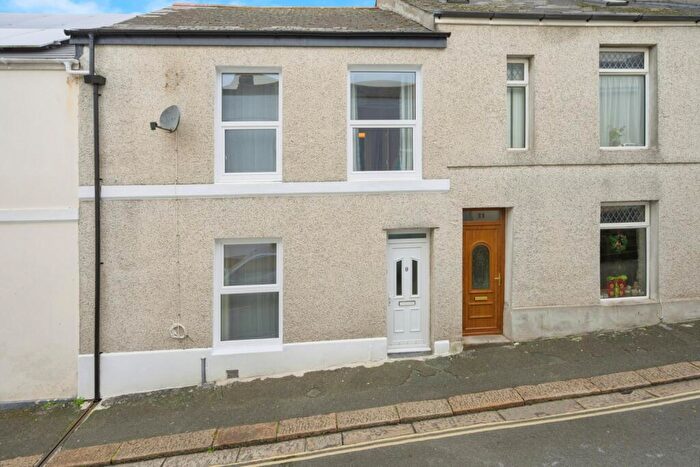
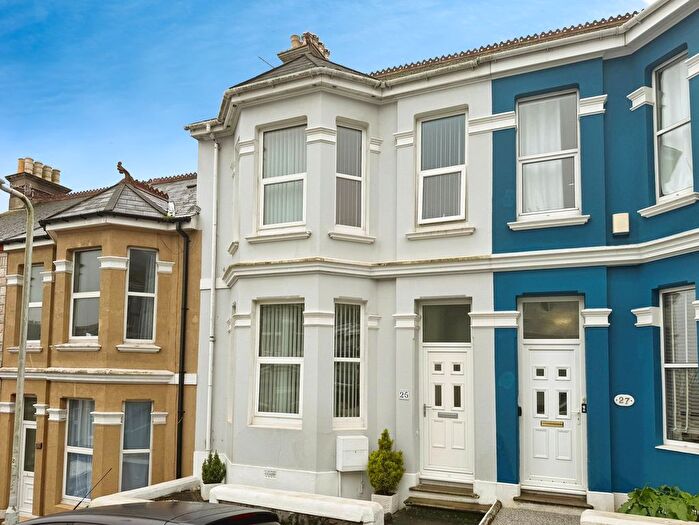
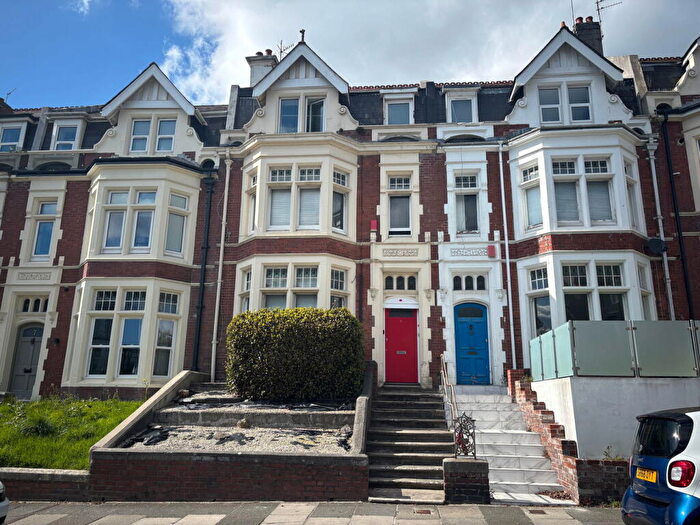
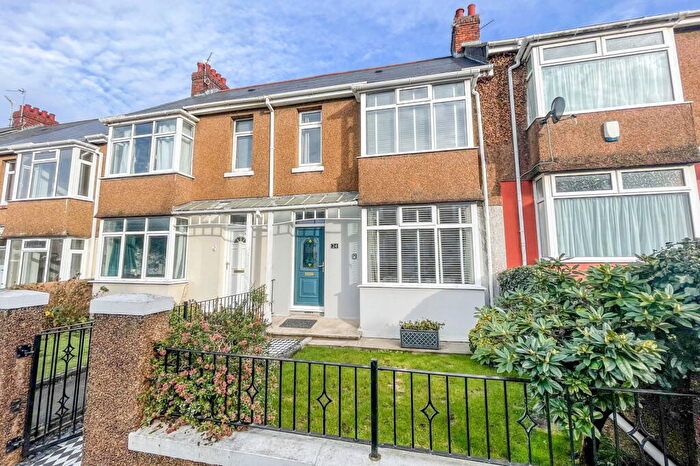
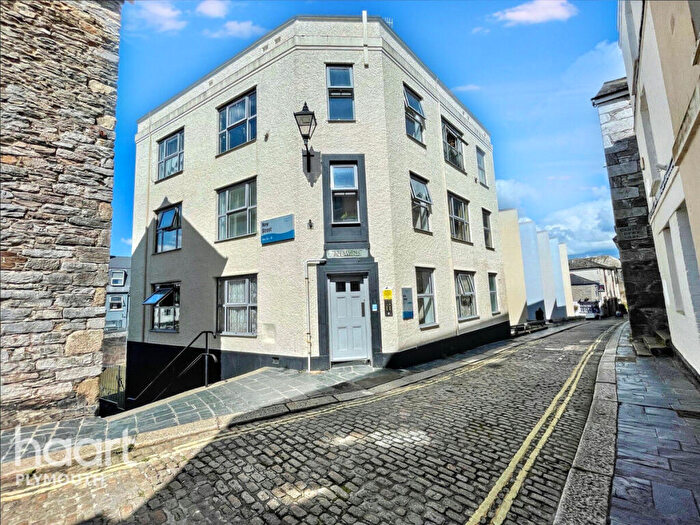
Properties for sale near PL4 6ES, Nottingham Gardens


![]()
If you are looking to sell your house, let it out, or receive a property valuation, an expert can help you.
Click the button below to get started.


Price Paid in Nottingham Gardens, PL4 6ES, Drake
3 Nottingham Gardens, PL4 6ES, Drake Plymouth
Property 3 has been sold 5 times. The last time it was sold was in 16/09/2021 and the sold price was £152,500.00.
This terraced house, sold as a freehold on 16/09/2021, is a 121 sqm end-terrace house with an EPC rating of C.
| Date | Price | Property Type | Tenure | Classification |
|---|---|---|---|---|
| 16/09/2021 | £152,500.00 | Terraced House | freehold | Established Building |
| 24/04/2009 | £155,000.00 | Terraced House | freehold | Established Building |
| 05/10/2007 | £163,000.00 | Terraced House | freehold | Established Building |
| 22/11/2004 | £105,000.00 | Terraced House | freehold | Established Building |
| 23/07/1999 | £48,950.00 | Terraced House | freehold | Established Building |
2 Nottingham Gardens, PL4 6ES, Drake Plymouth
Property 2 has been sold 1 time. The last time it was sold was in 14/11/2019 and the sold price was £250,000.00.
This terraced house, sold as a freehold on 14/11/2019, is a 150 sqm mid-terrace house with an EPC rating of E.
| Date | Price | Property Type | Tenure | Classification |
|---|---|---|---|---|
| 14/11/2019 | £250,000.00 | Terraced House | freehold | Established Building |
Transport near PL4 6ES, Nottingham Gardens
-
 Plymouth Station
 -
Devonport Station
-
Dockyard Station
-
Keyham Station
-
St.Budeaux Ferry Road Station
-
St.Budeaux Victoria Road Station
House price paid reports for PL4 6ES, Nottingham Gardens
Click on the buttons below to see price paid reports by year or property price:
- Price Paid By Year
Property Price Paid in PL4 6ES, Nottingham Gardens by Year
The average sold property price by year was:
| Year | Average Sold Price | Price Change |
Sold Properties
|
|---|---|---|---|
| 2021 | £152,500 | -64% |
1 Property |
| 2019 | £250,000 | 38% |
1 Property |
| 2009 | £155,000 | -5% |
1 Property |
| 2007 | £163,000 | 36% |
1 Property |
| 2004 | £105,000 | 53% |
1 Property |
| 1999 | £48,950 | - |
1 Property |