
Houses for sale & to rent in Charles Dickens, Portsmouth
House Prices in Charles Dickens
Properties in Charles Dickens have an average house price of £188,699.00 and had 251 Property Transactions within the last 3 years¹.
Charles Dickens is an area in Portsmouth, City of Portsmouth with 6,727 households², where the most expensive property was sold for £1,030,000.00.
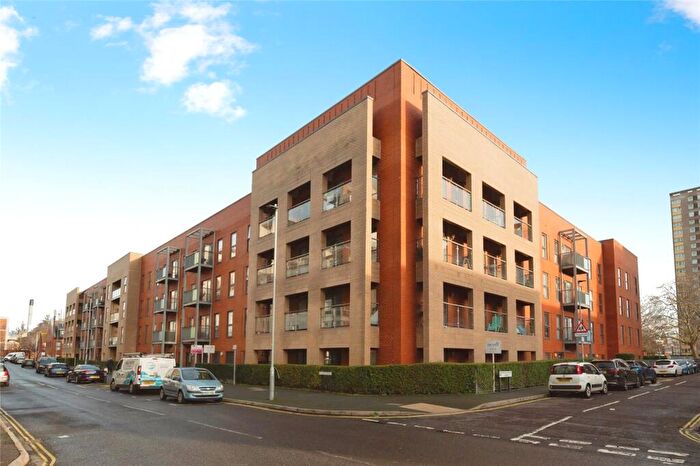
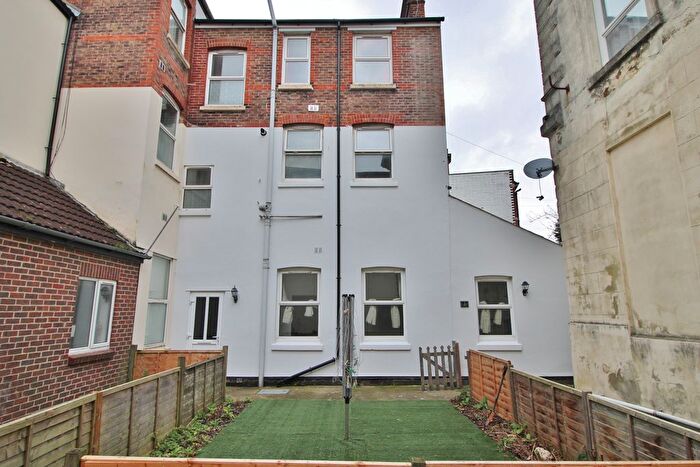
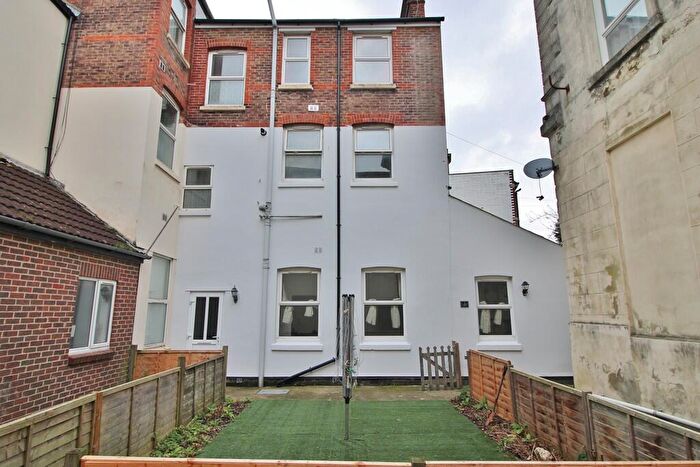
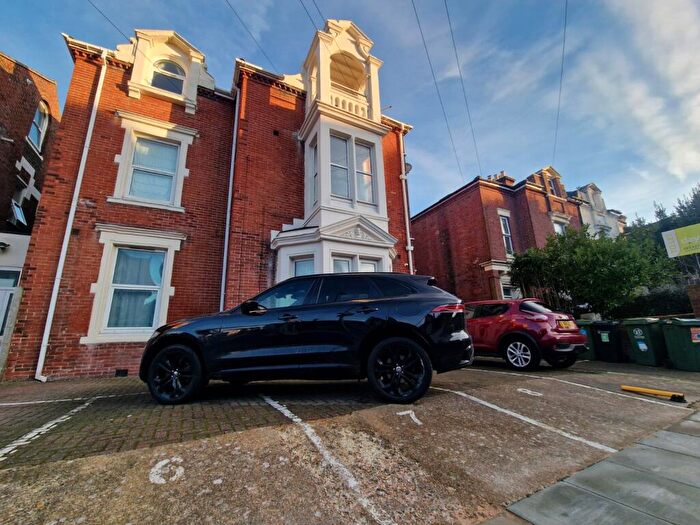
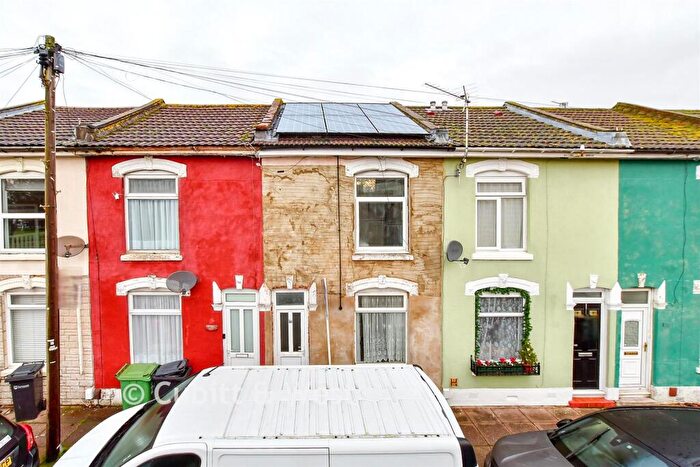
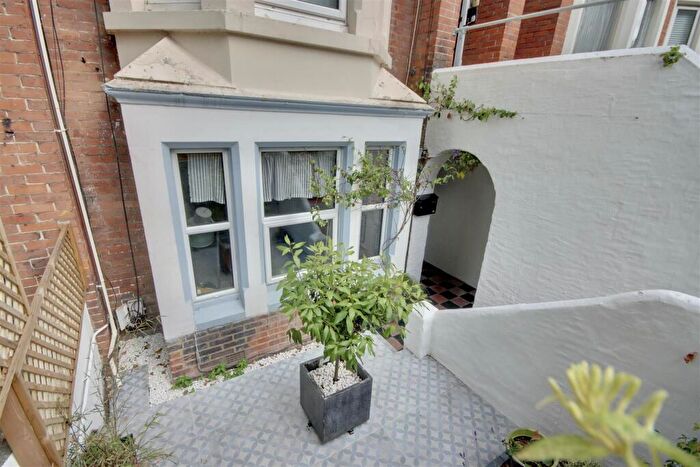
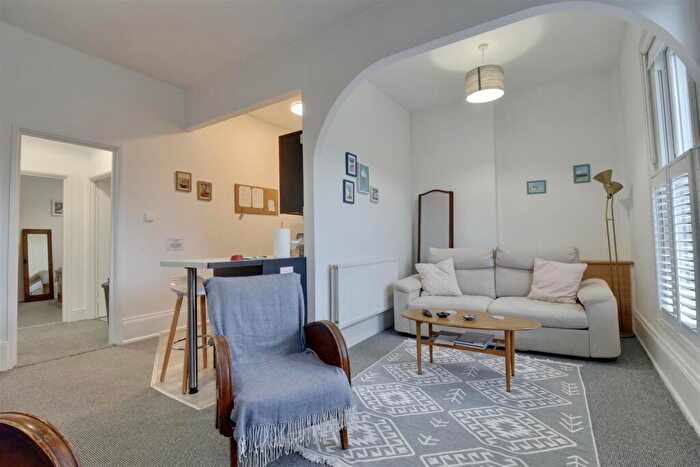
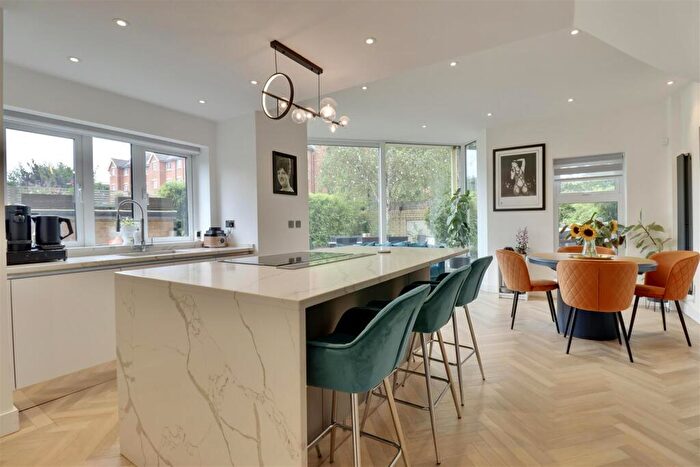
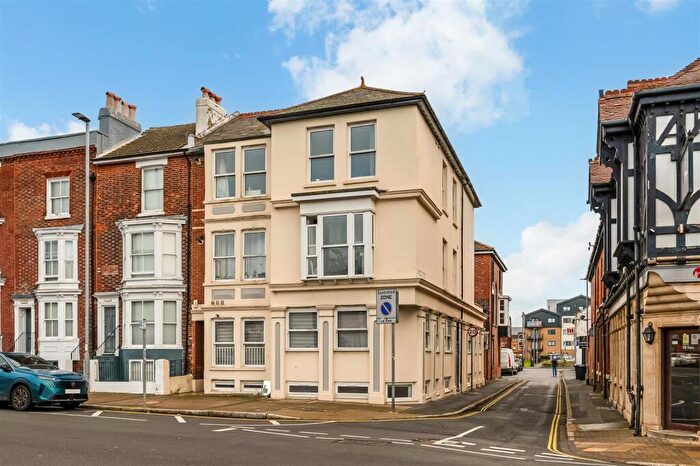
Properties for sale in Charles Dickens

![]()
If you are looking to sell your house, let it out, or receive a property valuation, an expert can help you.
Click the button below to get started.


Roads and Postcodes in Charles Dickens
Navigate through our locations to find the location of your next house in Charles Dickens, Portsmouth for sale or to rent.
Transport near Charles Dickens
-
 Portsmouth and Southsea Station
 -
Fratton Station
-
Portsmouth Harbour Station
-
Hilsea Station
-
Cosham Station
- FAQ
- Price Paid By Year
- Property Type Price
Frequently asked questions about Charles Dickens
What is the average price for a property for sale in Charles Dickens?
The average price for a property for sale in Charles Dickens is £188,699. This amount is 31% lower than the average price in Portsmouth. There are 2,139 property listings for sale in Charles Dickens.
What streets have the most expensive properties for sale in Charles Dickens?
The streets with the most expensive properties for sale in Charles Dickens are Sun Street at an average of £340,500, Sea Mill Gardens at an average of £297,500 and All Saints Road at an average of £265,000.
What streets have the most affordable properties for sale in Charles Dickens?
The streets with the most affordable properties for sale in Charles Dickens are Nutfield Place at an average of £77,500, Commercial Road at an average of £100,000 and Arundel Street at an average of £102,318.
Which train stations are available in or near Charles Dickens?
Some of the train stations available in or near Charles Dickens are Portsmouth and Southsea, Fratton and Portsmouth Harbour.
Property Price Paid in Charles Dickens by Year
The average sold property price by year was:
| Year | Average Sold Price | Price Change |
Sold Properties
|
|---|---|---|---|
| 2025 | £190,978 | 9% |
23 Properties |
| 2024 | £173,090 | -26% |
74 Properties |
| 2023 | £217,976 | 17% |
64 Properties |
| 2022 | £180,133 | 4% |
90 Properties |
| 2021 | £173,265 | -2% |
117 Properties |
| 2020 | £177,189 | 18% |
83 Properties |
| 2019 | £146,120 | -31% |
148 Properties |
| 2018 | £191,167 | 7% |
143 Properties |
| 2017 | £178,702 | 13% |
221 Properties |
| 2016 | £155,148 | 11% |
136 Properties |
| 2015 | £138,286 | 4% |
154 Properties |
| 2014 | £132,492 | 9% |
139 Properties |
| 2013 | £120,884 | 0,4% |
89 Properties |
| 2012 | £120,386 | -4% |
53 Properties |
| 2011 | £125,306 | -15% |
68 Properties |
| 2010 | £144,113 | -9% |
91 Properties |
| 2009 | £156,403 | -7% |
153 Properties |
| 2008 | £166,979 | 3% |
250 Properties |
| 2007 | £161,195 | 25% |
285 Properties |
| 2006 | £121,570 | 11% |
120 Properties |
| 2005 | £108,111 | 10% |
69 Properties |
| 2004 | £97,551 | -1% |
121 Properties |
| 2003 | £98,603 | 8% |
135 Properties |
| 2002 | £90,542 | 32% |
118 Properties |
| 2001 | £61,339 | 4% |
96 Properties |
| 2000 | £59,083 | 14% |
82 Properties |
| 1999 | £50,958 | -107% |
63 Properties |
| 1998 | £105,413 | 55% |
64 Properties |
| 1997 | £47,873 | 13% |
61 Properties |
| 1996 | £41,413 | -2% |
48 Properties |
| 1995 | £42,058 | - |
46 Properties |
Property Price per Property Type in Charles Dickens
Here you can find historic sold price data in order to help with your property search.
The average Property Paid Price for specific property types in the last three years are:
| Property Type | Average Sold Price | Sold Properties |
|---|---|---|
| Terraced House | £227,414.00 | 80 Terraced Houses |
| Flat | £153,022.00 | 158 Flats |
| Semi Detached House | £381,135.00 | 11 Semi Detached Houses |
| Detached House | £400,250.00 | 2 Detached Houses |