
Houses for sale & to rent in SO15 5HE, St James Road, Shirley, Southampton
House Prices in SO15 5HE, St James Road, Shirley
Properties in SO15 5HE have no sales history available within the last 3 years. SO15 5HE is a postcode in St James Road located in Shirley, an area in Southampton, City of Southampton, with 5 households².
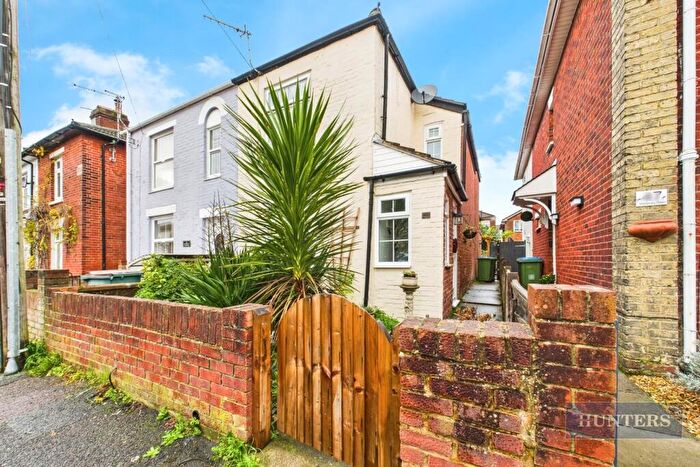
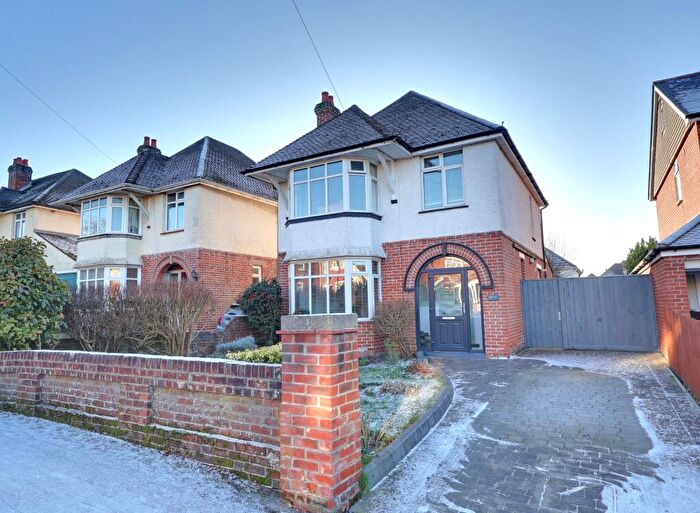
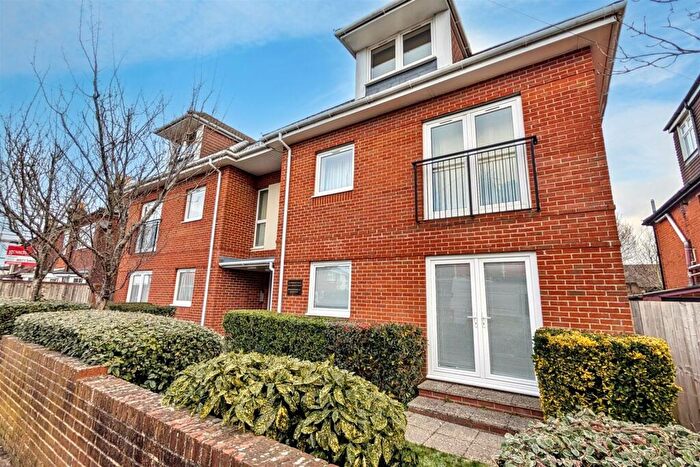
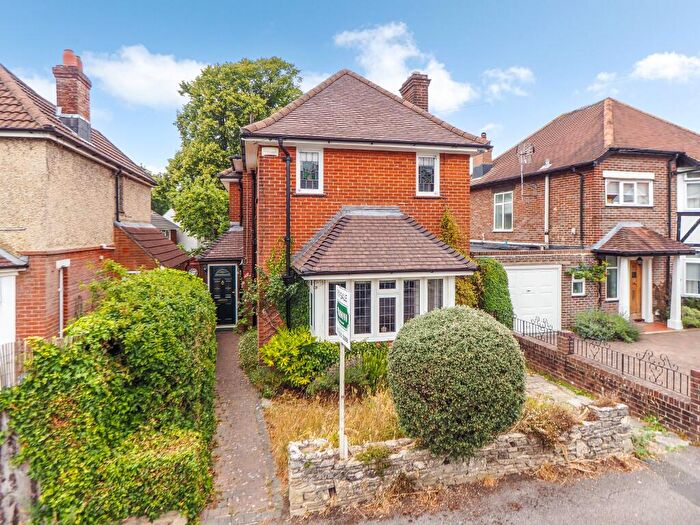
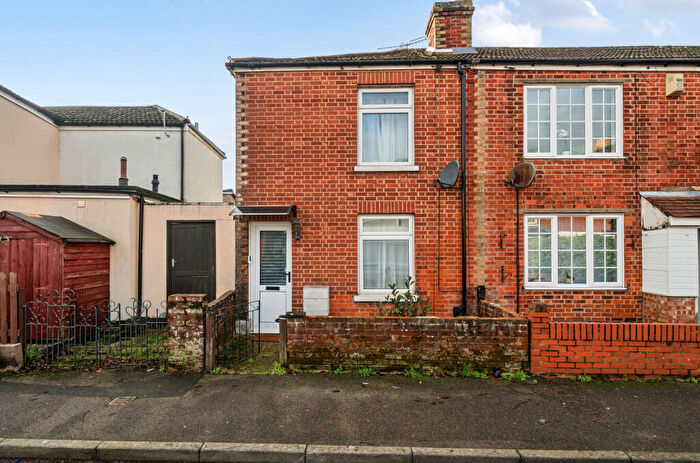
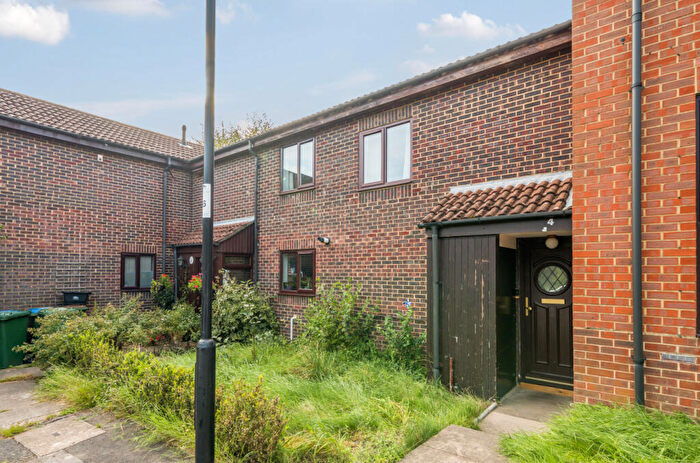
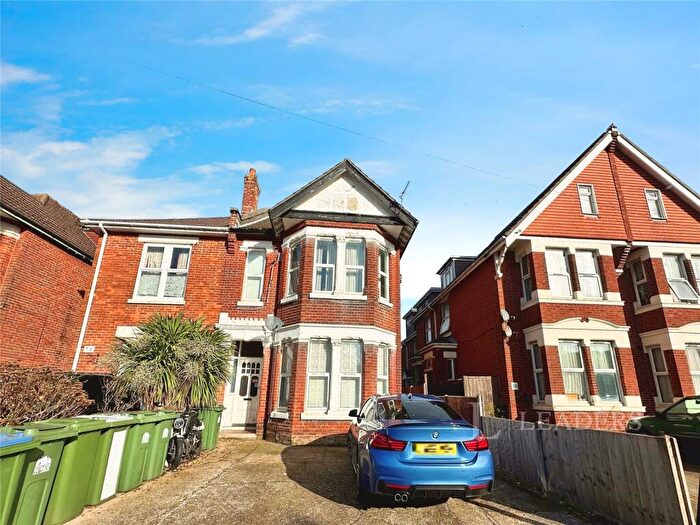
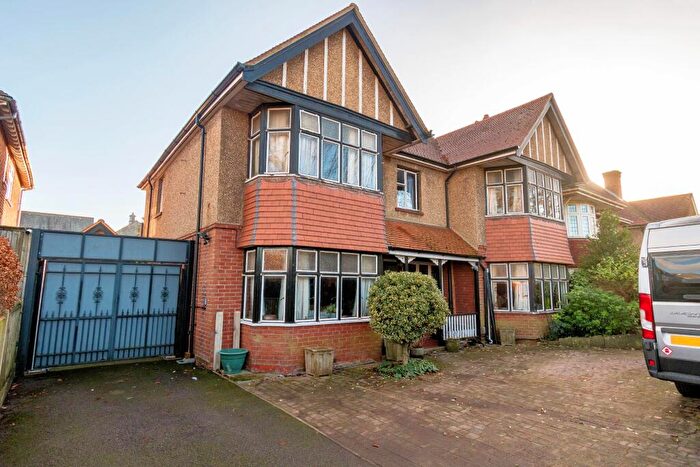
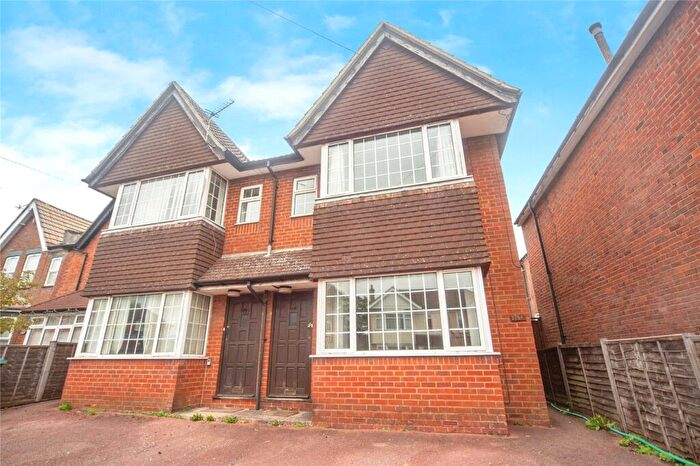
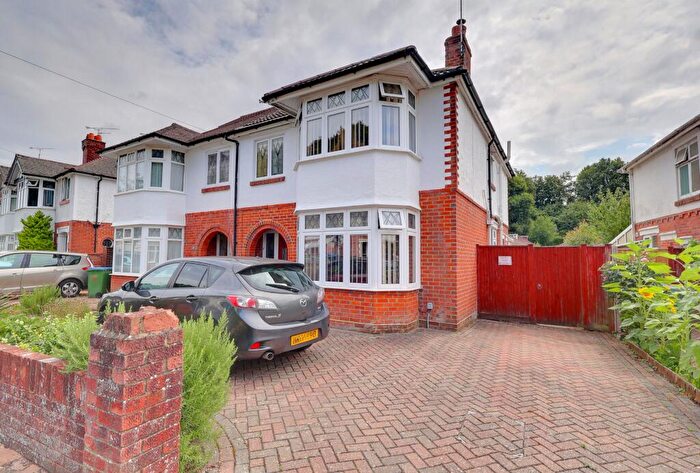
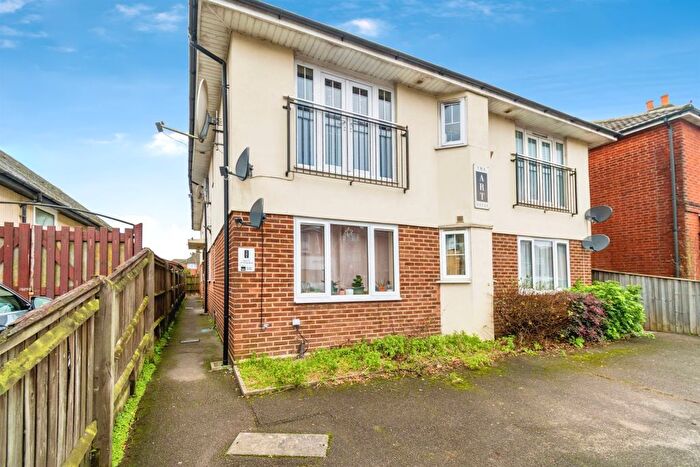
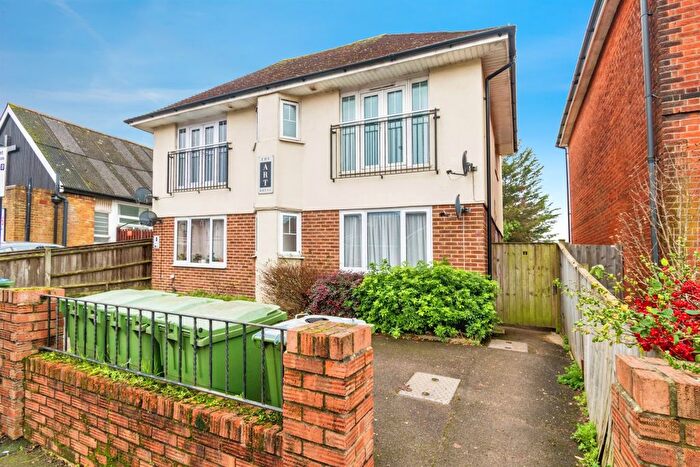
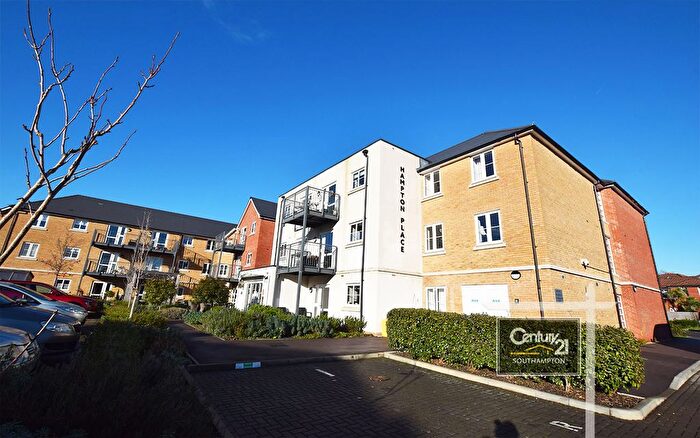
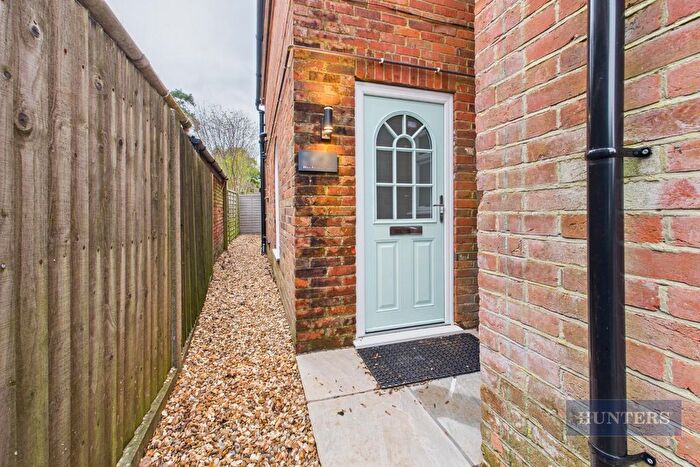
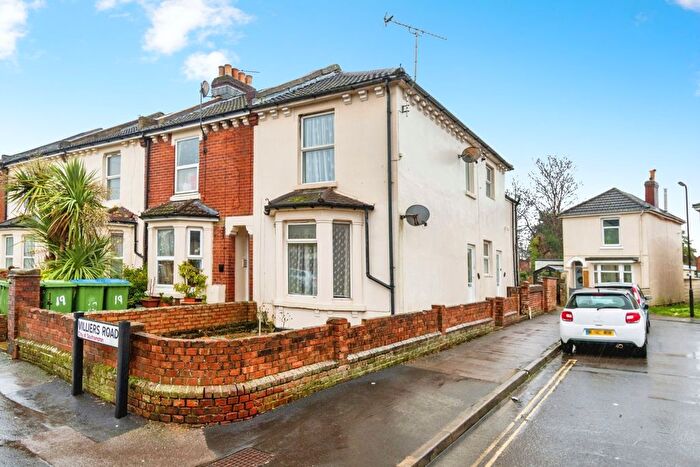
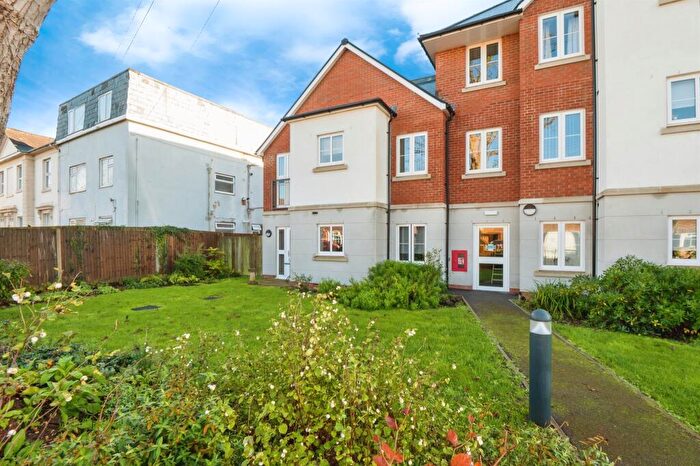
Properties for sale near SO15 5HE, St James Road


![]()
If you are looking to sell your house, let it out, or receive a property valuation, an expert can help you.
Click the button below to get started.


Price Paid in St James Road, SO15 5HE, Shirley
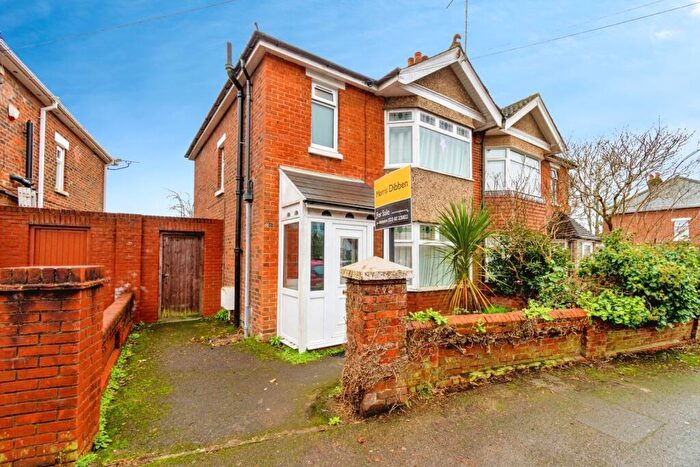
117 St James Road, SO15 5HE, Shirley Southampton
Property 117 has been sold 3 times. The last time it was sold was in 05/10/2012 and the sold price was £355,000.00.
This semi detached house, sold as a freehold on 05/10/2012, is a 152 sqm semi-detached house with an EPC rating of C.
| Date | Price | Property Type | Tenure | Classification |
|---|---|---|---|---|
| 05/10/2012 | £355,000.00 | Semi Detached House | freehold | Established Building |
| 26/04/2006 | £262,500.00 | Semi Detached House | freehold | Established Building |
| 28/02/1997 | £94,000.00 | Semi Detached House | freehold | Established Building |
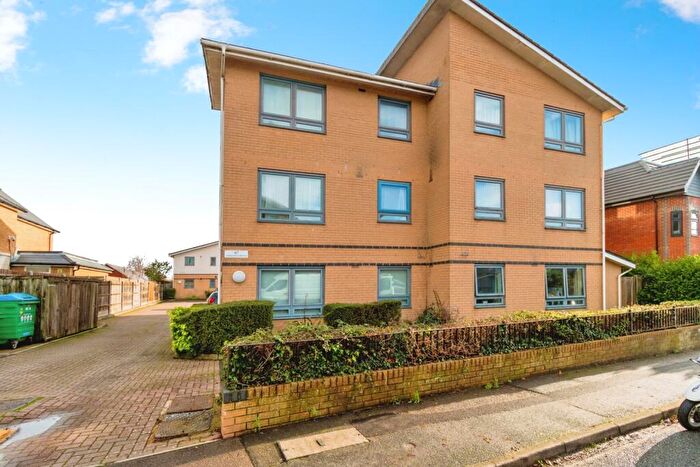
115 St James Road, SO15 5HE, Shirley Southampton
Property 115 has been sold 1 time. The last time it was sold was in 18/05/2004 and the sold price was £270,000.00.
This semi detached house, sold as a freehold on 18/05/2004, is a 186 sqm semi-detached house with an EPC rating of D.
| Date | Price | Property Type | Tenure | Classification |
|---|---|---|---|---|
| 18/05/2004 | £270,000.00 | Semi Detached House | freehold | Established Building |
Postcodes in St James Road, Shirley
Navigate through other locations in St James Road, Shirley, Southampton to see more property listings for sale or to rent.
Transport near SO15 5HE, St James Road
-
 Millbrook (Hampshire) Station
 -
Southampton Central Station
-
St.Denys Station
-
Redbridge Station
-
Bitterne Station
-
Swaythling Station
-
Totton Station
-
Woolston Station
House price paid reports for SO15 5HE, St James Road
Click on the buttons below to see price paid reports by year or property price:
- Price Paid By Year
Property Price Paid in SO15 5HE, St James Road by Year
The average sold property price by year was:
| Year | Average Sold Price | Price Change |
Sold Properties
|
|---|---|---|---|
| 2012 | £355,000 | 26% |
1 Property |
| 2006 | £262,500 | -3% |
1 Property |
| 2004 | £270,000 | 65% |
1 Property |
| 1997 | £94,000 | - |
1 Property |