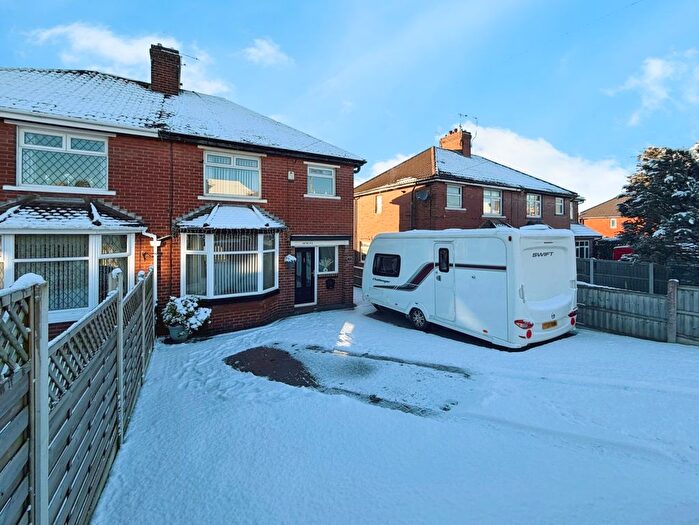
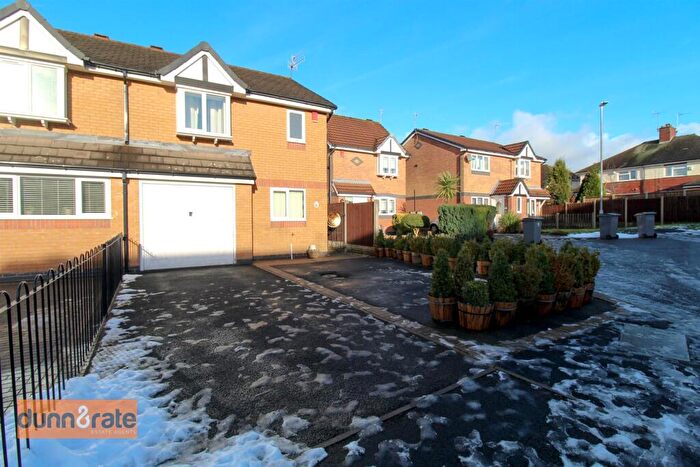
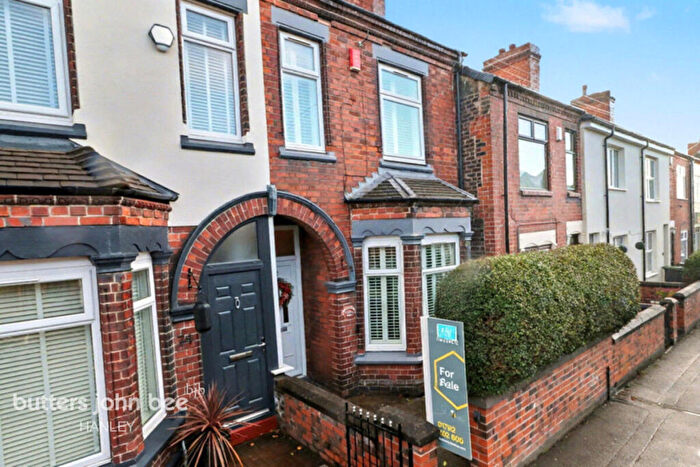
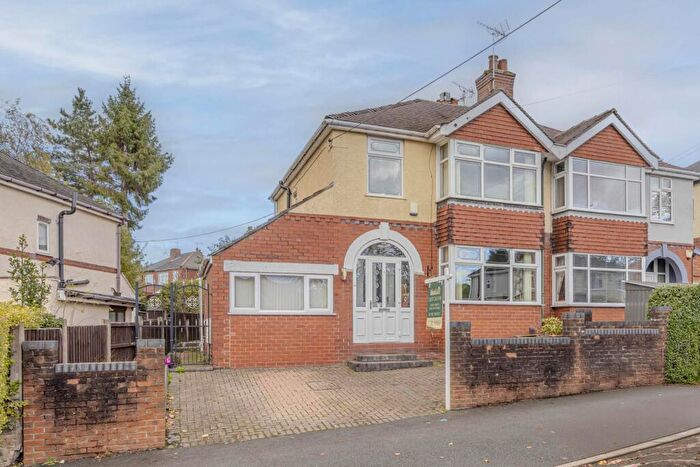
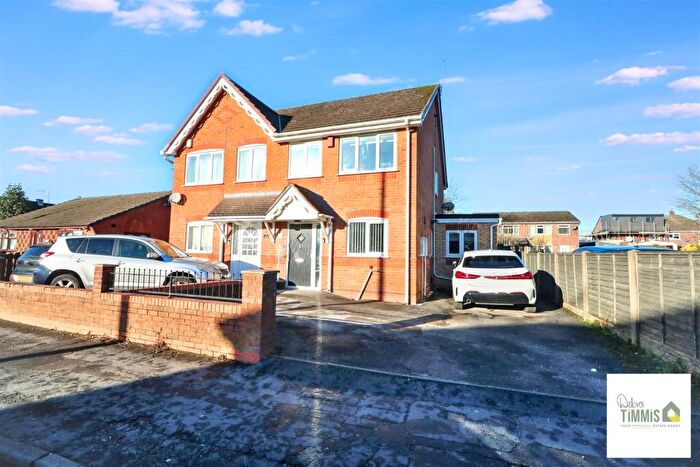
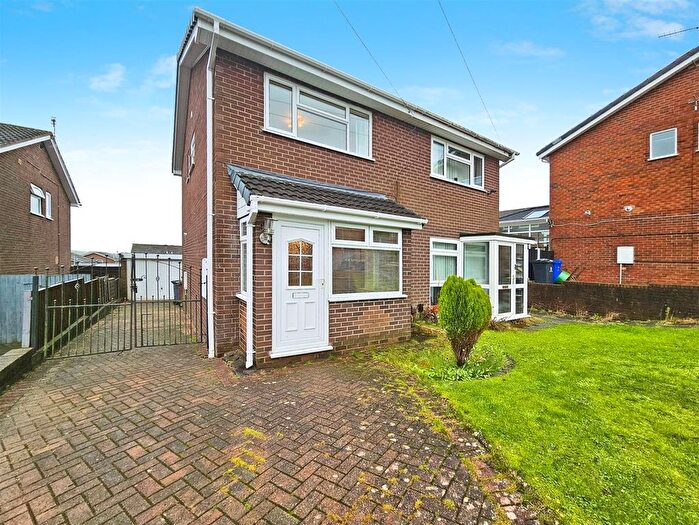
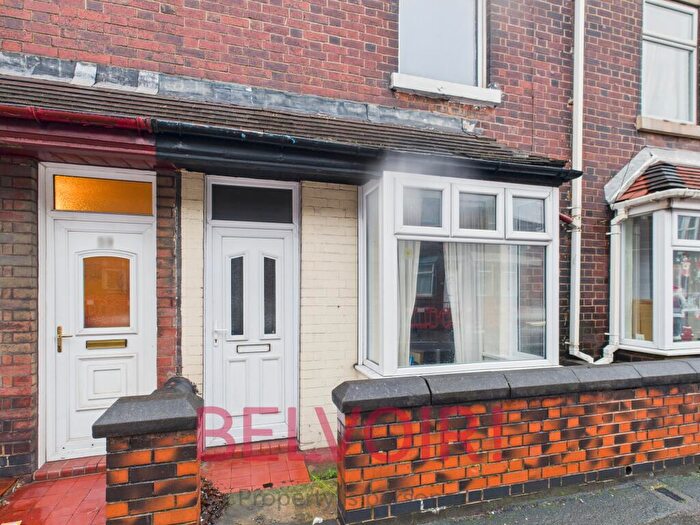
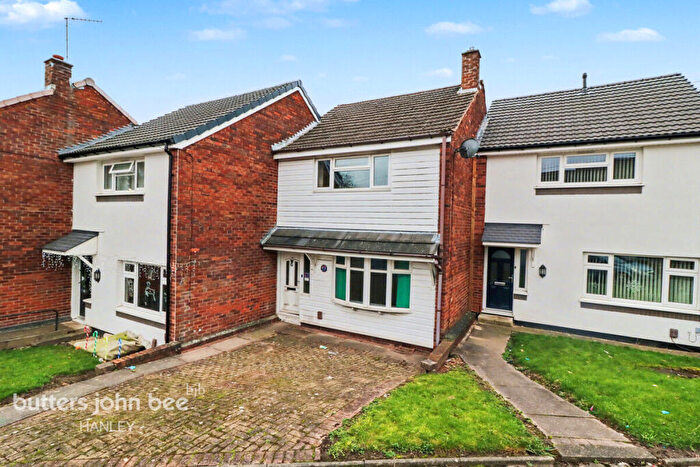
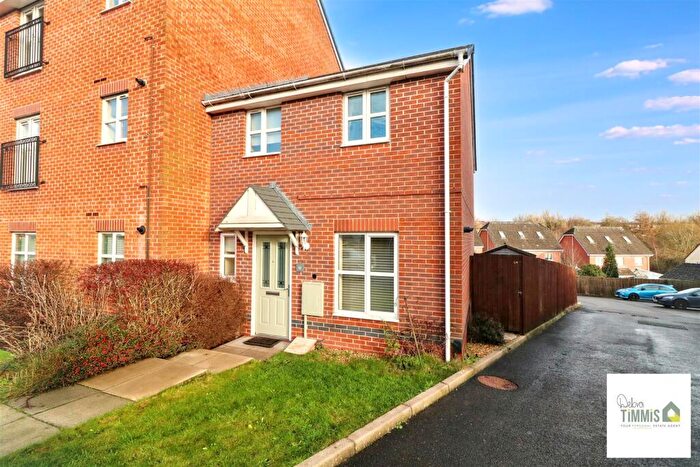
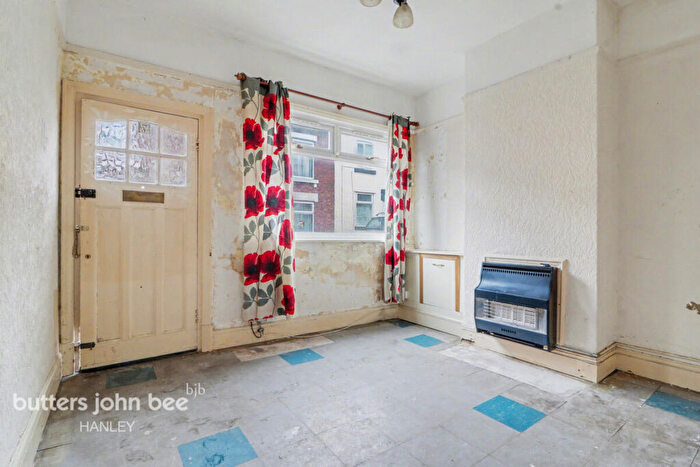
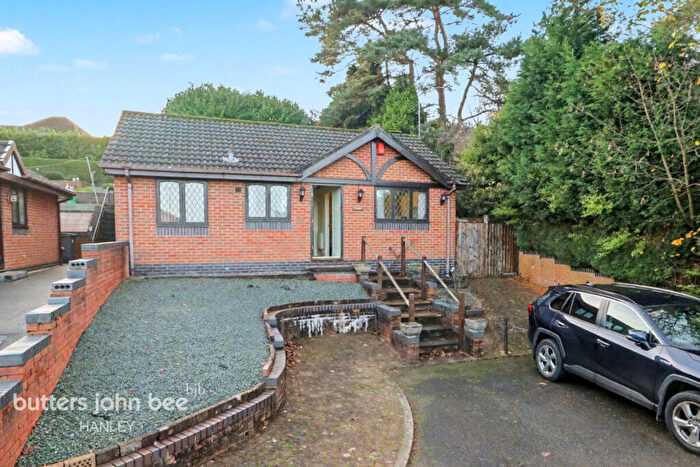
Houses for sale & to rent in Sneyd Green, Stoke-on-trent
House Prices in Sneyd Green
Properties in Sneyd Green have an average house price of £157,717.00 and had 267 Property Transactions within the last 3 years¹.
Sneyd Green is an area in Stoke-on-trent, City of Stoke-on-Trent with 2,247 households², where the most expensive property was sold for £320,000.00.
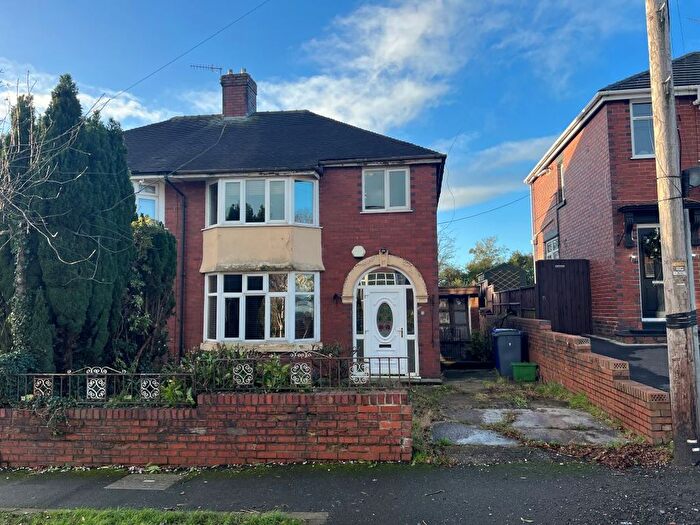
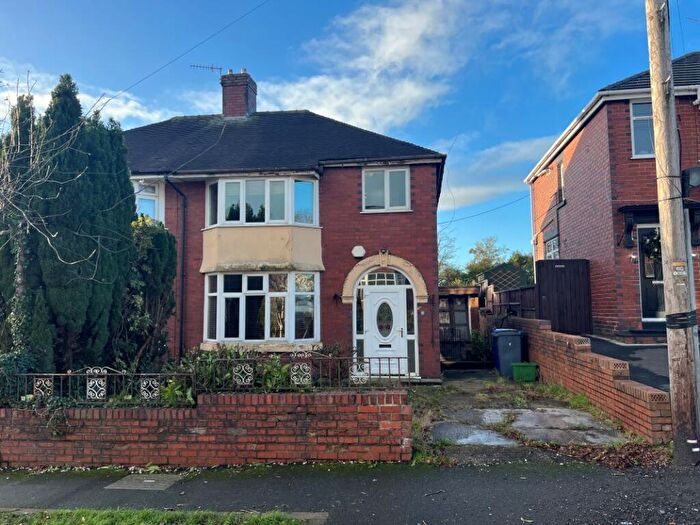
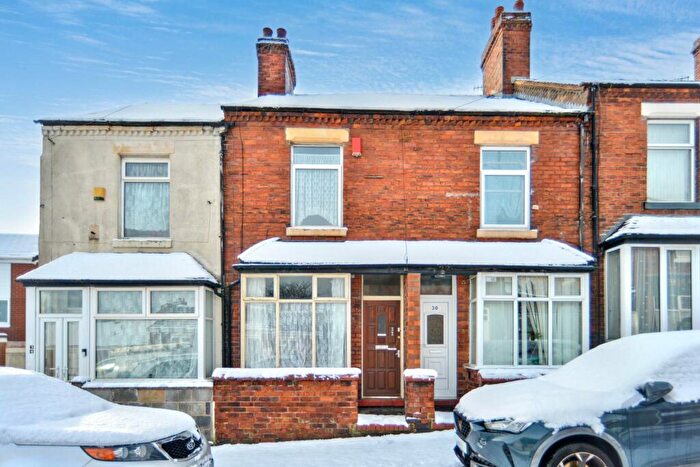
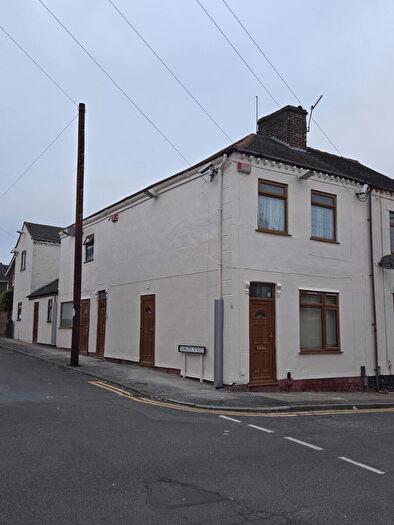
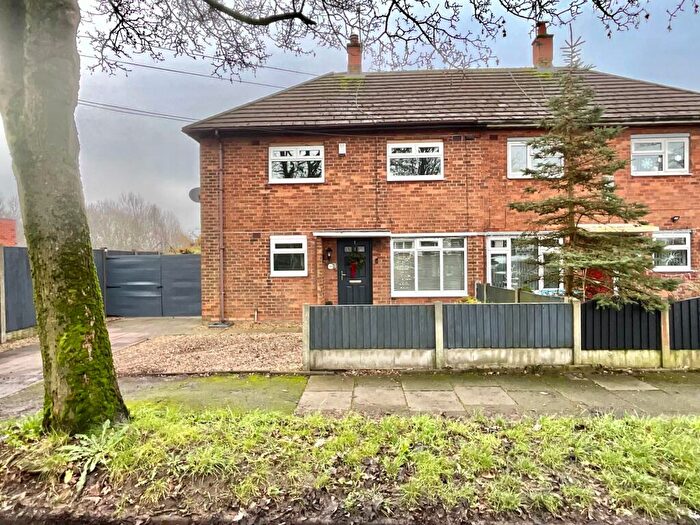
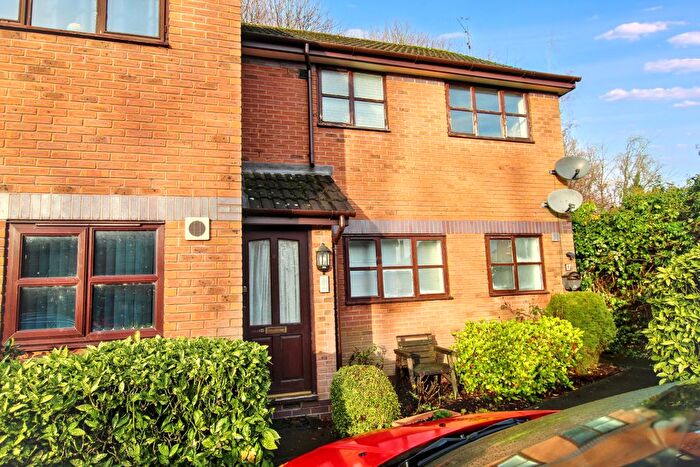
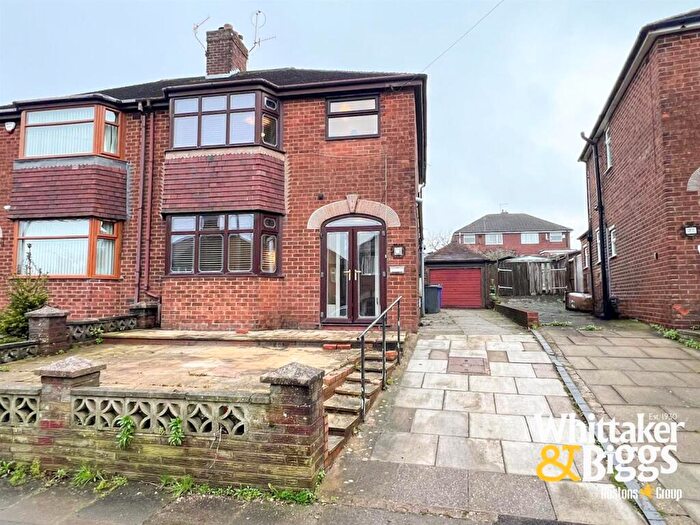
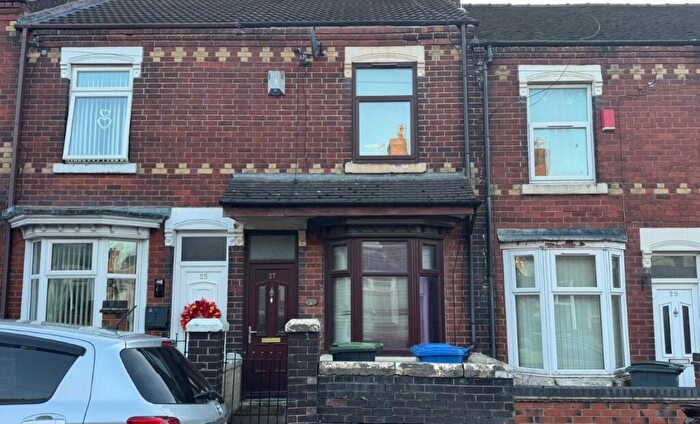
Properties for sale in Sneyd Green
Roads and Postcodes in Sneyd Green
Navigate through our locations to find the location of your next house in Sneyd Green, Stoke-on-trent for sale or to rent.
| Streets | Postcodes |
|---|---|
| Abbotts Drive | ST1 6HU ST1 6HX |
| Arkwright Grove | ST1 6JZ |
| Aveling Green | ST1 6LB |
| Aveling Road | ST1 6LA |
| Bagot Grove | ST1 6JD ST1 6JF |
| Berwick Road | ST1 6EP ST1 6ER |
| Birch Green Grove | ST1 6RD |
| Bouverie Parade | ST1 6JH ST1 6JL |
| Brocklehurst Way | ST1 6HN ST1 6HW |
| Burton Crescent | ST1 6BT |
| Buxton Street | ST1 6BN ST1 6BW |
| Carlyon Place | ST1 6EA |
| Chertsey Place | ST1 6EB |
| Churston Place | ST1 6ED |
| Courtway Drive | ST1 6DU ST1 6DX |
| Cranleigh Avenue | ST1 6EE |
| Derek Drive | ST1 6BX ST1 6BY |
| Dunsany Grove | ST1 6BZ |
| East Crescent | ST1 6ES |
| Eastbridge Avenue | ST1 6DQ |
| Emery Avenue | ST1 6ET |
| Fitzherbert Road | ST1 6JA ST1 6JB ST1 6JE |
| Gordon Crescent | ST1 6BU |
| Haliford Avenue | ST1 6DL |
| Hanley Road | ST1 6BL ST1 6DB ST1 6DG ST1 6UU |
| Kelvin Avenue | ST1 6BP ST1 6BS |
| Kingsclere Grove | ST1 6HQ |
| Kingston Avenue | ST1 6HG |
| Lane Farm Grove | ST1 6HP |
| Langdale Crescent | ST1 6DR |
| Leek New Road | ST1 6EJ ST1 6EQ |
| Louvain Avenue | ST1 6DP |
| Marston Grove | ST1 6EF |
| Melrose Avenue | ST1 6DS |
| Milgreen Avenue | ST1 6DT |
| Milton Road | ST1 6HD ST1 6HF ST1 6HH ST1 6HS ST1 6HT ST1 6LE ST1 6JU ST1 6LG |
| Mornington Road | ST1 6EL ST1 6EN ST1 6HB |
| Moss Side | ST1 6EX |
| Mowbray Walk | ST1 6JY |
| Moxley Avenue | ST1 6DW |
| Noblett Road | ST1 6HJ ST1 6HR |
| Oxford Avenue | ST1 6DJ |
| Pleydell Street | ST1 6JN |
| Ralph Drive | ST1 6HY ST1 6HZ ST1 6JG ST1 6JQ ST1 6JR ST1 6JS |
| Raymond Avenue | ST1 6DN |
| Repington Road | ST1 6JT ST1 6JX |
| Richmond Avenue | ST1 6DH |
| Rosemary Place | ST1 6HL |
| Rothsay Avenue | ST1 6EY ST1 6EZ |
| Salcombe Place | ST1 6DY |
| Sandiway Place | ST1 6SQ |
| Sefton Avenue | ST1 6HA |
| Sidcot Place | ST1 6DZ |
| St Margarets Drive | ST1 6EW |
| Tor Street | ST1 6HE |
| Tyrell Grove | ST1 6LD |
| Wentworth Grove | ST1 6JP ST1 6JW |
| West Crescent | ST1 6EU |
Transport near Sneyd Green
- FAQ
- Price Paid By Year
- Property Type Price
Frequently asked questions about Sneyd Green
What is the average price for a property for sale in Sneyd Green?
The average price for a property for sale in Sneyd Green is £157,717. This amount is 10% higher than the average price in Stoke-on-trent. There are 875 property listings for sale in Sneyd Green.
What streets have the most expensive properties for sale in Sneyd Green?
The streets with the most expensive properties for sale in Sneyd Green are Derek Drive at an average of £204,496, Burton Crescent at an average of £190,000 and Berwick Road at an average of £183,994.
What streets have the most affordable properties for sale in Sneyd Green?
The streets with the most affordable properties for sale in Sneyd Green are Lane Farm Grove at an average of £98,666, Mowbray Walk at an average of £103,000 and Aveling Road at an average of £105,000.
Which train stations are available in or near Sneyd Green?
Some of the train stations available in or near Sneyd Green are Longport, Stoke-On-Trent and Longton.
Property Price Paid in Sneyd Green by Year
The average sold property price by year was:
| Year | Average Sold Price | Price Change |
Sold Properties
|
|---|---|---|---|
| 2025 | £154,728 | -4% |
38 Properties |
| 2024 | £161,413 | 2% |
69 Properties |
| 2023 | £158,252 | 2% |
75 Properties |
| 2022 | £155,580 | 9% |
85 Properties |
| 2021 | £142,345 | 7% |
81 Properties |
| 2020 | £132,907 | 6% |
63 Properties |
| 2019 | £124,694 | 10% |
89 Properties |
| 2018 | £112,594 | -2% |
83 Properties |
| 2017 | £115,072 | 3% |
74 Properties |
| 2016 | £111,132 | 12% |
84 Properties |
| 2015 | £98,293 | 2% |
80 Properties |
| 2014 | £96,411 | -2% |
68 Properties |
| 2013 | £98,483 | 5% |
57 Properties |
| 2012 | £93,436 | -6% |
46 Properties |
| 2011 | £99,384 | 2% |
35 Properties |
| 2010 | £97,847 | 4% |
37 Properties |
| 2009 | £93,873 | -8% |
34 Properties |
| 2008 | £101,629 | -13% |
50 Properties |
| 2007 | £115,170 | 11% |
81 Properties |
| 2006 | £102,699 | 7% |
85 Properties |
| 2005 | £95,735 | 17% |
72 Properties |
| 2004 | £79,118 | 24% |
90 Properties |
| 2003 | £60,007 | 18% |
94 Properties |
| 2002 | £49,252 | 7% |
92 Properties |
| 2001 | £45,957 | 8% |
69 Properties |
| 2000 | £42,238 | -10% |
85 Properties |
| 1999 | £46,278 | 15% |
62 Properties |
| 1998 | £39,454 | -3% |
58 Properties |
| 1997 | £40,822 | 14% |
81 Properties |
| 1996 | £35,087 | -4% |
84 Properties |
| 1995 | £36,402 | - |
80 Properties |
Property Price per Property Type in Sneyd Green
Here you can find historic sold price data in order to help with your property search.
The average Property Paid Price for specific property types in the last three years are:
| Property Type | Average Sold Price | Sold Properties |
|---|---|---|
| Semi Detached House | £155,525.00 | 200 Semi Detached Houses |
| Detached House | £204,234.00 | 34 Detached Houses |
| Terraced House | £125,028.00 | 32 Terraced Houses |
| Flat | £60,500.00 | 1 Flat |

