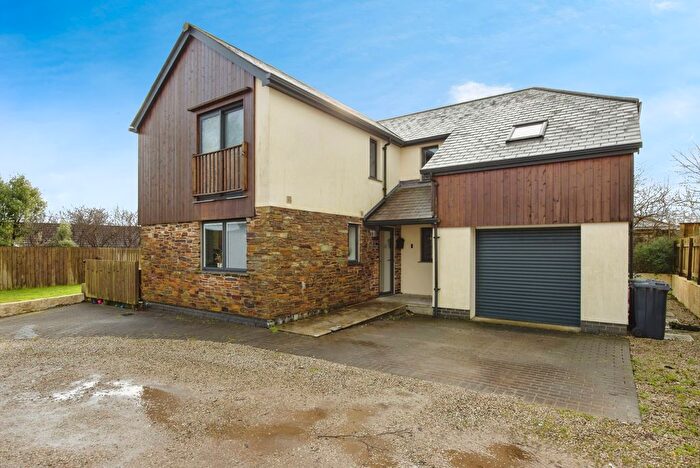
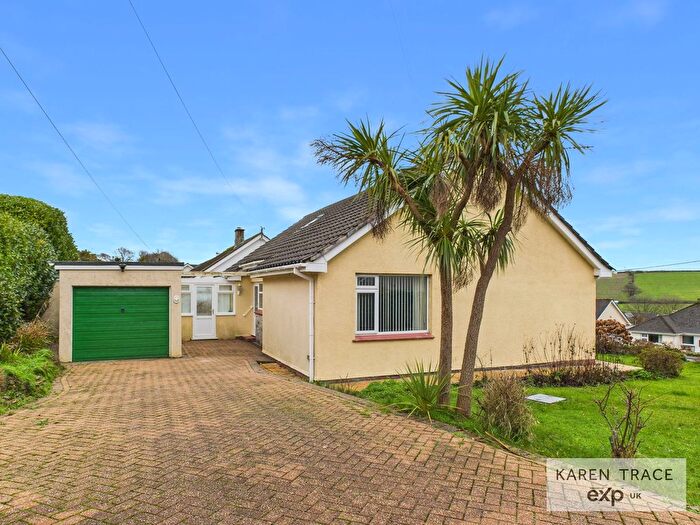
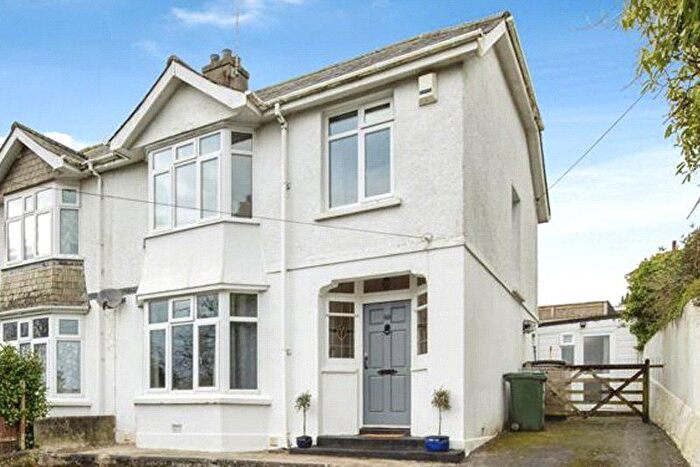
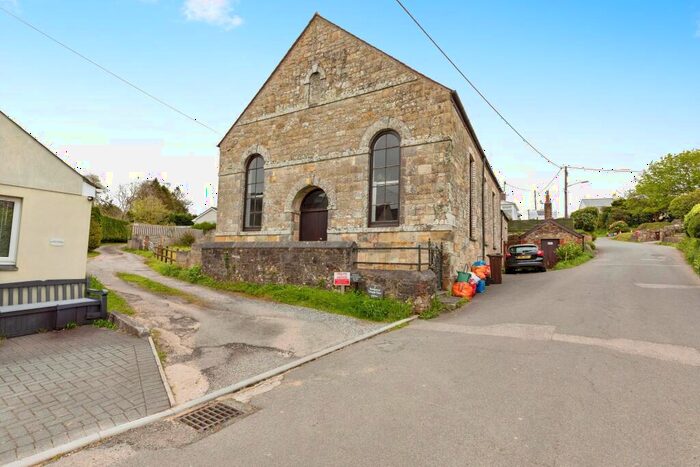
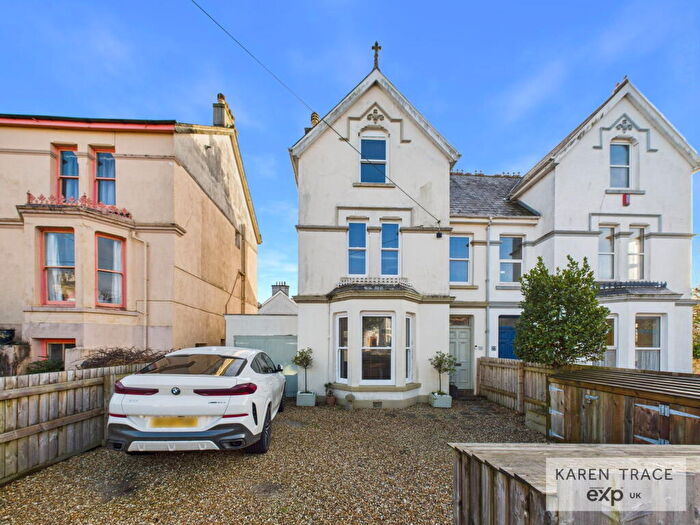
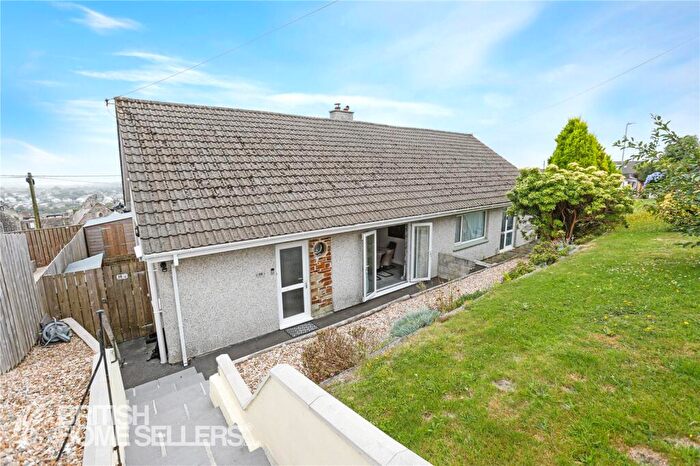
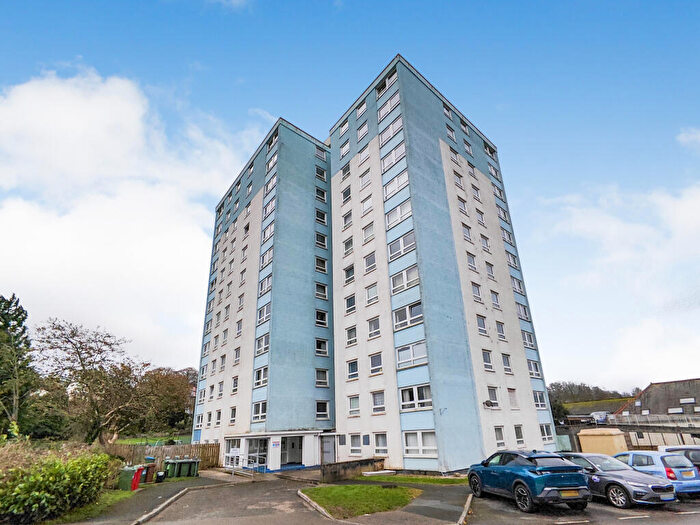
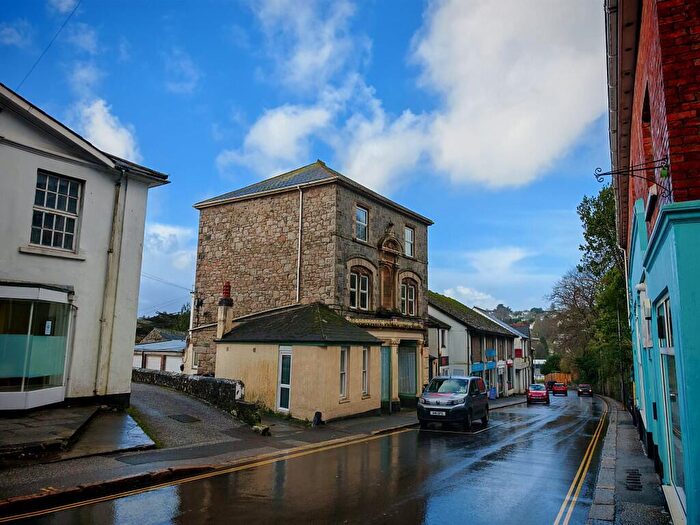
Houses for sale & to rent in St Austell, Cornwall
House Prices in St Austell
Properties in St Austell have an average house price of £294,297.00 and had 1,970 Property Transactions within the last 3 years.¹
St Austell is an area in Cornwall with 21,962 households², where the most expensive property was sold for £3,150,000.00.
Properties for sale in St Austell
Neighbourhoods in St Austell
Navigate through our locations to find the location of your next house in St Austell, Cornwall for sale or to rent.
- Bugle
- Lanivet And Blisland
- Mevagissey
- Mount Charles
- Penwithick And Boscoppa
- Roche
- St Austell Bay
- St Austell Bethel
- St Austell Gover
- St Austell Poltair
- St Dennis And Nanpean
- St Mewan
- St Stephen-in-brannel
- Roseland
- Roche & Bugle
- St Dennis & St Enoder
- Penwithick & Boscoppa
- Mevagissey & St Austell Bay
- St Austell Bethel & Holmbush
- St Austell Poltair & Mount Charles
- St Mewan & Grampound
- St Austell Central & Gover
Transport in St Austell
Please see below transportation links in this area:
- FAQ
- Price Paid By Year
- Property Type Price
Frequently asked questions about St Austell
What is the average price for a property for sale in St Austell?
The average price for a property for sale in St Austell is £294,297. This amount is 15% lower than the average price in Cornwall. There are more than 10,000 property listings for sale in St Austell.
What locations have the most expensive properties for sale in St Austell?
The locations with the most expensive properties for sale in St Austell are St Austell Bay at an average of £450,954, Mevagissey at an average of £437,208 and St Mewan at an average of £365,999.
What locations have the most affordable properties for sale in St Austell?
The locations with the most affordable properties for sale in St Austell are St Dennis And Nanpean at an average of £217,439, Bugle at an average of £222,559 and Mount Charles at an average of £227,855.
Which train stations are available in or near St Austell?
Some of the train stations available in or near St Austell are St.Austell, Bugle and Luxulyan.
Property Price Paid in St Austell by Year
The average sold property price by year was:
| Year | Average Sold Price | Price Change |
Sold Properties
|
|---|---|---|---|
| 2025 | £288,425 | -3% |
580 Properties |
| 2024 | £296,780 | - |
690 Properties |
| 2023 | £296,715 | -1% |
700 Properties |
| 2022 | £300,709 | 8% |
856 Properties |
| 2021 | £277,077 | 11% |
1,138 Properties |
| 2020 | £245,639 | 10% |
786 Properties |
| 2019 | £219,937 | 3% |
1,001 Properties |
| 2018 | £213,215 | -0,4% |
961 Properties |
| 2017 | £214,116 | 6% |
1,058 Properties |
| 2016 | £201,969 | 5% |
1,038 Properties |
| 2015 | £192,226 | 1% |
1,076 Properties |
| 2014 | £190,443 | 4% |
907 Properties |
| 2013 | £183,031 | -0,1% |
833 Properties |
| 2012 | £183,230 | -3% |
704 Properties |
| 2011 | £188,300 | -0,4% |
729 Properties |
| 2010 | £189,083 | 6% |
713 Properties |
| 2009 | £178,519 | -8% |
653 Properties |
| 2008 | £192,166 | -1% |
635 Properties |
| 2007 | £193,708 | 2% |
1,238 Properties |
| 2006 | £189,717 | 7% |
1,303 Properties |
| 2005 | £176,691 | 2% |
913 Properties |
| 2004 | £173,043 | 12% |
1,124 Properties |
| 2003 | £152,032 | 20% |
1,101 Properties |
| 2002 | £121,166 | 24% |
1,344 Properties |
| 2001 | £92,322 | 12% |
1,263 Properties |
| 2000 | £81,609 | 16% |
1,079 Properties |
| 1999 | £68,193 | 11% |
1,095 Properties |
| 1998 | £60,655 | 5% |
939 Properties |
| 1997 | £57,603 | 6% |
1,035 Properties |
| 1996 | £53,937 | 7% |
858 Properties |
| 1995 | £49,897 | - |
674 Properties |
Property Price per Property Type in St Austell
Here you can find historic sold price data in order to help with your property search.
The average Property Paid Price for specific property types in the last three years are:
| Property Type | Average Sold Price | Sold Properties |
|---|---|---|
| Semi Detached House | £246,622.00 | 517 Semi Detached Houses |
| Terraced House | £212,678.00 | 494 Terraced Houses |
| Detached House | £409,878.00 | 774 Detached Houses |
| Flat | £161,907.00 | 185 Flats |

