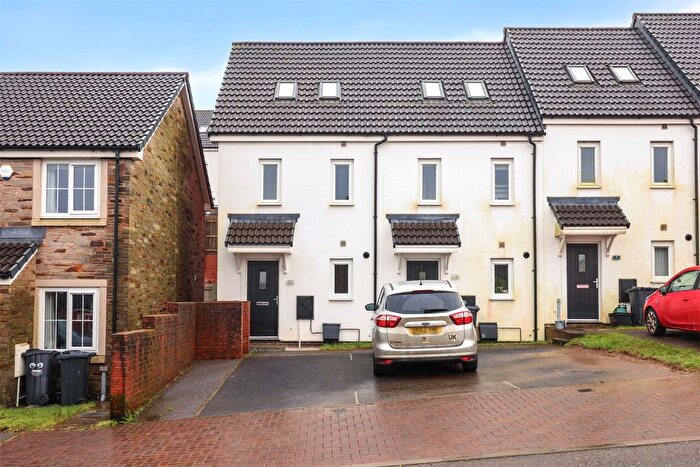
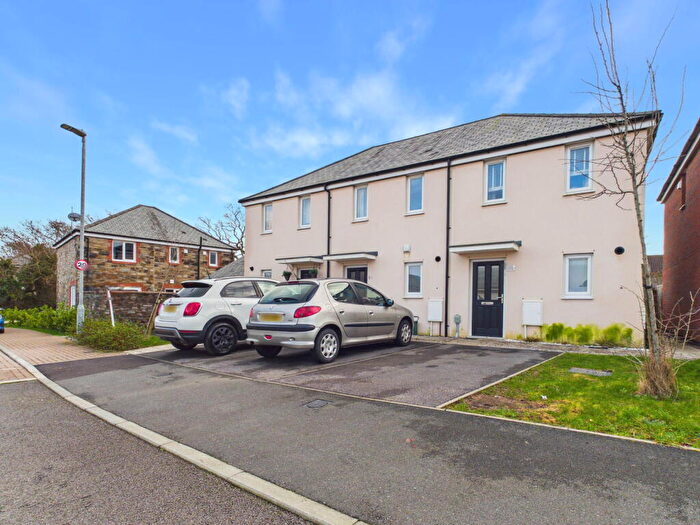
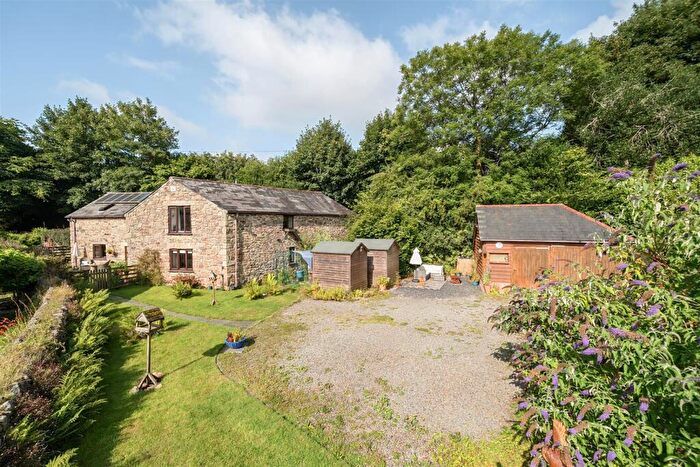
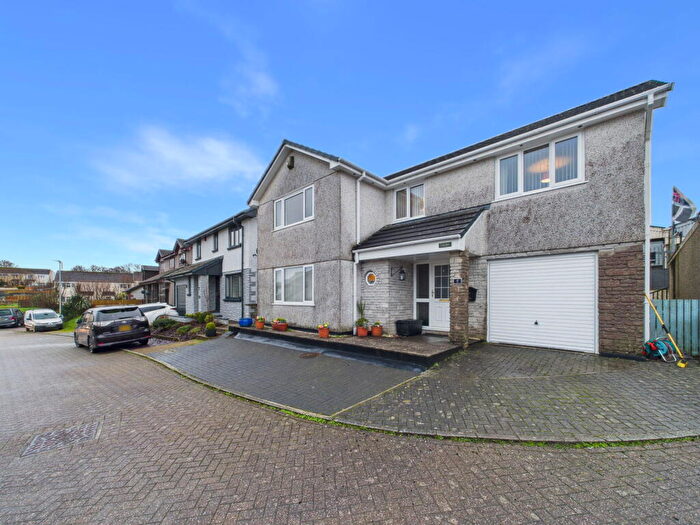
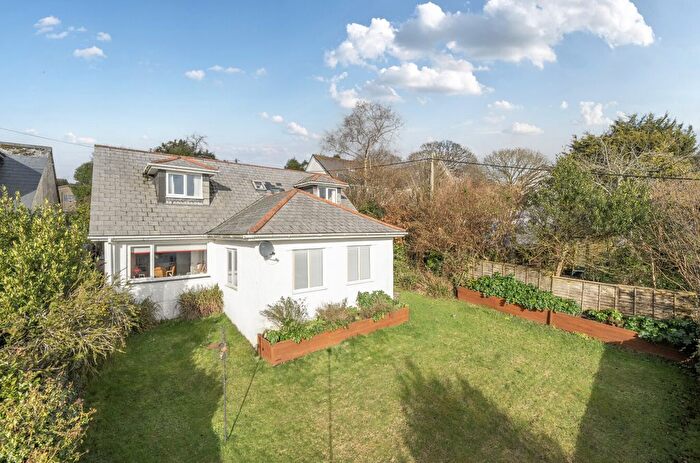
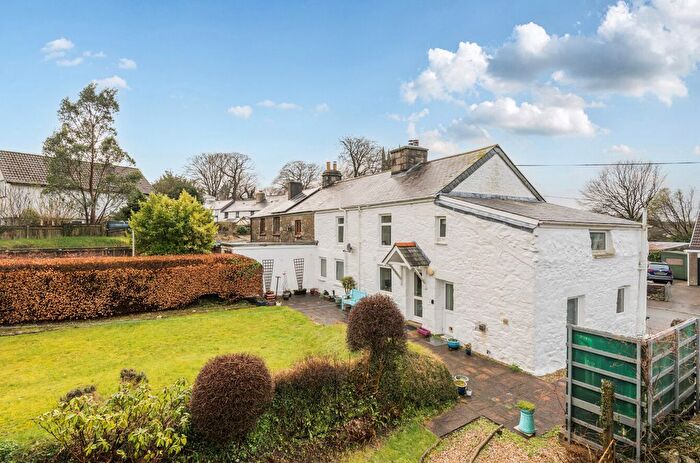
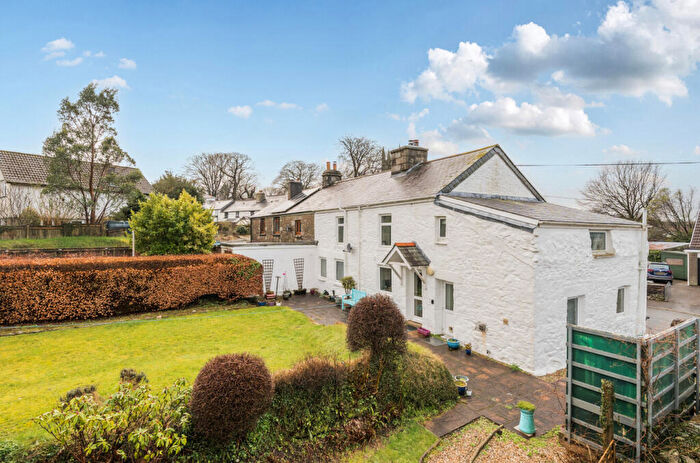
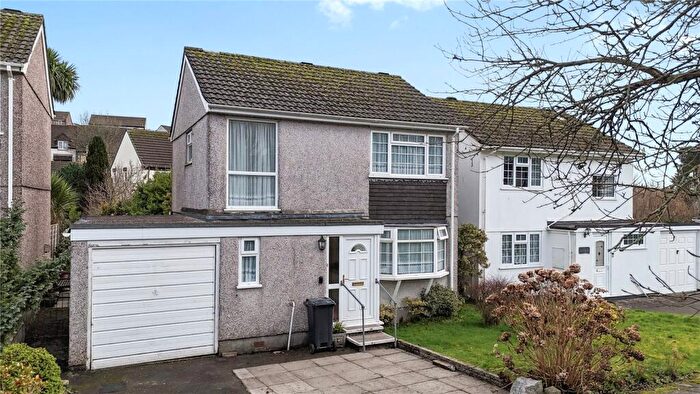
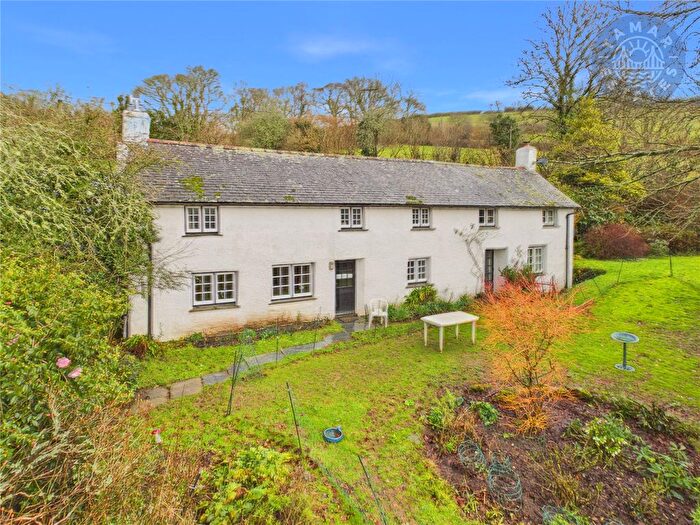
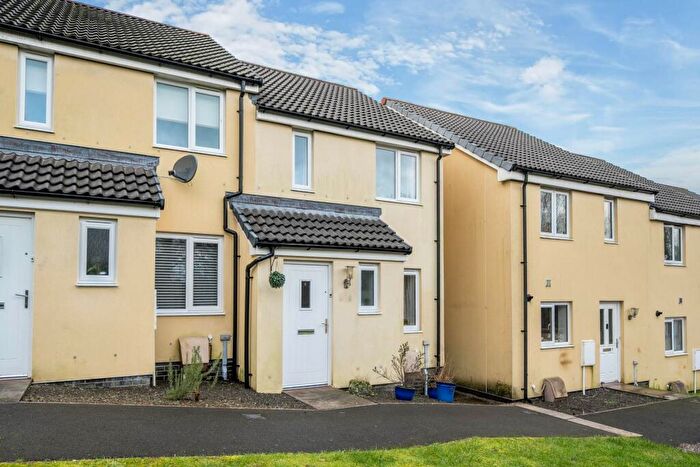
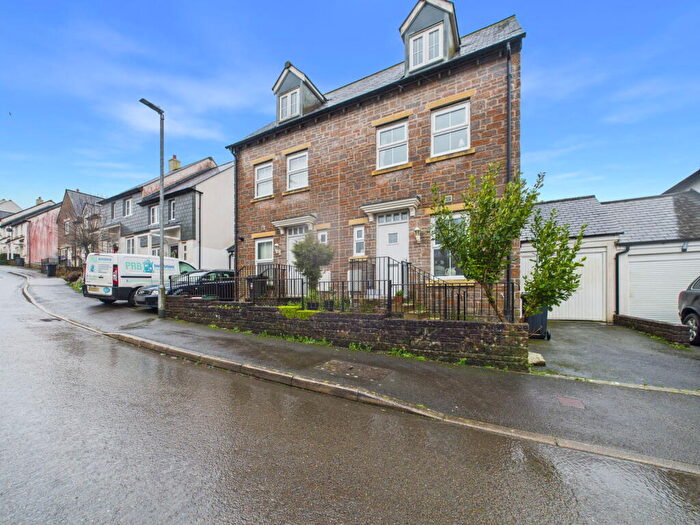
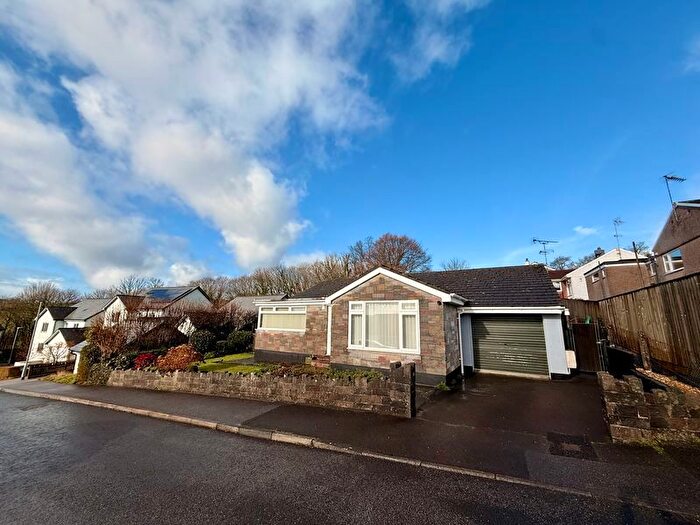
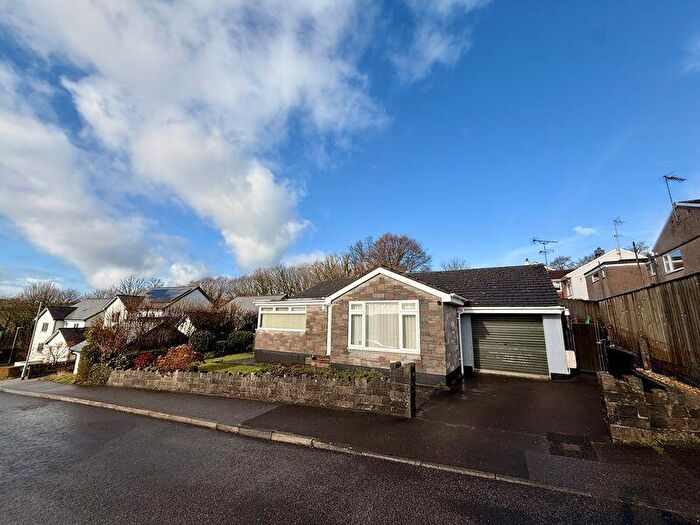
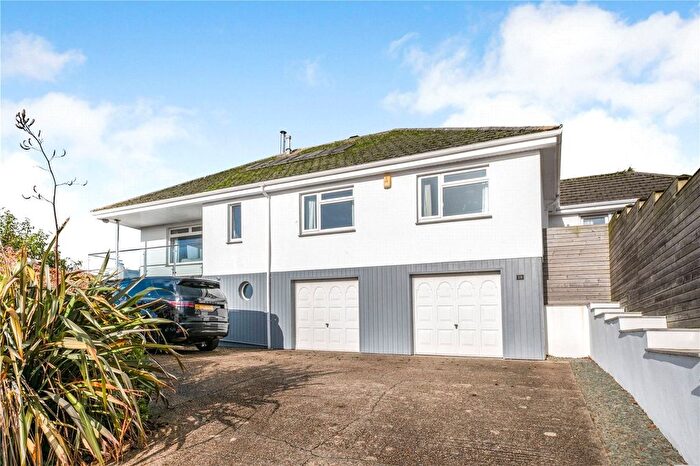
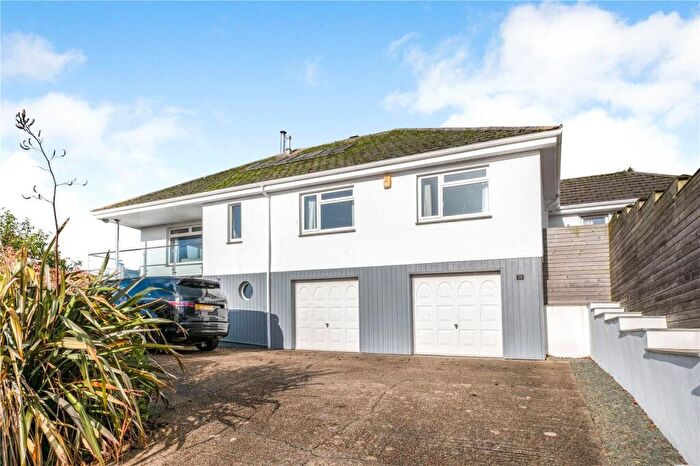
Houses for sale & to rent in Liskeard, Cornwall
House Prices in Liskeard
Properties in Liskeard have an average house price of £270,199.00 and had 978 Property Transactions within the last 3 years.¹
Liskeard is an area in Cornwall with 9,985 households², where the most expensive property was sold for £2,000,000.00.
Properties for sale in Liskeard
Neighbourhoods in Liskeard
Navigate through our locations to find the location of your next house in Liskeard, Cornwall for sale or to rent.
Transport in Liskeard
Please see below transportation links in this area:
- FAQ
- Price Paid By Year
- Property Type Price
Frequently asked questions about Liskeard
What is the average price for a property for sale in Liskeard?
The average price for a property for sale in Liskeard is £270,199. This amount is 22% lower than the average price in Cornwall. There are 7,639 property listings for sale in Liskeard.
What locations have the most expensive properties for sale in Liskeard?
The locations with the most expensive properties for sale in Liskeard are Trelawny at an average of £421,297, Menheniot at an average of £354,163 and St Cleer at an average of £310,737.
What locations have the most affordable properties for sale in Liskeard?
The locations with the most affordable properties for sale in Liskeard are Liskeard East at an average of £200,041, Liskeard North at an average of £243,872 and Liskeard West And Dobwalls at an average of £256,759.
Which train stations are available in or near Liskeard?
Some of the train stations available in or near Liskeard are Liskeard, Coombe Junction Halt and St.Keyne Wishing Well Halt.
Property Price Paid in Liskeard by Year
The average sold property price by year was:
| Year | Average Sold Price | Price Change |
Sold Properties
|
|---|---|---|---|
| 2025 | £266,865 | -2% |
301 Properties |
| 2024 | £270,934 | -1% |
342 Properties |
| 2023 | £272,446 | -5% |
335 Properties |
| 2022 | £287,359 | 7% |
438 Properties |
| 2021 | £268,587 | 13% |
537 Properties |
| 2020 | £232,897 | 8% |
433 Properties |
| 2019 | £213,357 | 7% |
498 Properties |
| 2018 | £199,219 | -4% |
497 Properties |
| 2017 | £207,897 | 10% |
495 Properties |
| 2016 | £188,010 | -1% |
492 Properties |
| 2015 | £190,595 | 9% |
447 Properties |
| 2014 | £172,684 | -2% |
464 Properties |
| 2013 | £176,227 | -1% |
324 Properties |
| 2012 | £177,205 | -6% |
269 Properties |
| 2011 | £187,518 | -0,2% |
296 Properties |
| 2010 | £187,872 | 10% |
283 Properties |
| 2009 | £169,391 | -7% |
294 Properties |
| 2008 | £180,825 | -6% |
281 Properties |
| 2007 | £192,570 | 6% |
492 Properties |
| 2006 | £181,687 | 7% |
506 Properties |
| 2005 | £168,805 | 4% |
364 Properties |
| 2004 | £162,774 | 14% |
477 Properties |
| 2003 | £140,373 | 17% |
480 Properties |
| 2002 | £116,725 | 23% |
657 Properties |
| 2001 | £89,440 | 14% |
556 Properties |
| 2000 | £76,866 | 13% |
603 Properties |
| 1999 | £66,930 | 7% |
585 Properties |
| 1998 | £62,066 | 6% |
500 Properties |
| 1997 | £58,386 | 8% |
548 Properties |
| 1996 | £53,808 | 5% |
456 Properties |
| 1995 | £50,971 | - |
405 Properties |
Property Price per Property Type in Liskeard
Here you can find historic sold price data in order to help with your property search.
The average Property Paid Price for specific property types in the last three years are:
| Property Type | Average Sold Price | Sold Properties |
|---|---|---|
| Semi Detached House | £232,149.00 | 231 Semi Detached Houses |
| Terraced House | £189,844.00 | 305 Terraced Houses |
| Detached House | £373,942.00 | 392 Detached Houses |
| Flat | £122,820.00 | 50 Flats |

