
Houses for sale in Falmouth, Cornwall
House Prices in Falmouth
Properties in Falmouth have an average house price of £439k and had 1,474 Property Transactions within the last 3 years.¹
Falmouth is an area in Cornwall with 13,662 households², where the most expensive property was sold for £4.5M.
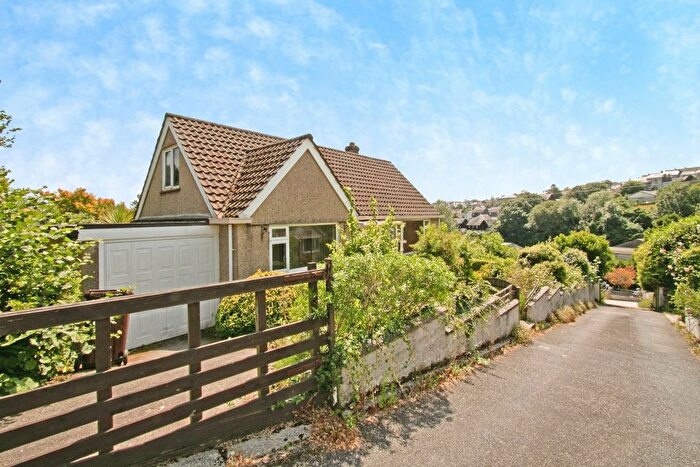
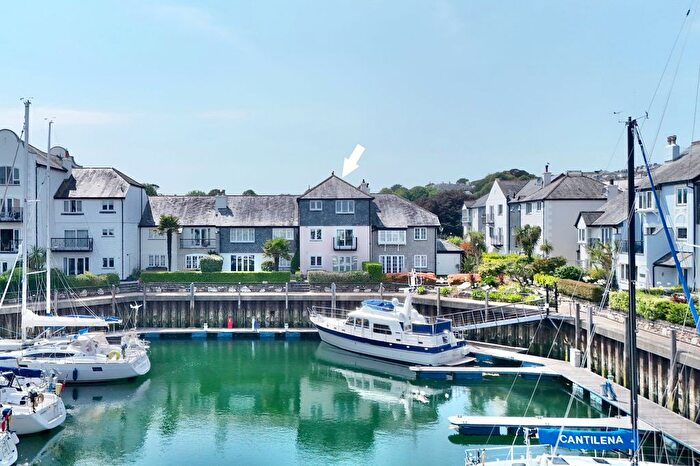
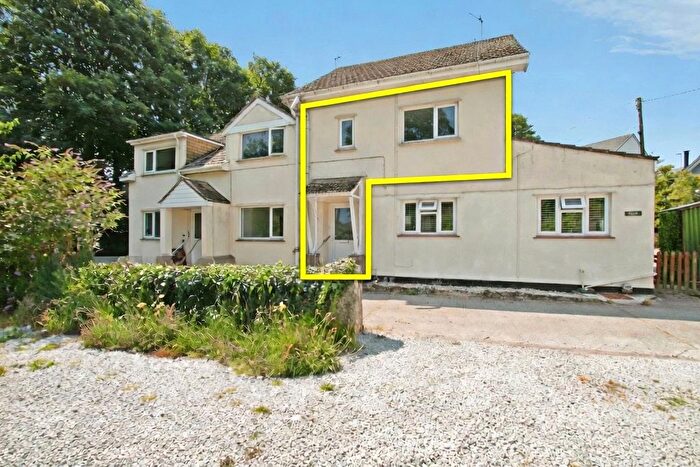
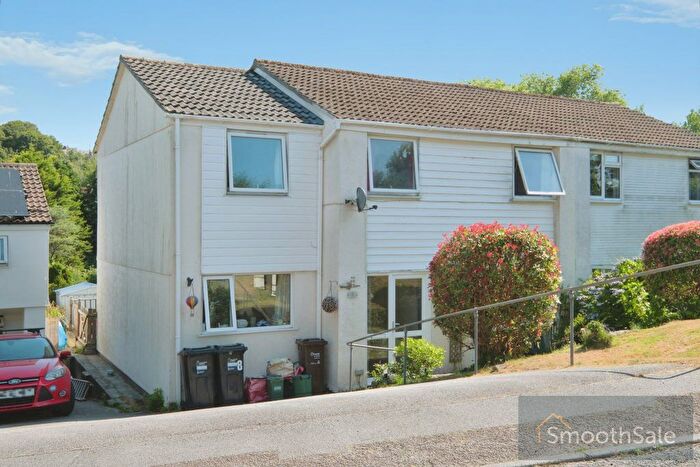
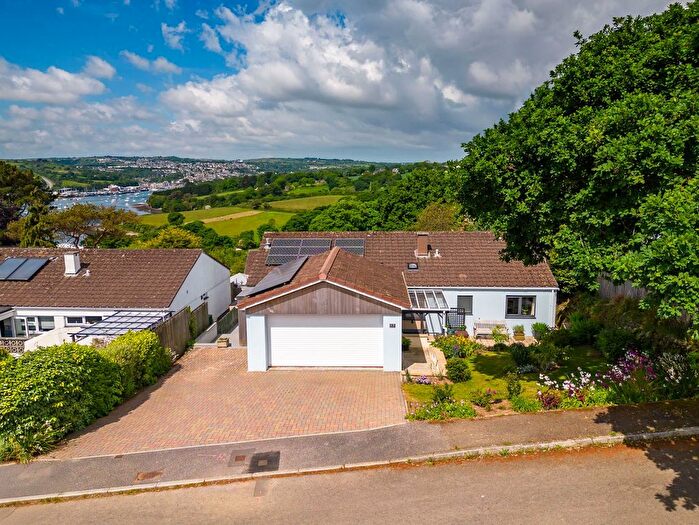
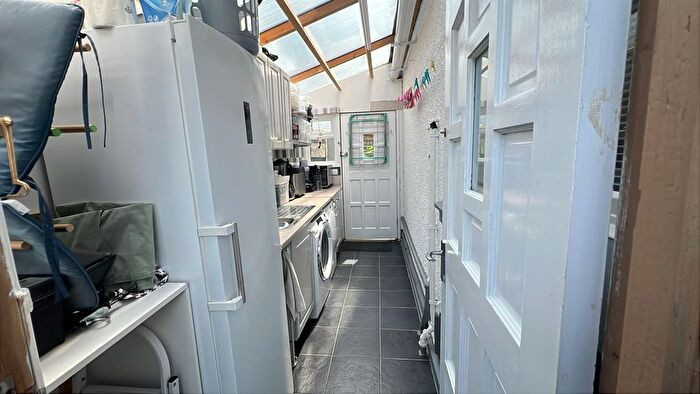
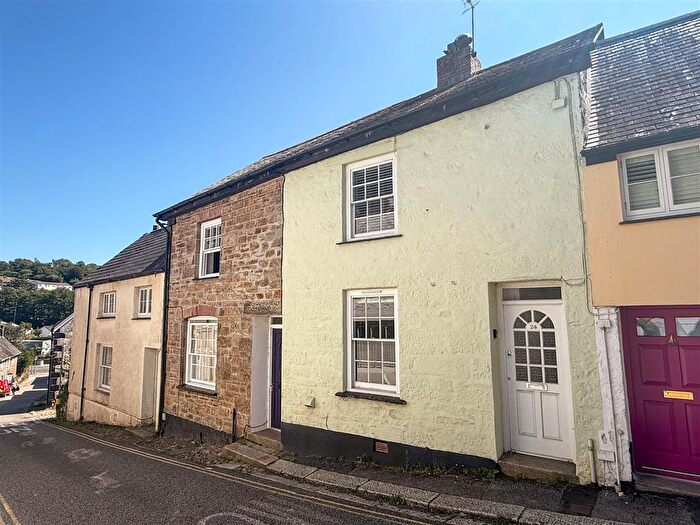
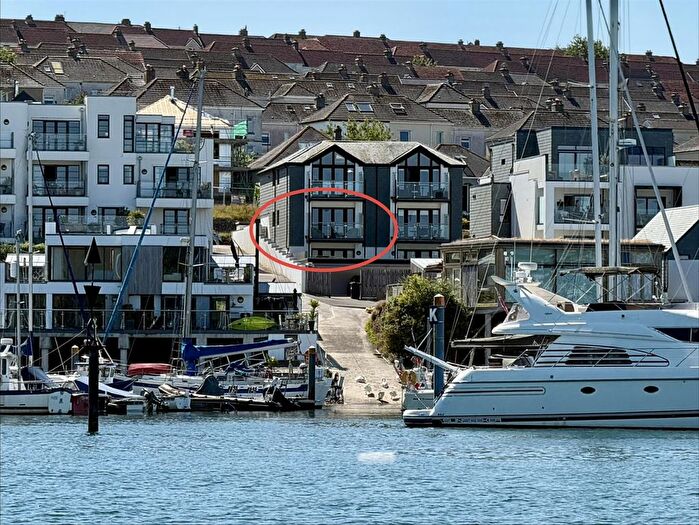
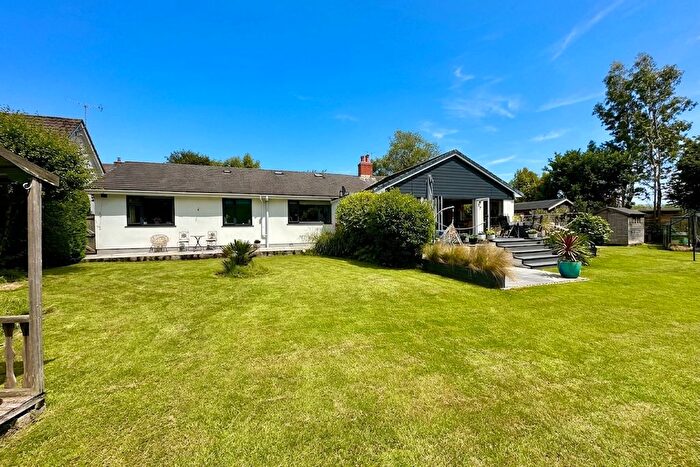
Properties for sale in Falmouth
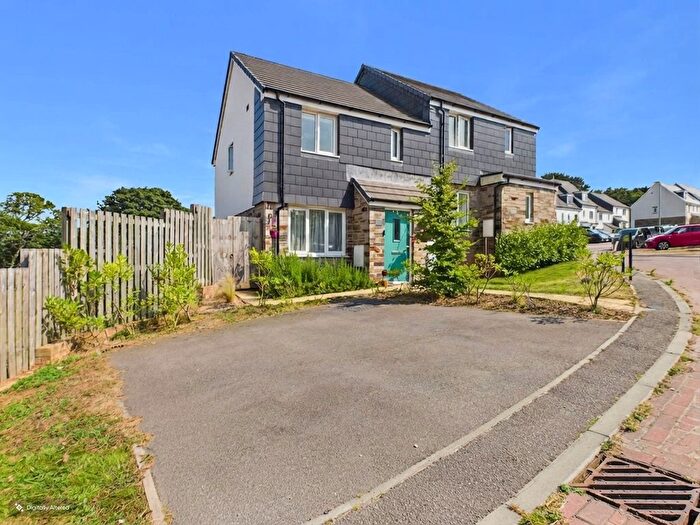
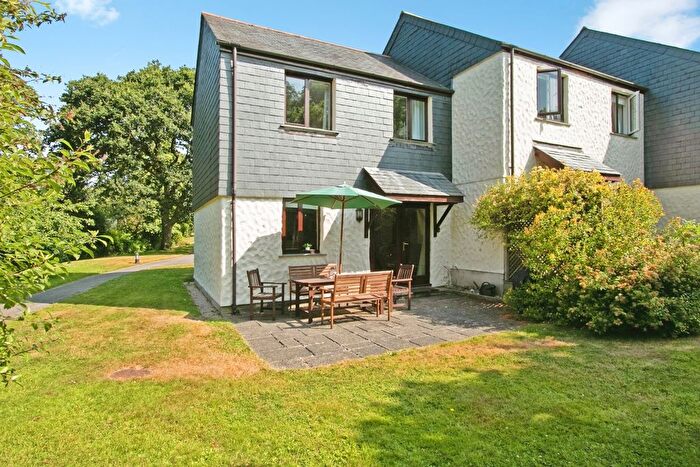
![]()
If you are looking to sell your house, let it out, or receive a property valuation, an expert can help you.
Click the button below to get started.
Neighbourhoods in Falmouth
Navigate through our locations to find the location of your next house in Falmouth, Cornwall for sale or to rent.
Property price trends in Falmouth
According to the latest Land Registry data, the average home in Falmouth sold for £327,852 in 2026. That figure comes from a substantial record of 19,158 sales logged over the past 31 years.
Prices have fallen back over the last three years. Compared with 2023, when the typical sale came in around £438,045, that's a fall of roughly 25.2%.
Looking back five years, average prices are down about 19.4% since 2021, a drop of around £79,151 in cash terms.
Zoom out to the past decade for the fuller picture. Back in 2016, homes here averaged £301,844, so the typical sold price has climbed about 8.6% since then, roughly 0.8% a year. Stretch the view to fifteen years and that annual pace edges up closer to 1.4%.
Frequently asked questions about Falmouth
What is the average price for a property for sale in Falmouth?
The average price for a property for sale in Falmouth is £438,549. This amount is 27% higher than the average price in Cornwall. There are 4,367 property listings for sale in Falmouth.
What locations have the most expensive properties for sale in Falmouth?
The locations with the most expensive properties for sale in Falmouth are St Keverne And Meneage at an average of £2,100,000, Penryn East And Mylor at an average of £607,308 and Constantine, Mawnan And Budock at an average of £517,416.
What locations have the most affordable properties for sale in Falmouth?
The locations with the most affordable properties for sale in Falmouth are Falmouth Trescobeas at an average of £333,153, Falmouth Boslowick at an average of £370,670 and Falmouth Penwerris at an average of £372,067.
Which train stations are available in or near Falmouth?
Some of the train stations available in or near Falmouth are Penmere, Falmouth Town and Falmouth Docks.
Property Price Paid in Falmouth by Year
The average sold property price by year was:
| Year | Average Sold Price | Price Change |
Sold Properties
|
|---|---|---|---|
| 2026 | £327,852 | -29% |
39 Properties |
| 2025 | £422,280 | -9% |
457 Properties |
| 2024 | £461,368 | 5% |
525 Properties |
| 2023 | £438,045 | -3% |
453 Properties |
| 2022 | £450,320 | 10% |
549 Properties |
| 2021 | £407,003 | 5% |
775 Properties |
| 2020 | £385,389 | 11% |
613 Properties |
| 2019 | £342,467 | 1% |
669 Properties |
| 2018 | £339,190 | 1% |
607 Properties |
| 2017 | £334,313 | 10% |
629 Properties |
Property Price per Property Type in Falmouth
Here you can find historic sold price data in order to help with your property search.
The average Property Paid Price for specific property types in the last three years are:
| Property Type | Average Sold Price | Sold Properties |
|---|---|---|
| Semi Detached House | £371,831.00 | 293 Semi Detached Houses |
| Detached House | £672,695.00 | 405 Detached Houses |
| Terraced House | £358,193.00 | 477 Terraced Houses |
| Flat | £314,965.00 | 299 Flats |
Transport in Falmouth
Please see below transportation links in this area:
