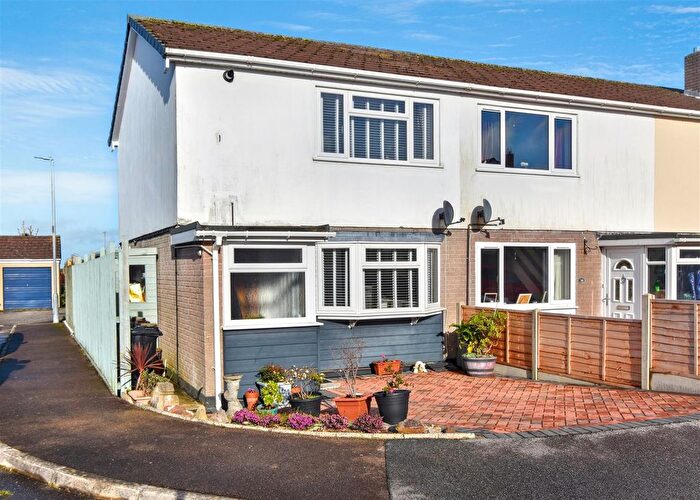
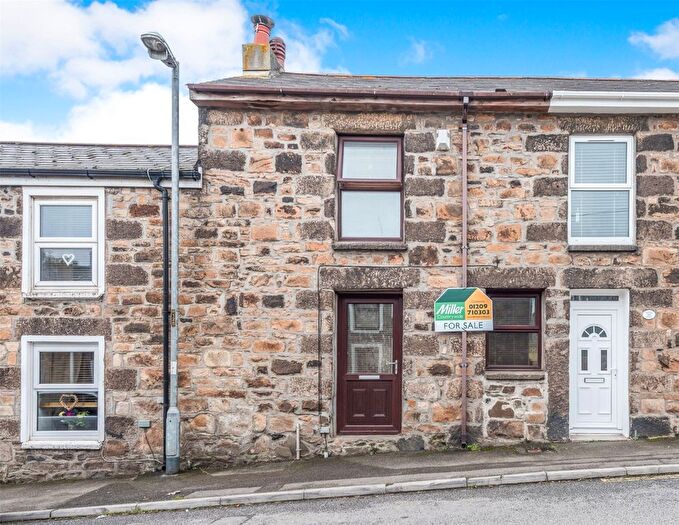
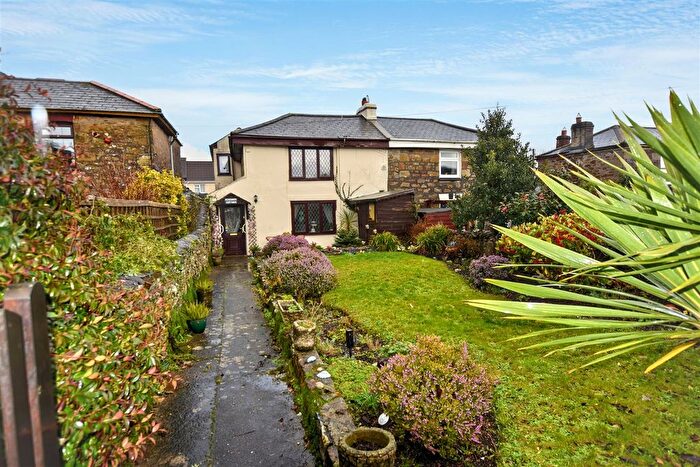
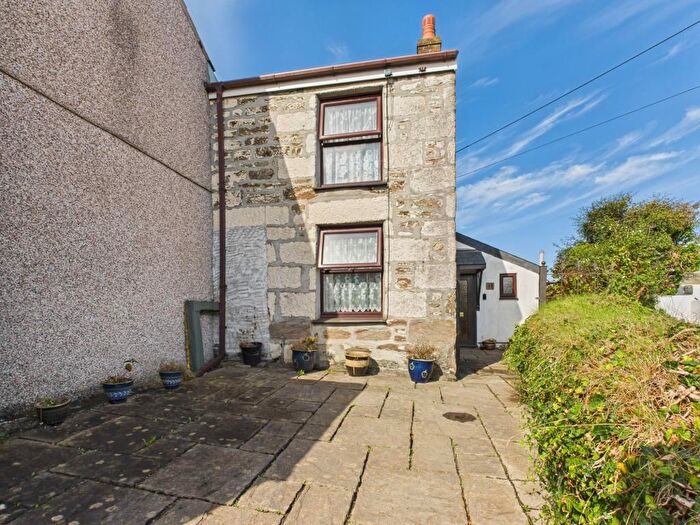
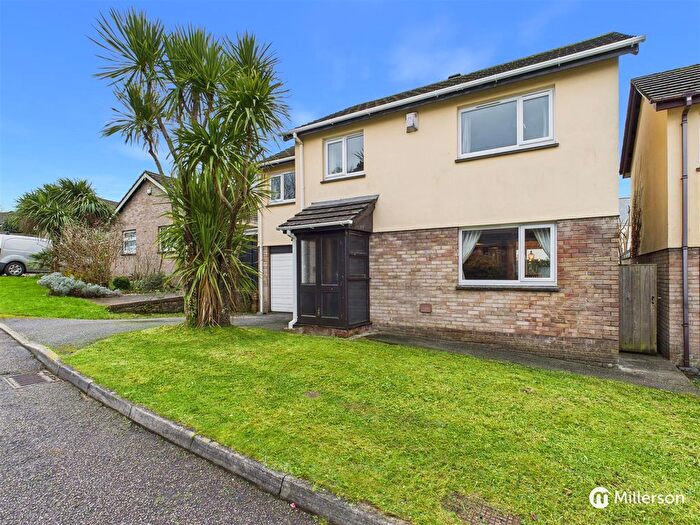
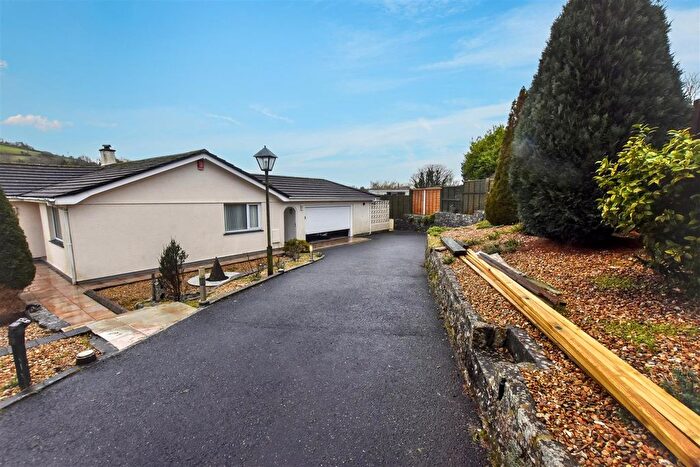
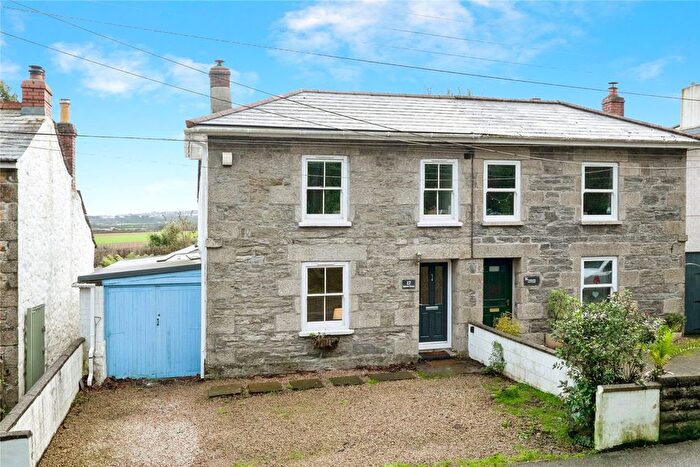
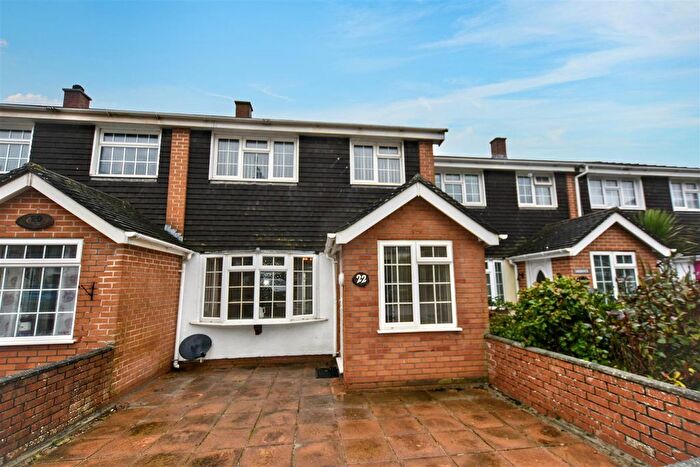
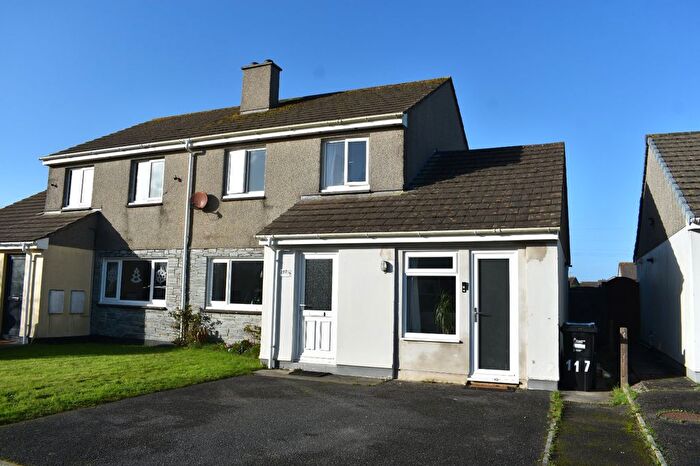
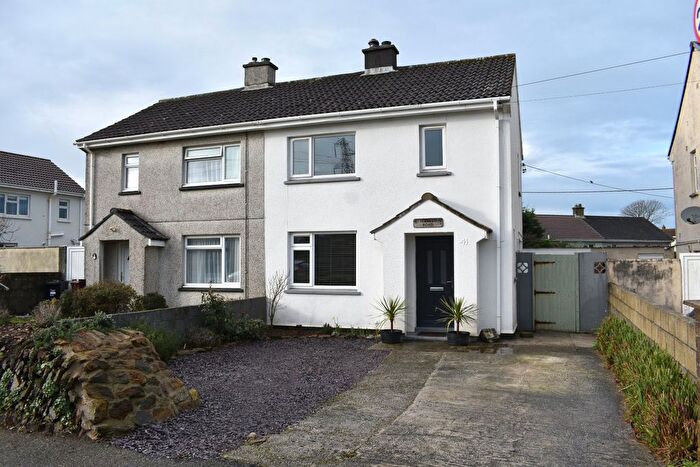
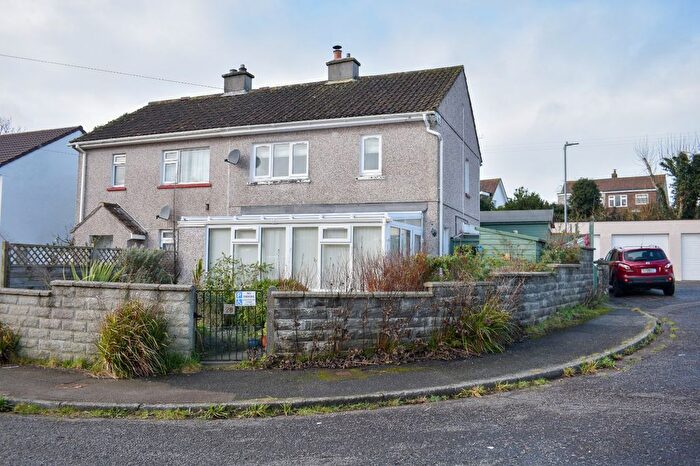
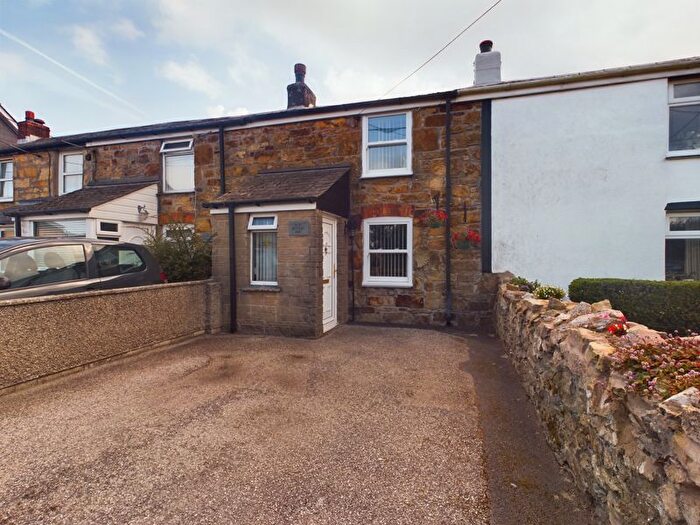
Houses for sale & to rent in Illogan, Redruth
House Prices in Illogan
Properties in Illogan have an average house price of £305,882.00 and had 194 Property Transactions within the last 3 years¹.
Illogan is an area in Redruth, Cornwall with 2,032 households², where the most expensive property was sold for £735,000.00.
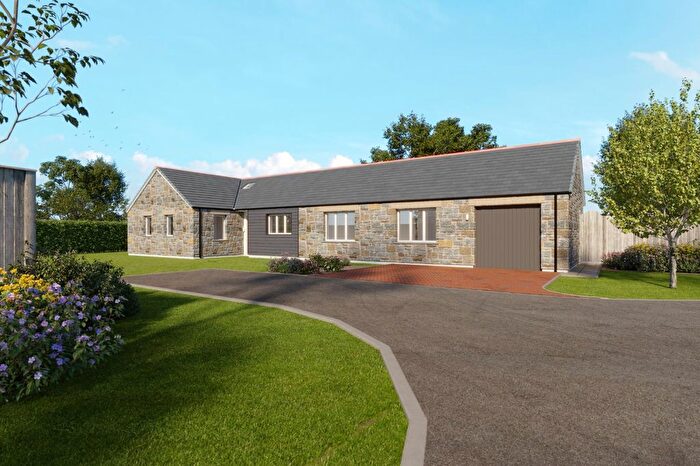
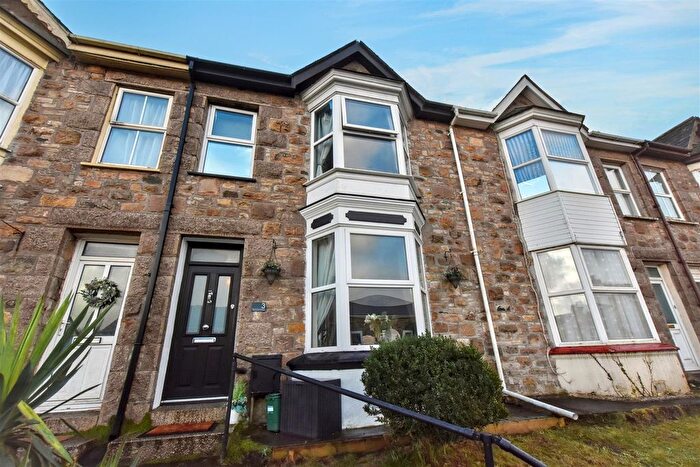
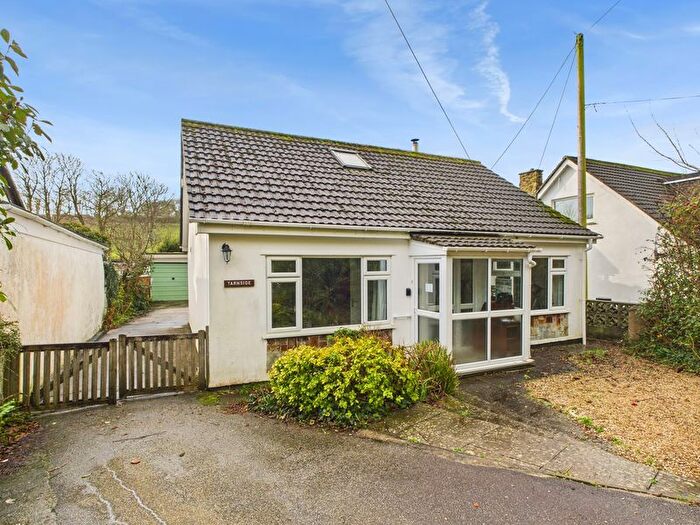
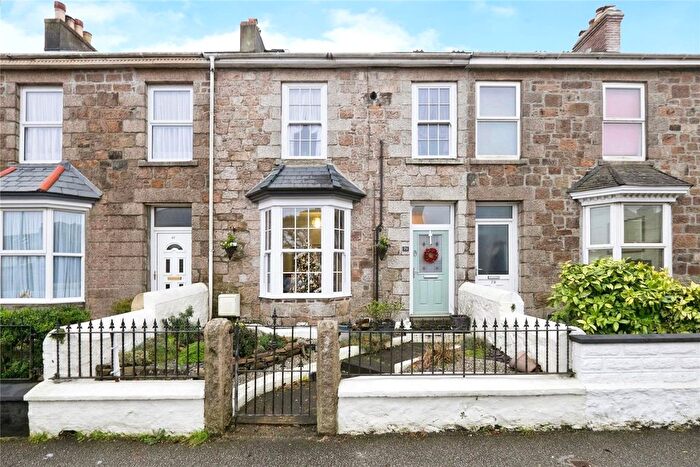
Properties for sale in Illogan
Previously listed properties in Illogan
Roads and Postcodes in Illogan
Navigate through our locations to find the location of your next house in Illogan, Redruth for sale or to rent.
| Streets | Postcodes |
|---|---|
| Alexandra Close | TR16 4RS |
| Alexandra Road | TR16 4DY TR16 4EA TR16 4EN |
| Beacon View Park | TR16 4JL |
| Bosvean Gardens | TR16 4DH |
| Bridge Hill | TR16 4QR TR16 4SD TR16 4FN |
| Bridge Road | TR16 4SA |
| Broad Lane | TR15 3HY TR15 3FU |
| Church Road | TR16 4SR |
| Churchtown | TR16 4SW |
| Churchtown Road | TR16 4SF TR16 4SJ |
| Clifton Road | TR15 3UA TR15 3UD |
| Colborne Avenue | TR16 4EB |
| Coronation Road | TR16 4SG TR16 4SQ |
| Cot Road | TR16 4PS |
| Dreysen Close | TR15 3TX |
| Essex Drive | TR15 3XD |
| Fairfield | TR16 4EJ |
| Forth An Praze | TR15 3TW |
| Forthvras | TR15 3XQ |
| Gilberts Terrace | TR15 3HP |
| Gwel Kann | TR15 3FN |
| Harmony Terrace | TR16 4SS |
| Harris Mill | TR16 4JG |
| Harris Mill Cottages | TR16 4EP |
| Illogan Park | TR16 4DP |
| Kennedy Close | TR15 3UN |
| Kestrel Way | TR16 4DN |
| Kew Trenals | TR15 3FZ |
| Lamanva Close | TR16 4EW |
| Lamanva Road | TR16 4EZ |
| Langwedh Estate | TR16 4QY |
| Lower Broad Lane | TR15 3HJ TR15 3HT |
| Lower Merritts Hill | TR16 4JH |
| Marys Well | TR15 3UU TR16 4EG TR16 4EQ |
| Merritts Hill | TR16 4DF TR16 4HD TR16 4AZ TR16 4FH |
| Nance Lane | TR16 4BB |
| Nettles Row | TR16 4RU |
| Oxland Road | TR16 4SH |
| Park Bottom | TR15 3UF TR15 3XJ TR15 3XT |
| Park Close | TR15 3XL |
| Park Leven | TR16 4GA |
| Park Road | TR15 3XU |
| Paynters Lane | TR16 4DJ TR16 4DR TR16 4DS TR16 4DT |
| Paynters Lane End | TR16 4RH |
| Paynters Lane End Estate | TR16 4RJ |
| Pencarrow Road | TR16 4DW |
| Penhallow | TR15 3XG |
| Penpraze | TR16 4PX |
| Penwartha Road | TR16 4ST |
| Penwartha Vean | TR16 4SU |
| Poldark Road | TR16 4DL |
| Primrose Gardens | TR16 4EH |
| Rainham Close | TR15 3UH |
| Rayle Bottoms | TR16 4QT |
| Richards Lane | TR16 4DQ TR16 4HA |
| Robartes Terrace | TR16 4RX |
| Roscarrack | TR15 3XE |
| Rosenannon Lane | TR15 3XB |
| Rosenannon Road | TR15 3XF |
| South View | TR16 4RW |
| Spar Lane | TR15 3UR |
| Sunnyside Parc | TR15 3LX TR15 3LY |
| Tangye Close | TR16 4SN |
| The Meadow | TR16 4RT |
| Tolgus Lane | TR15 3HW |
| Travellers Rest | TR15 3UY |
| Treforthlan | TR16 4RN |
| Treforthlan Close | TR16 4RP |
| Tregullan | TR16 4DG |
| Treloweth Terrace | TR15 3XW |
| Trevelthan Road | TR16 4DX |
| Trevelyan Road | TR15 3UG TR15 3UJ TR15 3UW TR16 4RG TR16 4RR |
| Valley Gardens | TR16 4EE |
| Valley View | TR16 4EL |
| Ventonraze | TR16 4RY |
| Ventonraze Terrace | TR16 4RZ |
| Voguebeloth | TR16 4ER TR16 4ET TR16 4EU TR16 4EX |
| Warwick Avenue | TR16 4DZ |
| Watergate | TR16 4QS |
| Wills Row | TR15 3UB |
| Woodbine Lane | TR16 4ED |
| Woodland View | TR15 3XR |
| TR15 3TN TR15 3TP TR15 3UZ TR16 4JN TR16 4QU TR16 4QZ TR15 3TE TR16 4QX |
Transport near Illogan
-
Redruth Station
-
Camborne Station
-
Perranwell Station
-
Hayle Station
-
Penryn Station
-
Lelant Station
-
Lelant Saltings Station
-
Truro Station
-
Carbis Bay Station
-
St.Erth Station
- FAQ
- Price Paid By Year
- Property Type Price
Frequently asked questions about Illogan
What is the average price for a property for sale in Illogan?
The average price for a property for sale in Illogan is £305,882. This amount is 13% higher than the average price in Redruth. There are 1,167 property listings for sale in Illogan.
What streets have the most expensive properties for sale in Illogan?
The streets with the most expensive properties for sale in Illogan are Fairfield at an average of £585,000, Cot Road at an average of £514,250 and Alexandra Road at an average of £511,071.
What streets have the most affordable properties for sale in Illogan?
The streets with the most affordable properties for sale in Illogan are Coronation Road at an average of £115,312, Harmony Terrace at an average of £150,000 and Wills Row at an average of £165,000.
Which train stations are available in or near Illogan?
Some of the train stations available in or near Illogan are Redruth, Camborne and Perranwell.
Property Price Paid in Illogan by Year
The average sold property price by year was:
| Year | Average Sold Price | Price Change |
Sold Properties
|
|---|---|---|---|
| 2025 | £308,870 | -0,2% |
55 Properties |
| 2024 | £309,344 | 3% |
67 Properties |
| 2023 | £300,378 | 1% |
72 Properties |
| 2022 | £298,616 | 15% |
85 Properties |
| 2021 | £253,980 | -1% |
76 Properties |
| 2020 | £257,313 | 5% |
73 Properties |
| 2019 | £245,143 | 13% |
87 Properties |
| 2018 | £213,989 | -7% |
98 Properties |
| 2017 | £229,323 | 11% |
71 Properties |
| 2016 | £203,409 | 5% |
67 Properties |
| 2015 | £193,022 | -2% |
54 Properties |
| 2014 | £196,125 | -3% |
67 Properties |
| 2013 | £201,070 | 12% |
62 Properties |
| 2012 | £176,791 | -10% |
68 Properties |
| 2011 | £195,208 | 8% |
45 Properties |
| 2010 | £180,188 | -8% |
55 Properties |
| 2009 | £195,098 | -3% |
35 Properties |
| 2008 | £201,166 | 3% |
43 Properties |
| 2007 | £195,543 | 3% |
94 Properties |
| 2006 | £190,109 | 10% |
98 Properties |
| 2005 | £171,450 | 4% |
49 Properties |
| 2004 | £165,095 | 10% |
94 Properties |
| 2003 | £147,841 | 26% |
73 Properties |
| 2002 | £109,318 | 16% |
101 Properties |
| 2001 | £91,944 | 16% |
90 Properties |
| 2000 | £77,420 | 12% |
100 Properties |
| 1999 | £67,760 | 14% |
113 Properties |
| 1998 | £58,531 | 4% |
100 Properties |
| 1997 | £55,972 | 9% |
117 Properties |
| 1996 | £50,893 | 5% |
82 Properties |
| 1995 | £48,263 | - |
56 Properties |
Property Price per Property Type in Illogan
Here you can find historic sold price data in order to help with your property search.
The average Property Paid Price for specific property types in the last three years are:
| Property Type | Average Sold Price | Sold Properties |
|---|---|---|
| Semi Detached House | £263,693.00 | 63 Semi Detached Houses |
| Detached House | £371,460.00 | 94 Detached Houses |
| Terraced House | £234,742.00 | 27 Terraced Houses |
| Flat | £147,325.00 | 10 Flats |

