
Houses for sale in TR16 4RU, Nettles Row, Illogan, Redruth
House Prices in TR16 4RU, Nettles Row, Illogan
Properties in TR16 4RU have no sales history available within the last 3 years. TR16 4RU is a postcode in Nettles Row located in Illogan, an area in Redruth, Cornwall, with 6 households².
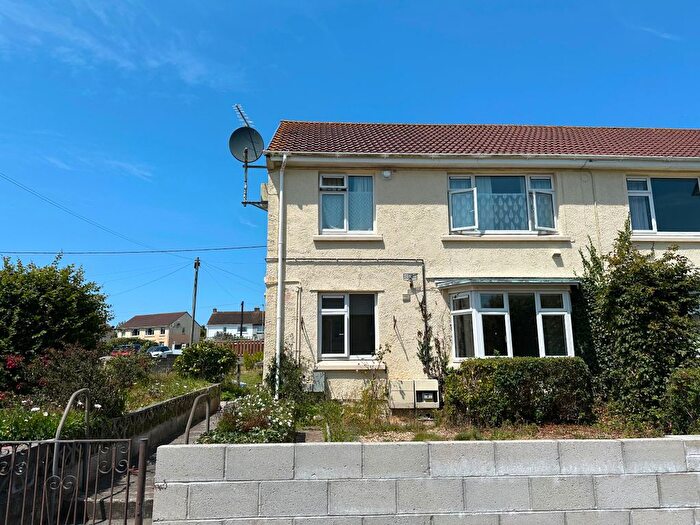
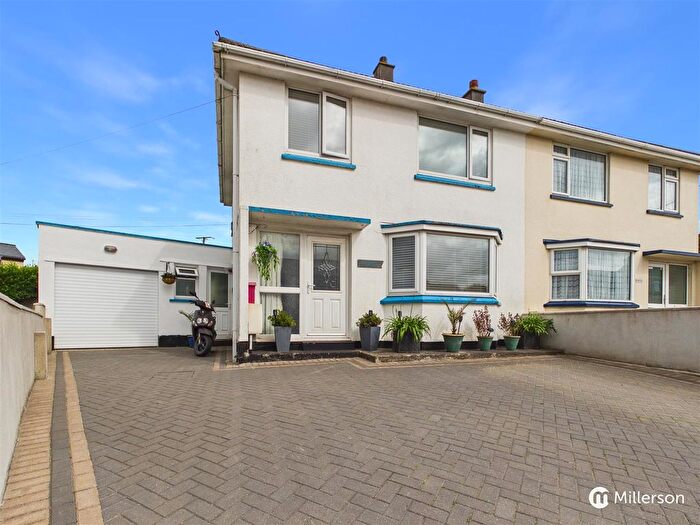
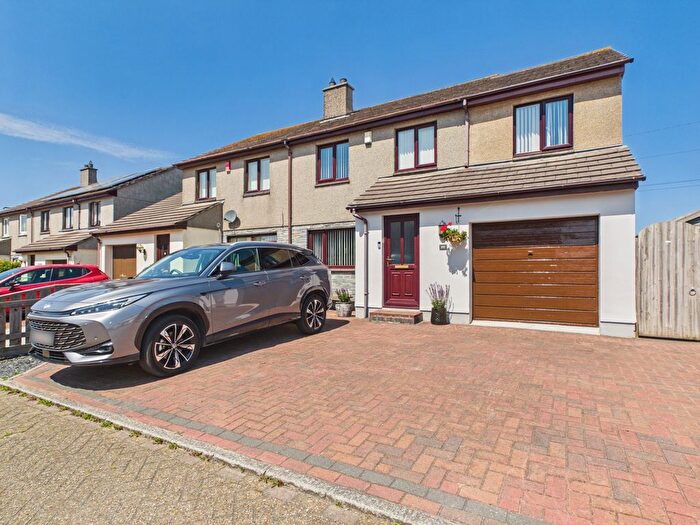
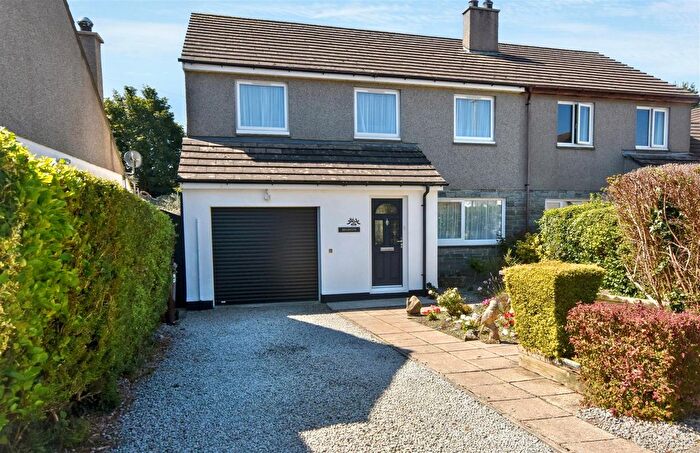
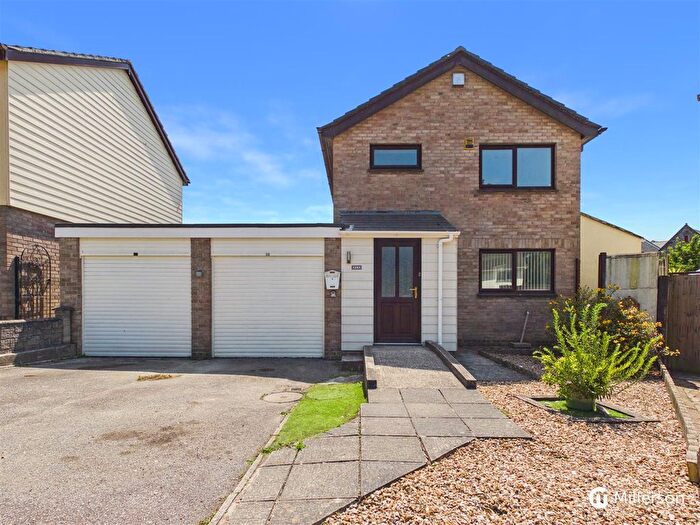
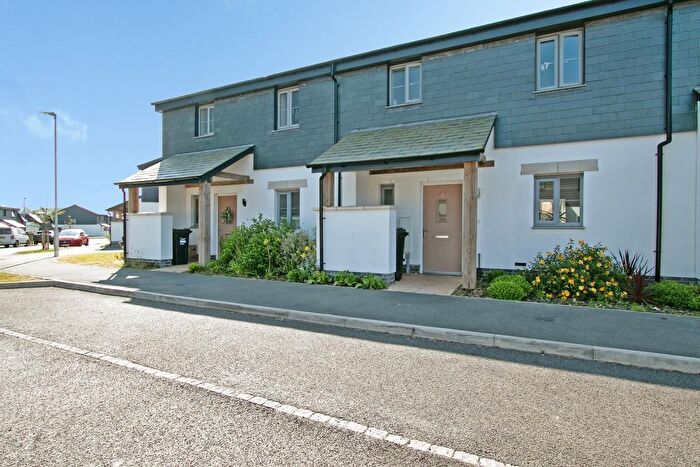
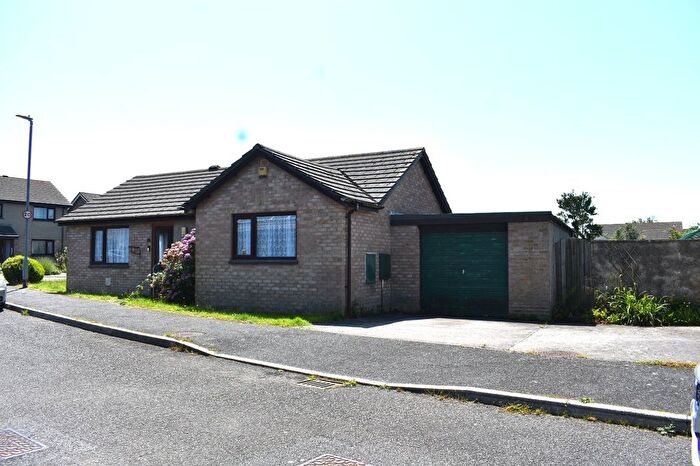
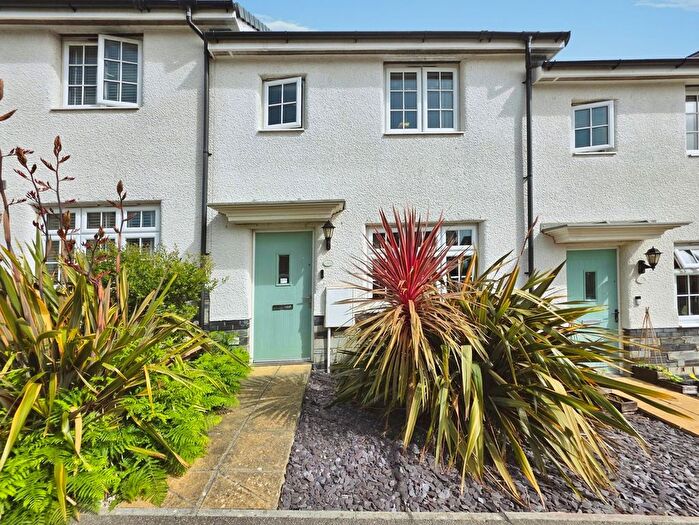
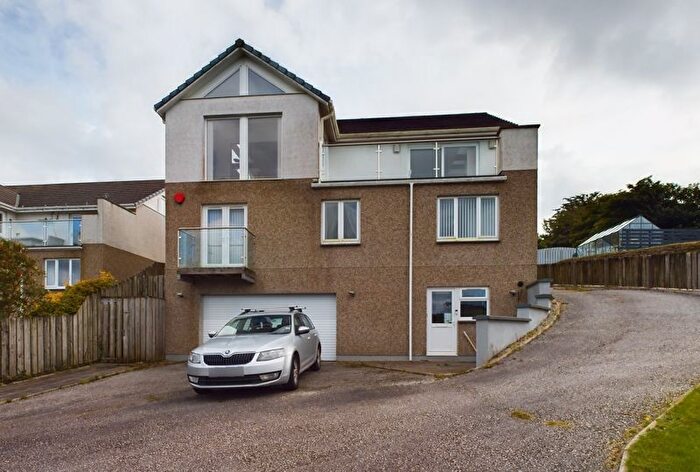
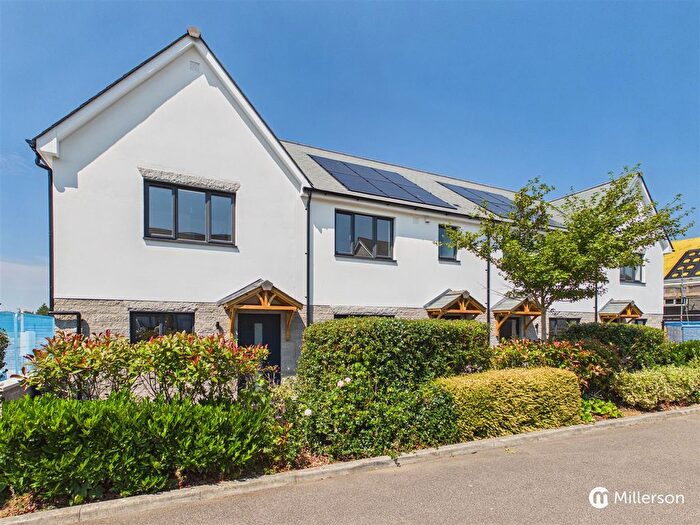
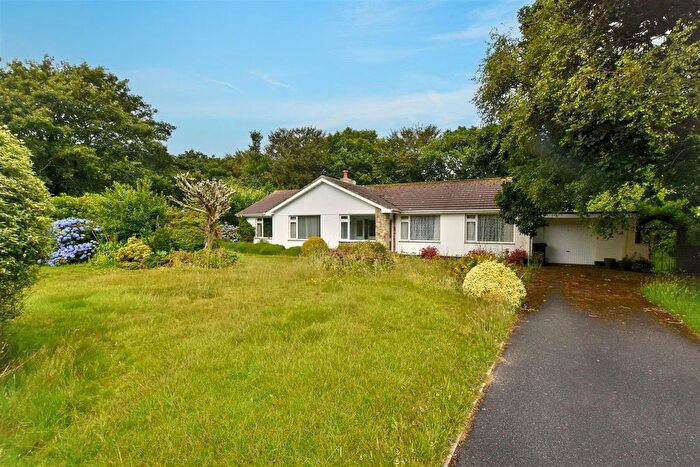
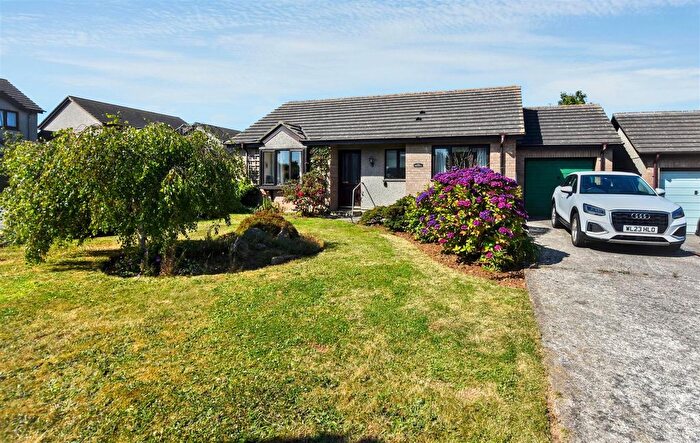
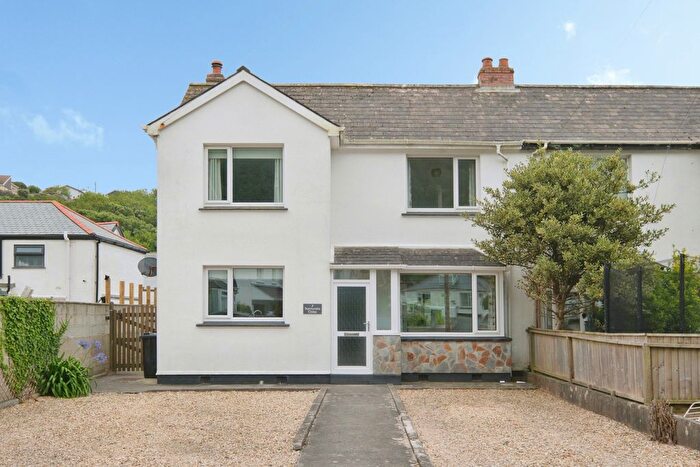
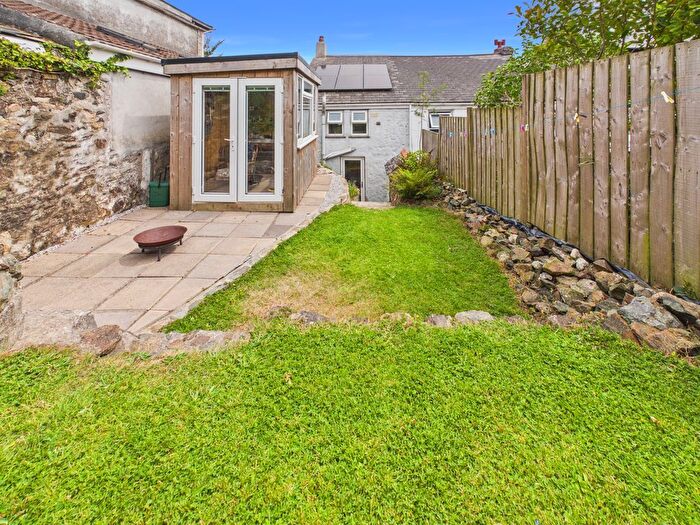
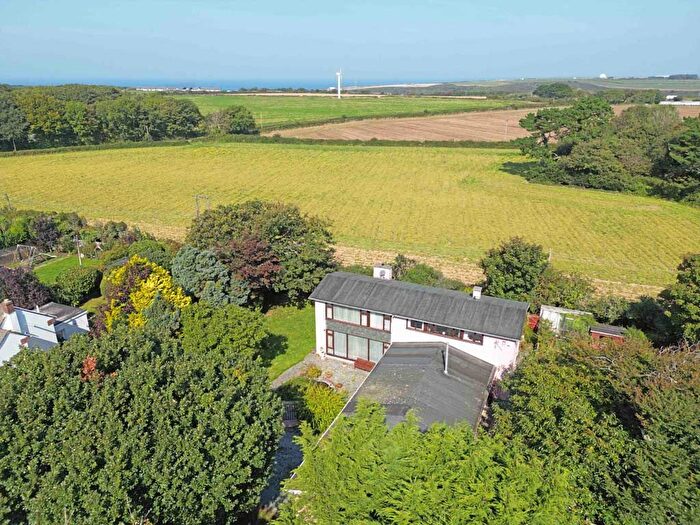
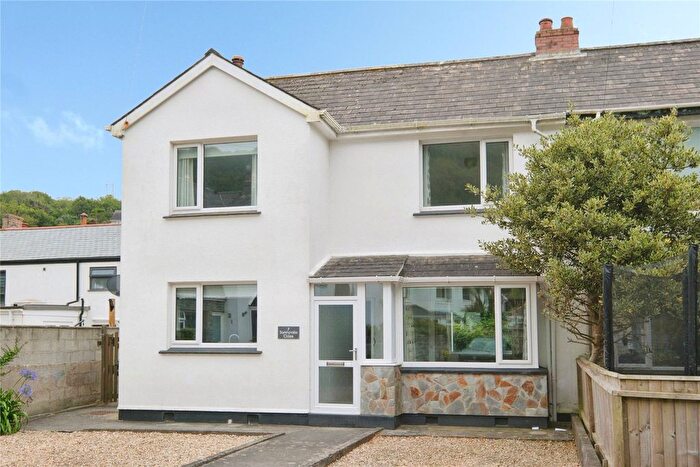
Properties for sale near TR16 4RU, Nettles Row
![]()
If you are looking to sell your house, let it out, or receive a property valuation, an expert can help you.
Click the button below to get started.
Price Paid in Nettles Row, TR16 4RU, Illogan
2 Nettles Row, TR16 4RU, Illogan Redruth
Property 2 has been sold 2 times. The last time it was sold was in 15/07/2021 and the sold price was £200,000.00.
This terraced house, sold as a freehold on 15/07/2021, is a 55 sqm mid-terrace house with an EPC rating of D.
| Date | Price | Property Type | Tenure | Classification |
|---|---|---|---|---|
| 15/07/2021 | £200,000.00 | Terraced House | freehold | Established Building |
| 13/09/2002 | £92,500.00 | Terraced House | freehold | Established Building |
3 Nettles Row, TR16 4RU, Illogan Redruth
Property 3 has been sold 1 time. The last time it was sold was in 08/05/2015 and the sold price was £138,000.00.
This terraced house, sold as a freehold on 08/05/2015, is a 49 sqm mid-terrace house with an EPC rating of E.
| Date | Price | Property Type | Tenure | Classification |
|---|---|---|---|---|
| 08/05/2015 | £138,000.00 | Terraced House | freehold | Established Building |
1 Nettles Row Trevelyan Road Paynters Lane End, TR16 4RU, Illogan Redruth
This is a 88 square meter End-terrace House with an EPC rating of C. Currently, there is no transaction history available for this property.
Property price trends in TR16 4RU, Nettles Row
According to the latest Land Registry data, the average home in TR16 4RU, Nettles Row sold for £200,000 in 2021. That figure comes from 3 sales logged over the past 19 years.
Looking back five years, average prices are up about 44.9% since 2015, a gain of around £62,000 in cash terms.
Property Price Paid in TR16 4RU, Nettles Row by Year
The average sold property price by year was:
| Year | Average Sold Price | Price Change |
Sold Properties
|
|---|---|---|---|
| 2021 | £200,000 | 31% |
1 Property |
| 2015 | £138,000 | 33% |
1 Property |
| 2002 | £92,500 | - |
1 Property |
