
Houses for sale in TR15 1QJ, Penpont Road, Redruth Central, Redruth
House Prices in TR15 1QJ, Penpont Road, Redruth Central
Properties in TR15 1QJ have no sales history available within the last 3 years. TR15 1QJ is a postcode in Penpont Road located in Redruth Central, an area in Redruth, Cornwall, with 10 households².
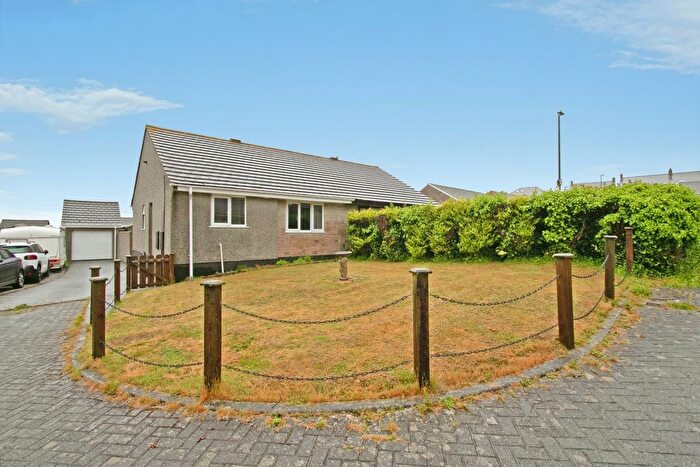
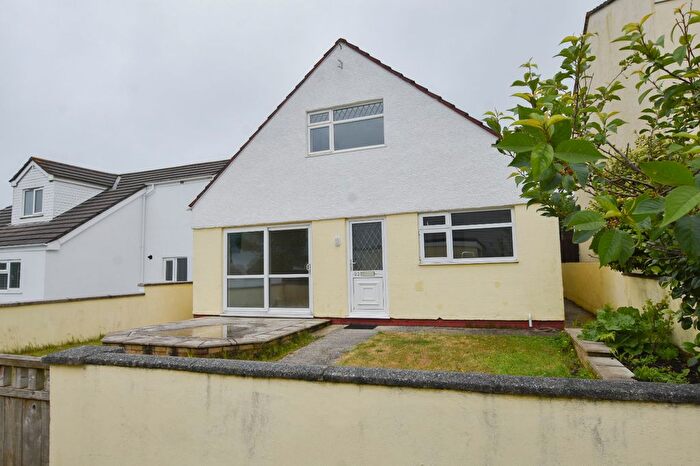
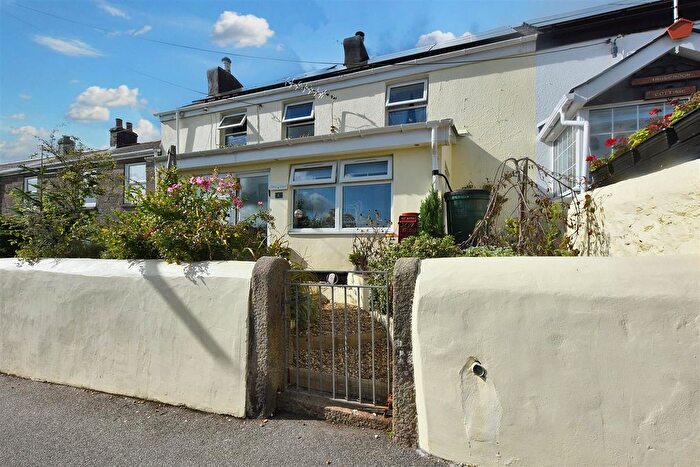
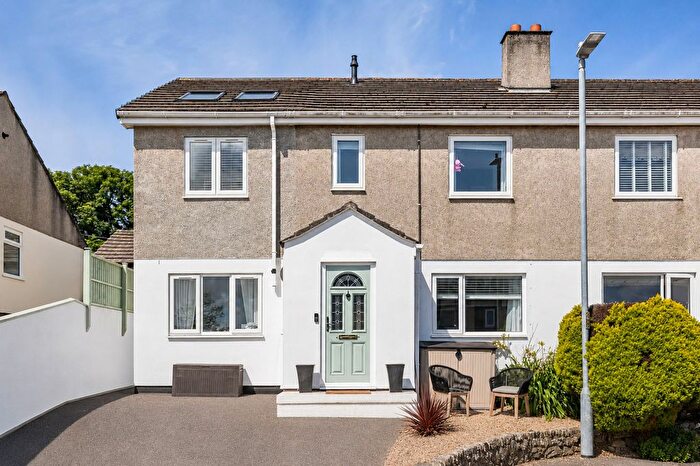
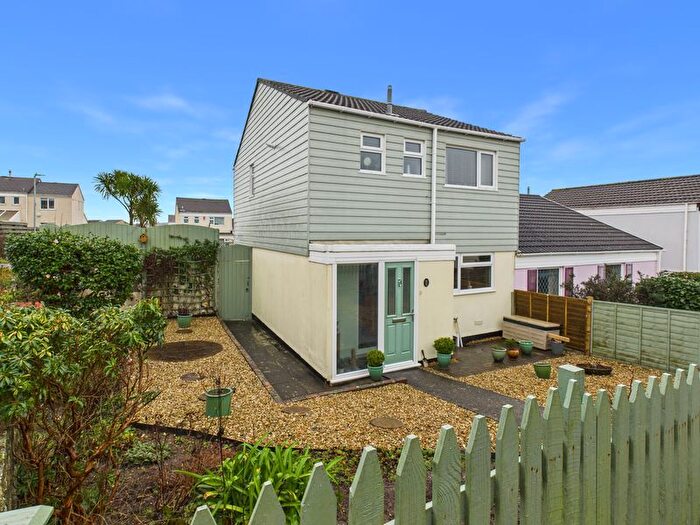
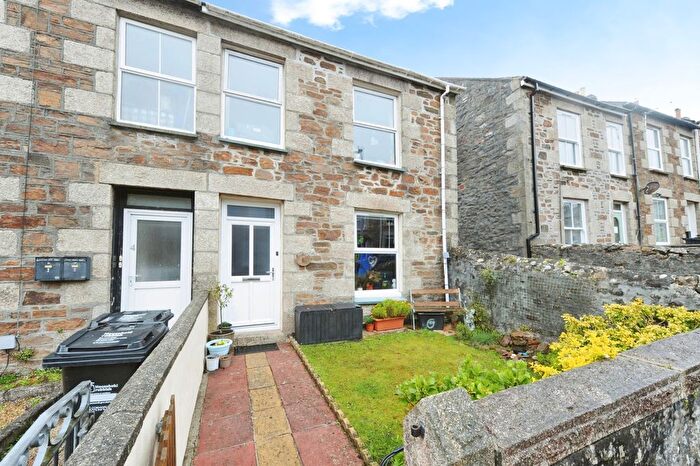
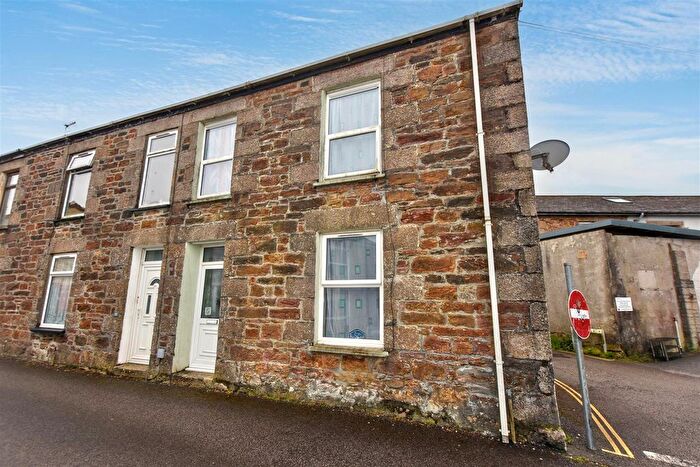
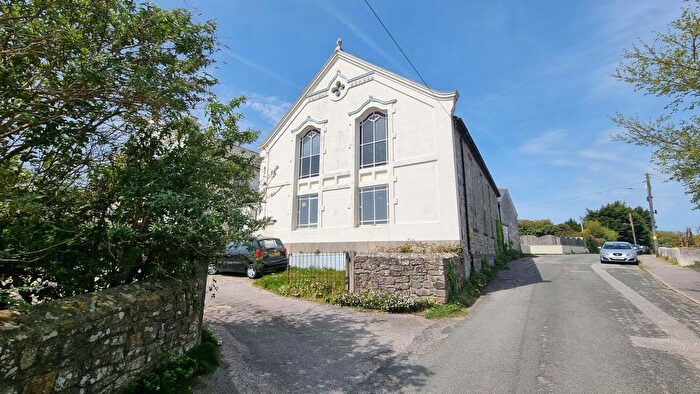
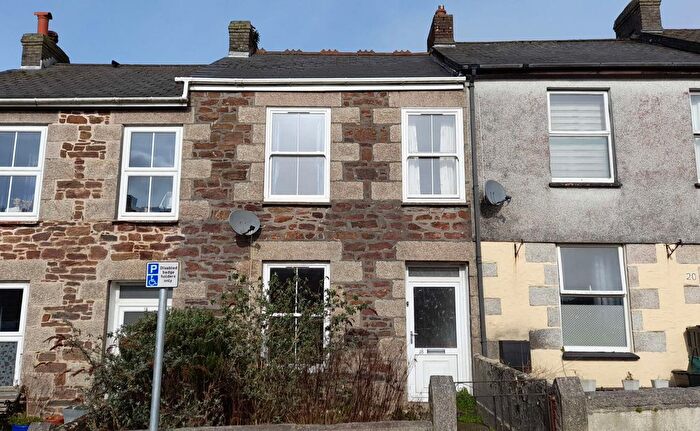
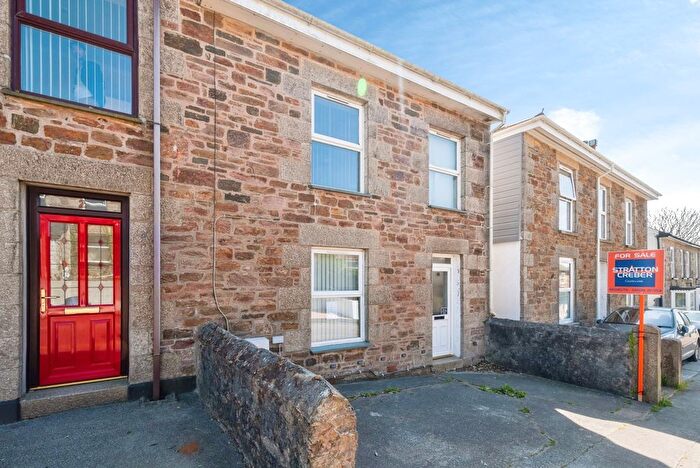
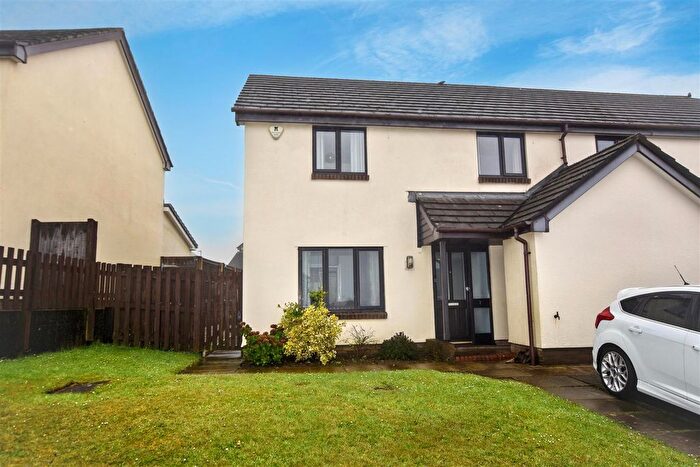
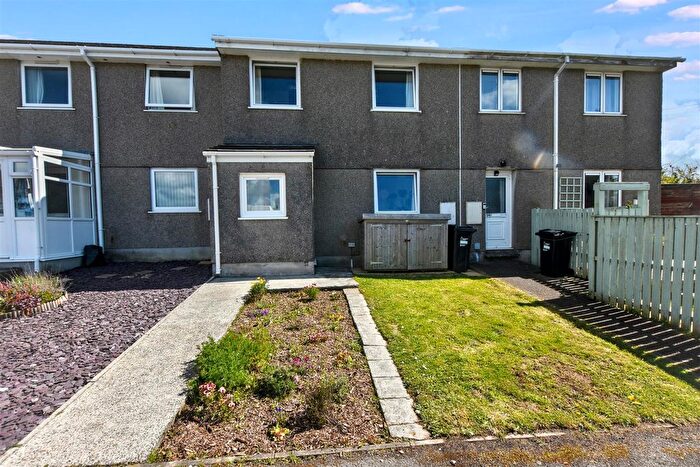
Properties for sale near TR15 1QJ, Penpont Road
![]()
If you are looking to sell your house, let it out, or receive a property valuation, an expert can help you.
Click the button below to get started.
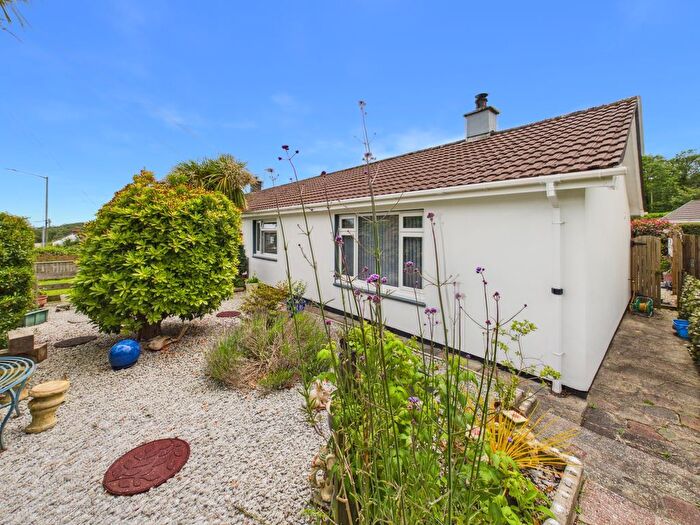
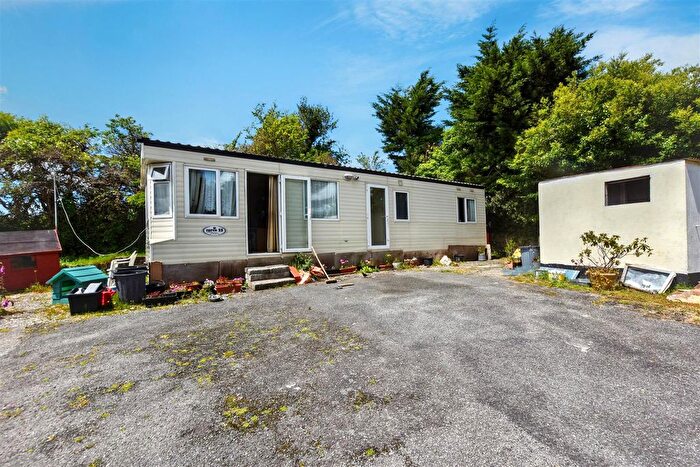
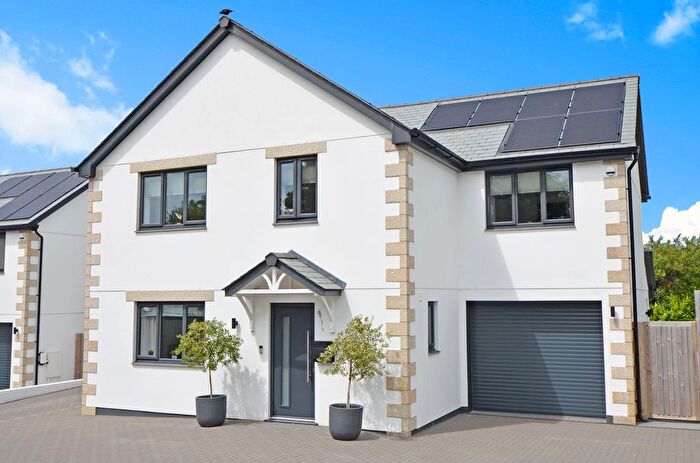
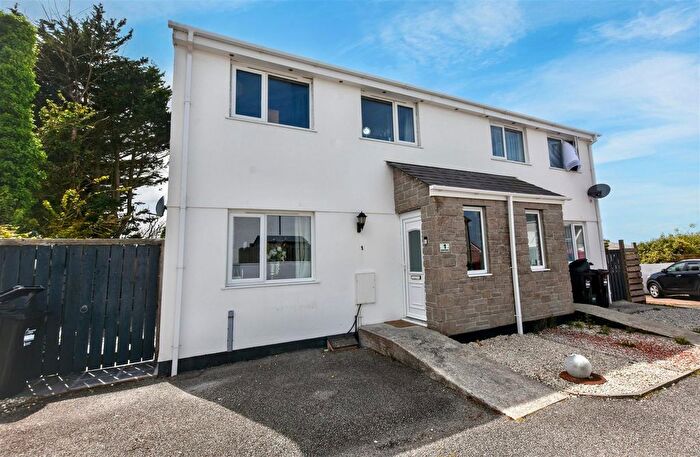
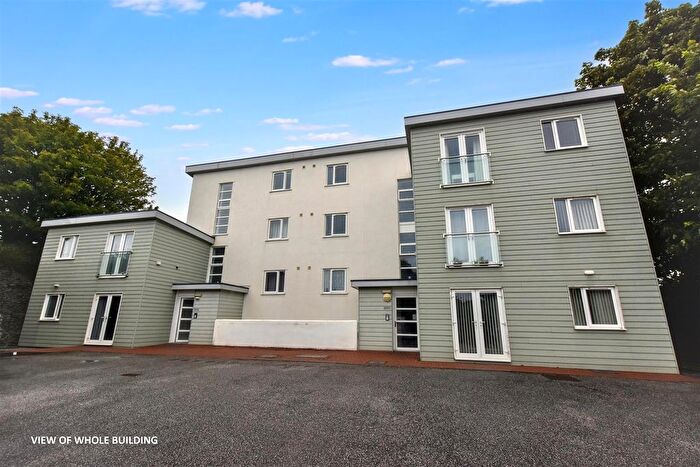
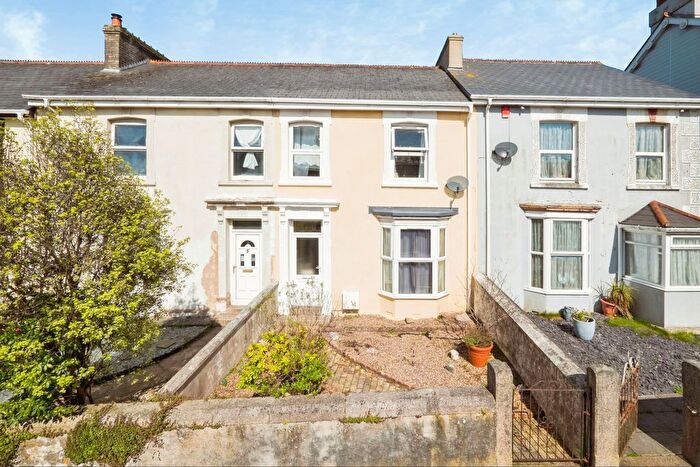
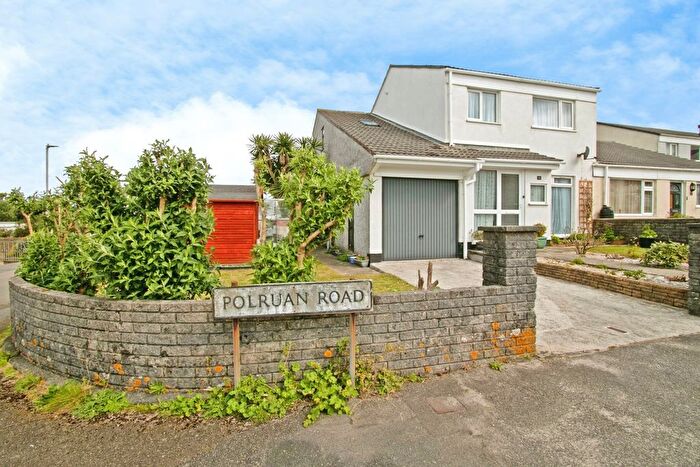
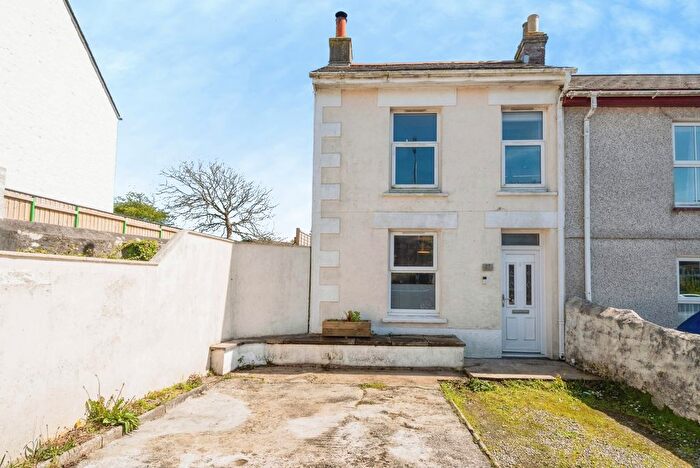
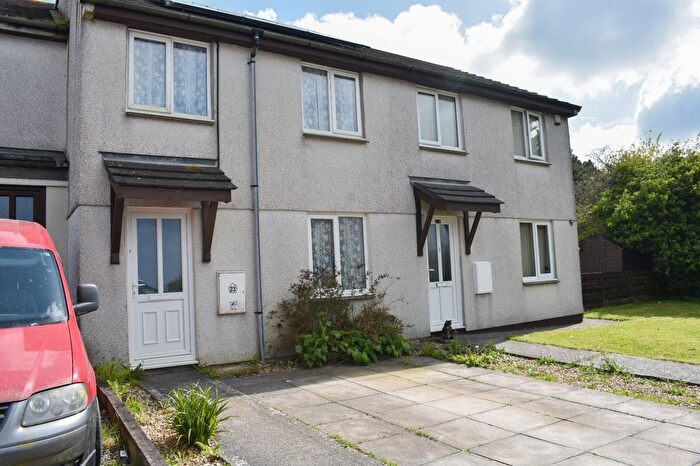
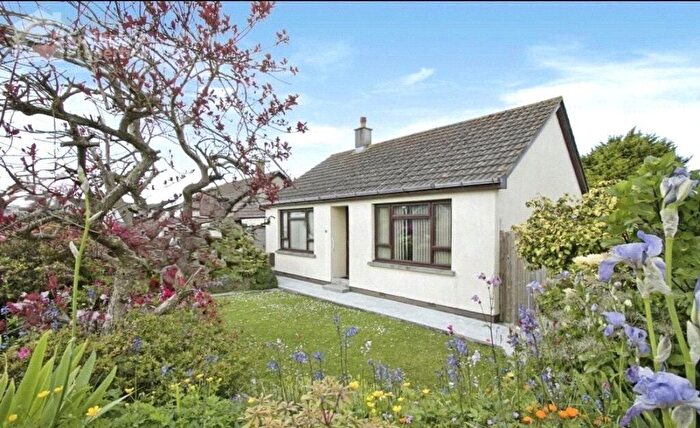
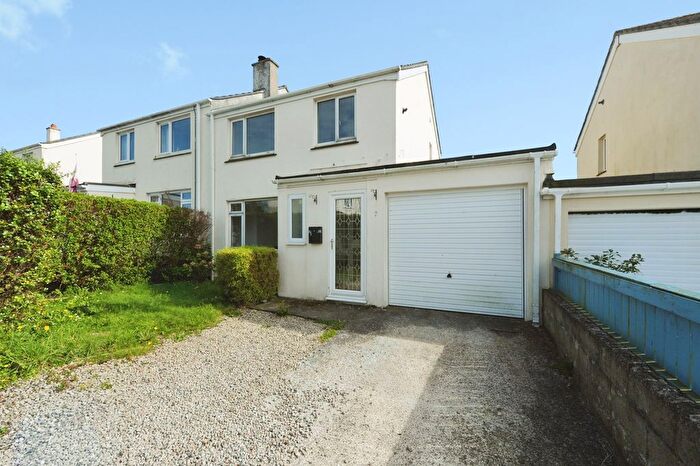
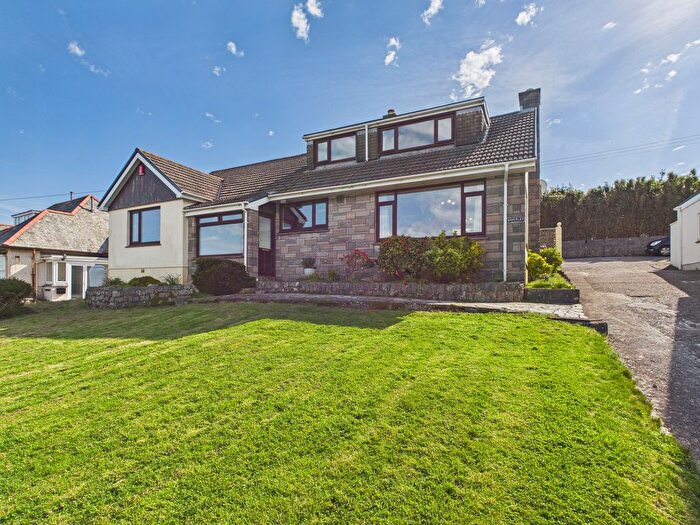
Previously listed properties near TR15 1QJ, Penpont Road
![]()
If you are looking to sell your house, let it out, or receive a property valuation, an expert can help you.
Click the button below to get started.
Price Paid in Penpont Road, TR15 1QJ, Redruth Central
8 Penpont Road, TR15 1QJ, Redruth Central Redruth
Property 8 has been sold 2 times. The last time it was sold was in 19/09/2025 and the sold price was £277,500.00.
This is a Semi Detached House which was sold as a freehold in 19/09/2025
| Date | Price | Property Type | Tenure | Classification |
|---|---|---|---|---|
| 19/09/2025 | £277,500.00 | Semi Detached House | freehold | Established Building |
| 01/08/2001 | £79,950.00 | Semi Detached House | freehold | Established Building |
11 Penpont Road, TR15 1QJ, Redruth Central Redruth
Property 11 has been sold 1 time. The last time it was sold was in 16/11/2021 and the sold price was £235,000.00.
This detached house, sold as a freehold on 16/11/2021, is a 75 sqm detached bungalow with an EPC rating of D.
| Date | Price | Property Type | Tenure | Classification |
|---|---|---|---|---|
| 16/11/2021 | £235,000.00 | Detached House | freehold | Established Building |
9 Penpont Road, TR15 1QJ, Redruth Central Redruth
Property 9 has been sold 1 time. The last time it was sold was in 15/12/2017 and the sold price was £205,000.00.
This detached house, sold as a freehold on 15/12/2017, is a 79 sqm detached house with an EPC rating of C.
| Date | Price | Property Type | Tenure | Classification |
|---|---|---|---|---|
| 15/12/2017 | £205,000.00 | Detached House | freehold | Established Building |
4 Penpont Road, TR15 1QJ, Redruth Central Redruth
Property 4 has been sold 3 times. The last time it was sold was in 25/09/2012 and the sold price was £167,500.00.
This detached house, sold as a freehold on 25/09/2012, is a 81 sqm detached house with an EPC rating of C.
| Date | Price | Property Type | Tenure | Classification |
|---|---|---|---|---|
| 25/09/2012 | £167,500.00 | Detached House | freehold | Established Building |
| 25/11/2005 | £174,500.00 | Detached House | freehold | Established Building |
| 18/08/2004 | £146,000.00 | Detached House | freehold | Established Building |
1 Penpont Road, TR15 1QJ, Redruth Central Redruth
Property 1 has been sold 2 times. The last time it was sold was in 24/09/2010 and the sold price was £170,000.00.
This is a Semi Detached House which was sold as a freehold in 24/09/2010
| Date | Price | Property Type | Tenure | Classification |
|---|---|---|---|---|
| 24/09/2010 | £170,000.00 | Semi Detached House | freehold | Established Building |
| 02/03/2001 | £73,950.00 | Semi Detached House | freehold | Established Building |
7 Penpont Road, TR15 1QJ, Redruth Central Redruth
Property 7 has been sold 1 time. The last time it was sold was in 28/07/2006 and the sold price was £159,950.00.
This is a Semi Detached House which was sold as a freehold in 28/07/2006
| Date | Price | Property Type | Tenure | Classification |
|---|---|---|---|---|
| 28/07/2006 | £159,950.00 | Semi Detached House | freehold | Established Building |
2 Penpont Road, TR15 1QJ, Redruth Central Redruth
Property 2 has been sold 1 time. The last time it was sold was in 20/12/2001 and the sold price was £87,500.00.
This is a Semi Detached House which was sold as a freehold in 20/12/2001
| Date | Price | Property Type | Tenure | Classification |
|---|---|---|---|---|
| 20/12/2001 | £87,500.00 | Semi Detached House | freehold | Established Building |
Property price trends in TR15 1QJ, Penpont Road
According to the latest Land Registry data, the average home in TR15 1QJ, Penpont Road sold for £235,000 in 2021. That figure comes from 10 sales logged over the past 20 years.
Prices have continued to climb over the last three years. Compared with 2017, when the typical sale came in around £205,000, that's a rise of roughly 14.6%.
Looking back five years, average prices are up about 14.6% since 2017, a gain of around £30,000 in cash terms.
Zoom out to the past decade for the fuller picture. Back in 2010, homes here averaged £170,000, so the typical sold price has climbed about 38.2% since then, roughly 3% a year. Stretch the view to fifteen years and that annual pace eases back to about 2.6%.
Property Price Paid in TR15 1QJ, Penpont Road by Year
The average sold property price by year was:
| Year | Average Sold Price | Price Change |
Sold Properties
|
|---|---|---|---|
| 2021 | £235,000 | 13% |
1 Property |
| 2017 | £205,000 | 18% |
1 Property |
| 2012 | £167,500 | -1% |
1 Property |
| 2010 | £170,000 | 6% |
1 Property |
| 2006 | £159,950 | -9% |
1 Property |
| 2005 | £174,500 | 16% |
1 Property |
| 2004 | £146,000 | 45% |
1 Property |
| 2001 | £80,466 | - |
3 Properties |
