
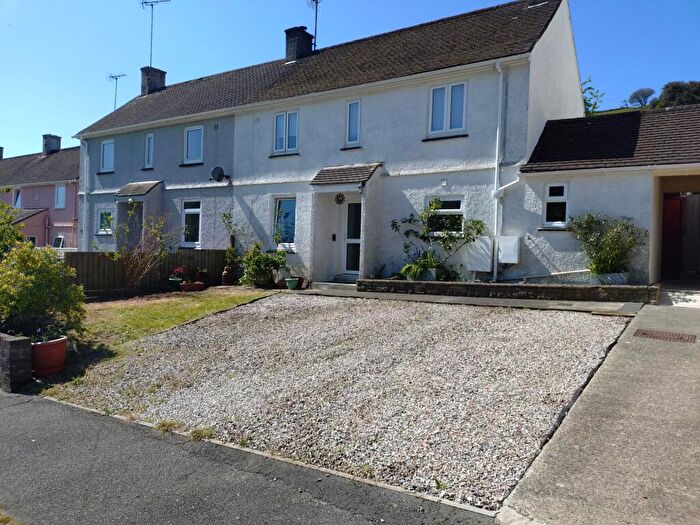
Houses for sale in PL10 1LG, Rame Peninsular, Torpoint
House Prices in PL10 1LG, Rame Peninsular
Properties in PL10 1LG have no sales history available within the last 3 years. PL10 1LG is a postcode in Rame Peninsular, an area in Torpoint, Cornwall, with 5 households².
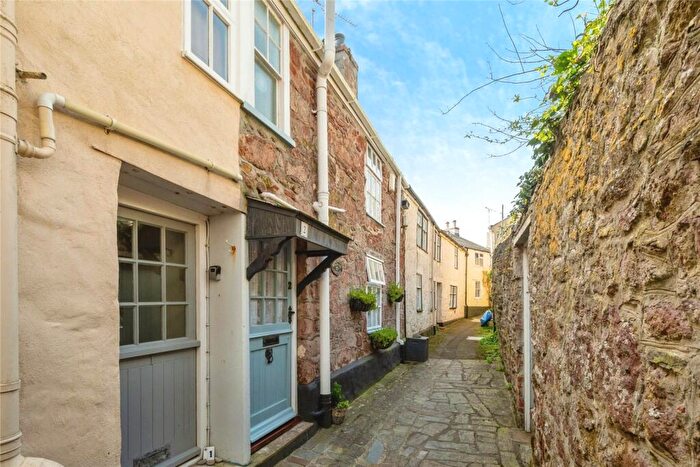
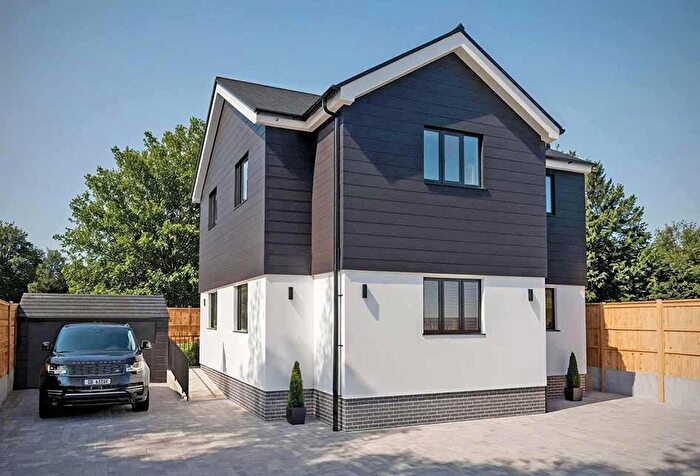
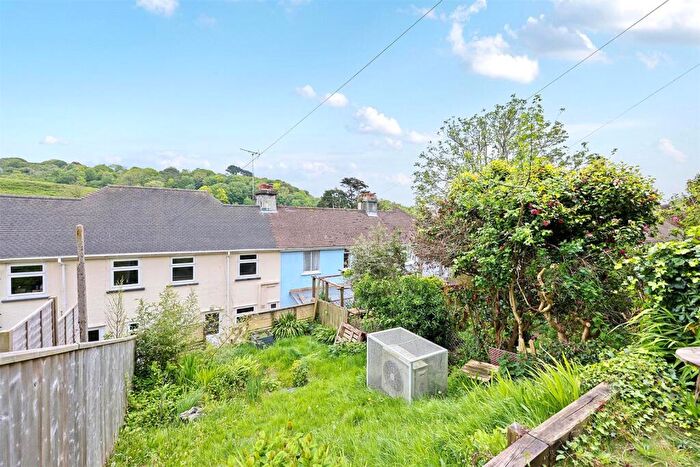
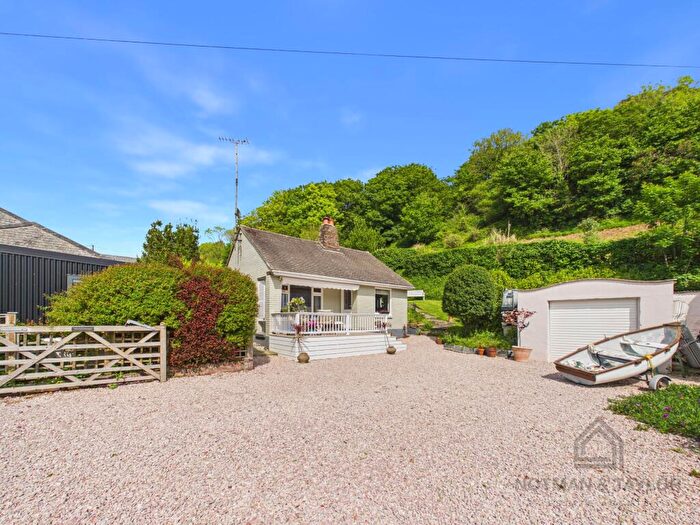
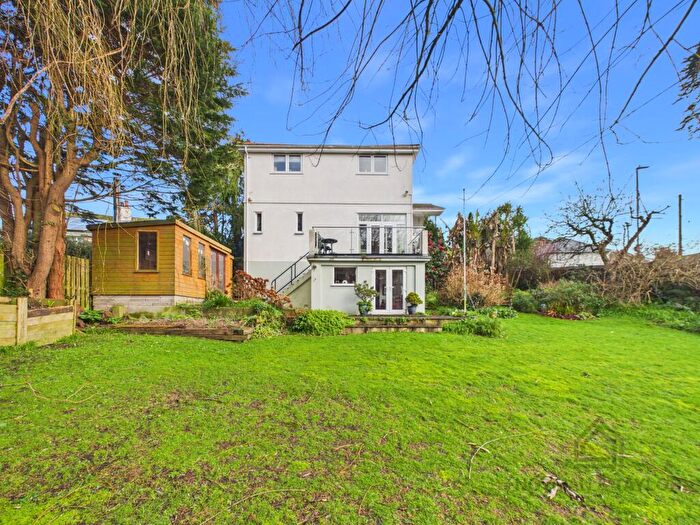
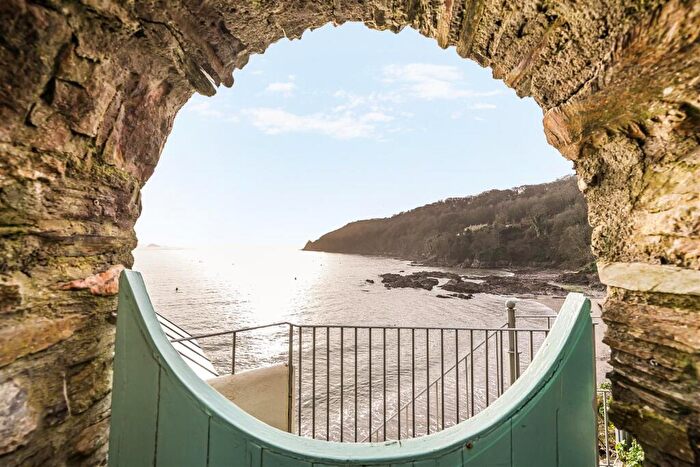
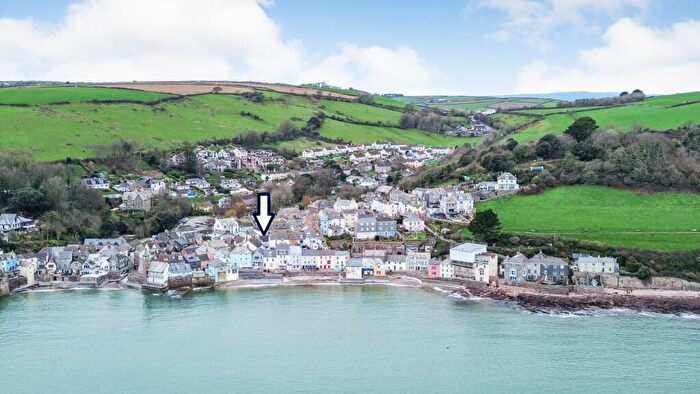
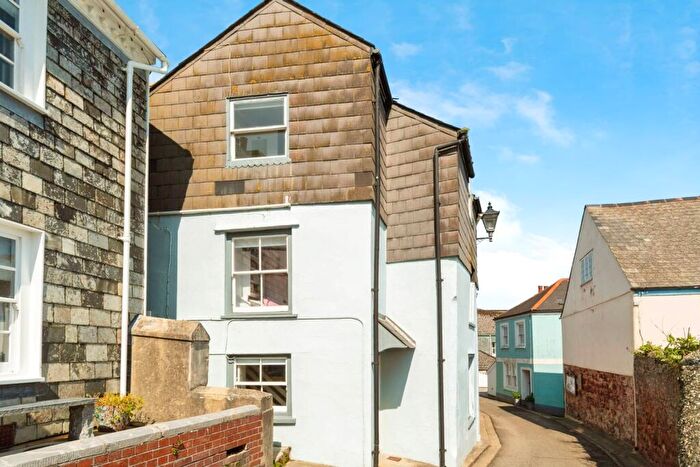
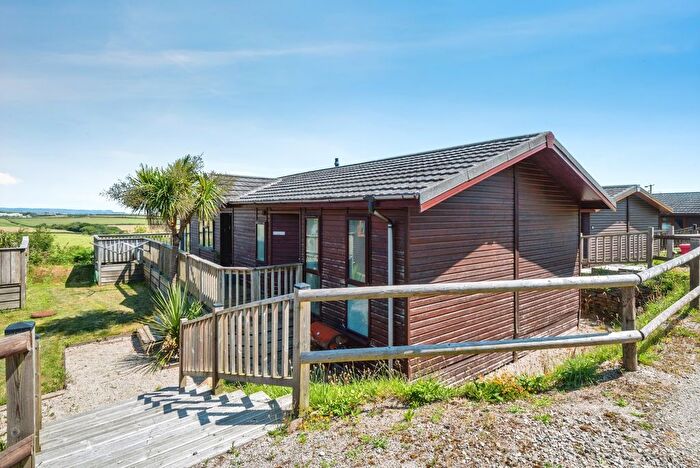
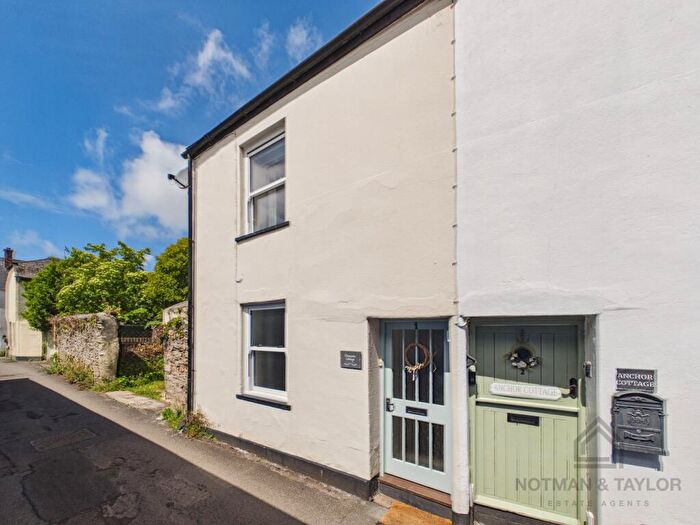
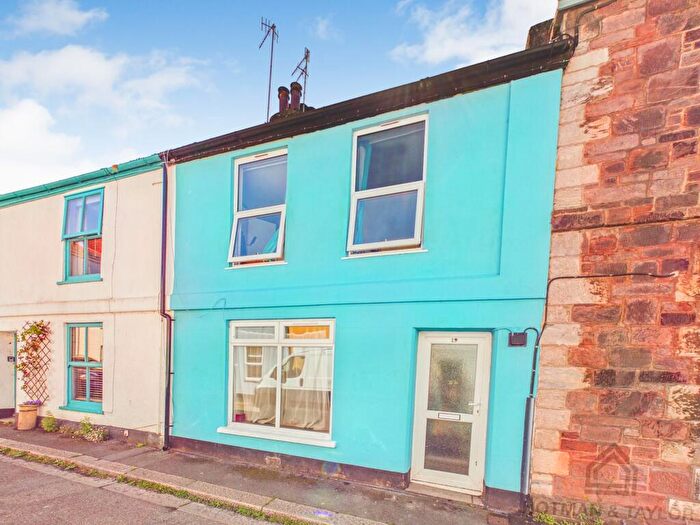
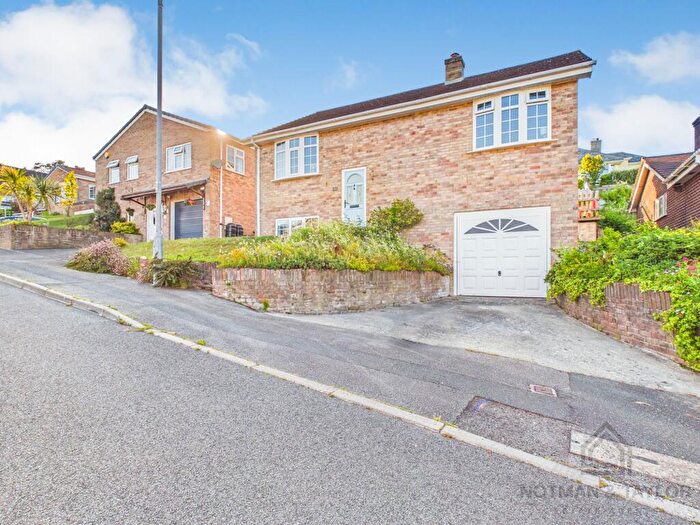
Properties for sale near PL10 1LG

![]()
If you are looking to sell your house, let it out, or receive a property valuation, an expert can help you.
Click the button below to get started.


Price Paid in PL10 1LG, Rame Peninsular
THE OLD RECTORY 1 PL10 1LG, Rame Peninsular Torpoint
Property THE OLD RECTORY 1 has been sold 4 times. The last time it was sold was in 29/03/2010 and the sold price was £470,000.00.
This is a Semi Detached House which was sold as a freehold in 29/03/2010
| Date | Price | Property Type | Tenure | Classification |
|---|---|---|---|---|
| 29/03/2010 | £470,000.00 | Semi Detached House | freehold | Established Building |
| 01/04/2004 | £325,000.00 | Semi Detached House | freehold | Established Building |
| 17/09/2001 | £220,000.00 | Semi Detached House | freehold | Established Building |
| 28/01/1999 | £110,000.00 | Semi Detached House | freehold | Established Building |
THE OLD RECTORY 2 PL10 1LG, Rame Peninsular Torpoint
Property THE OLD RECTORY 2 has been sold 2 times. The last time it was sold was in 29/03/2010 and the sold price was £300,000.00.
This is a Semi Detached House which was sold as a freehold in 29/03/2010
| Date | Price | Property Type | Tenure | Classification |
|---|---|---|---|---|
| 29/03/2010 | £300,000.00 | Semi Detached House | freehold | Established Building |
| 27/08/1999 | £90,000.00 | Semi Detached House | freehold | Established Building |
Property price trends in PL10 1LG
According to the latest Land Registry data, the average home in PL10 1LG sold for £385,000 in 2010. That figure comes from 6 sales logged over the past 11 years.
Looking back five years, average prices are up about 18.5% since 2004, a gain of around £60,000 in cash terms.
Zoom out to the past decade for the fuller picture. Back in 1999, homes here averaged £100,000, so the typical sold price has climbed about 285% since then, roughly 13% a year.
Property Price Paid in PL10 1LG by Year
The average sold property price by year was:
| Year | Average Sold Price | Price Change |
Sold Properties
|
|---|---|---|---|
| 2010 | £385,000 | 16% |
2 Properties |
| 2004 | £325,000 | 32% |
1 Property |
| 2001 | £220,000 | 55% |
1 Property |
| 1999 | £100,000 | - |
2 Properties |
