
Houses for sale in PL11 3DQ, FINNYGOOK LANE, Rame Peninsular, Torpoint
House Prices in PL11 3DQ, FINNYGOOK LANE, Rame Peninsular
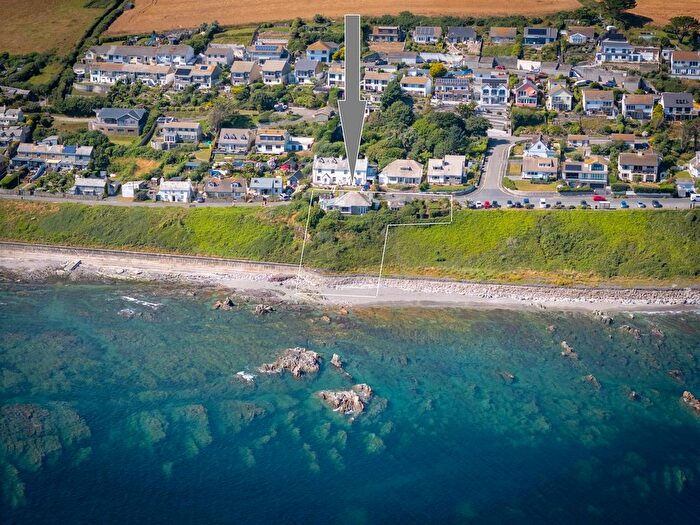
Properties in PL11 3DQ have an average house price of £590k and had 1 Property Transaction within the last 3 years.¹ PL11 3DQ is a postcode in FINNYGOOK LANE located in Rame Peninsular, an area in Torpoint, Cornwall, with 0 household², where the most expensive property was sold for £590k.
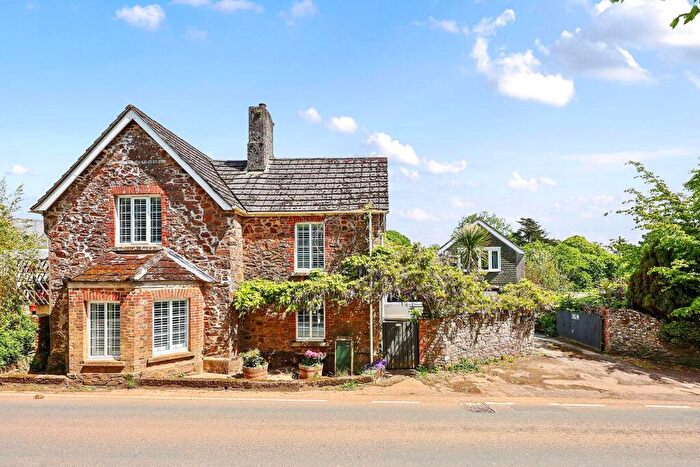
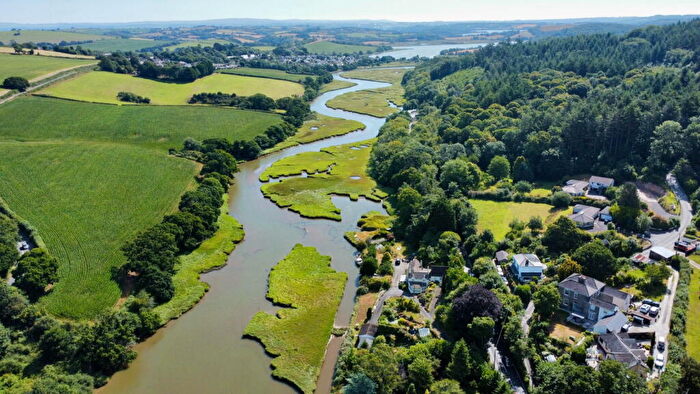
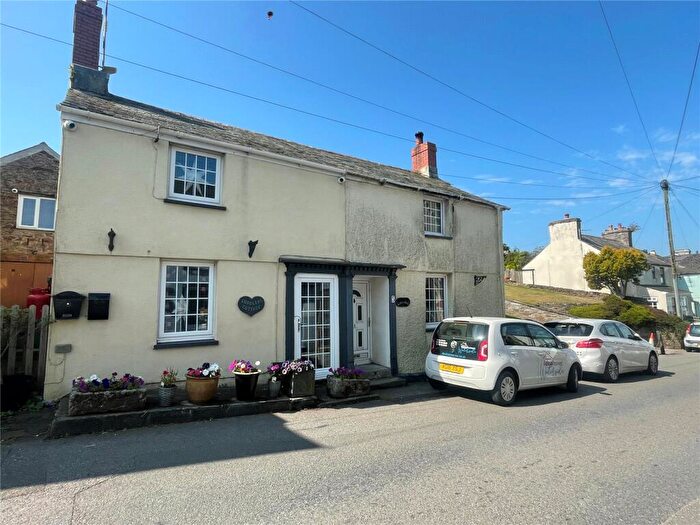
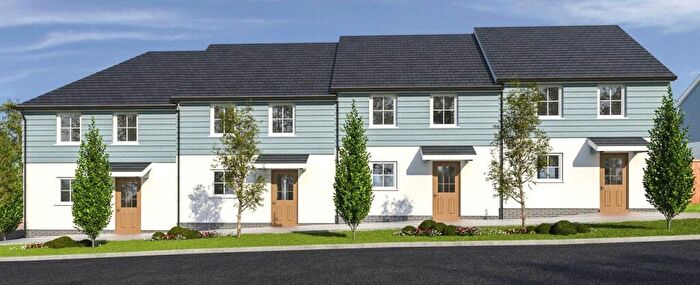
Properties for sale near PL11 3DQ, FINNYGOOK LANE
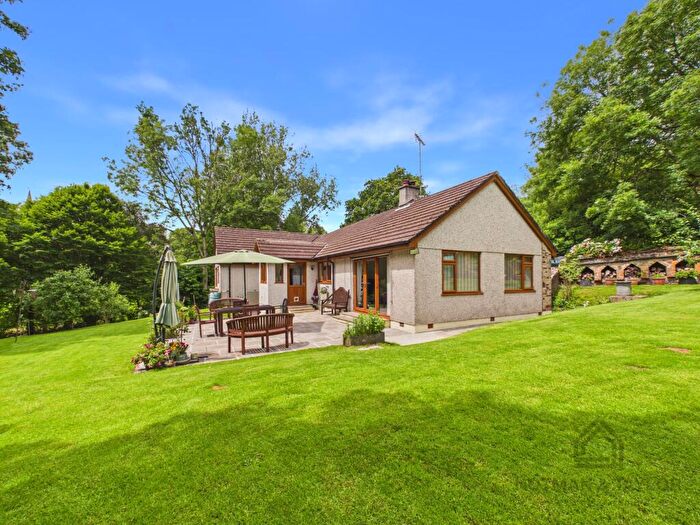
![]()
If you are looking to sell your house, let it out, or receive a property valuation, an expert can help you.
Click the button below to get started.
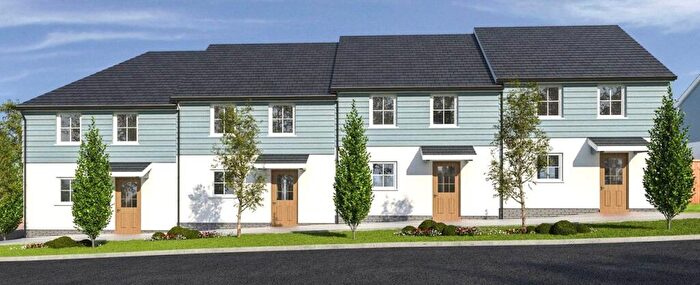
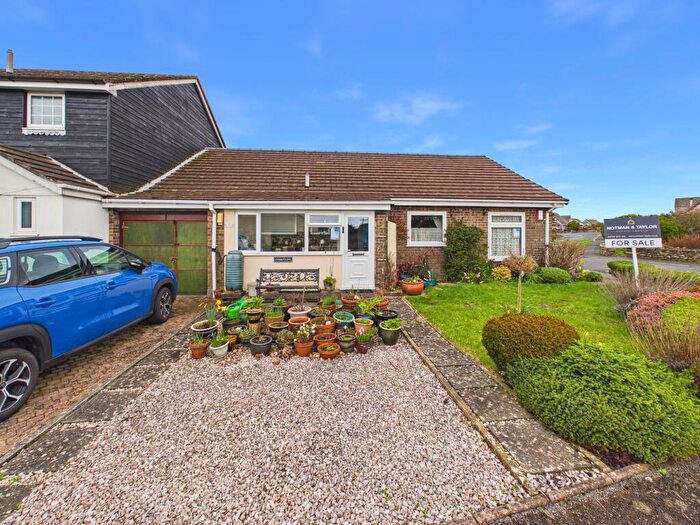

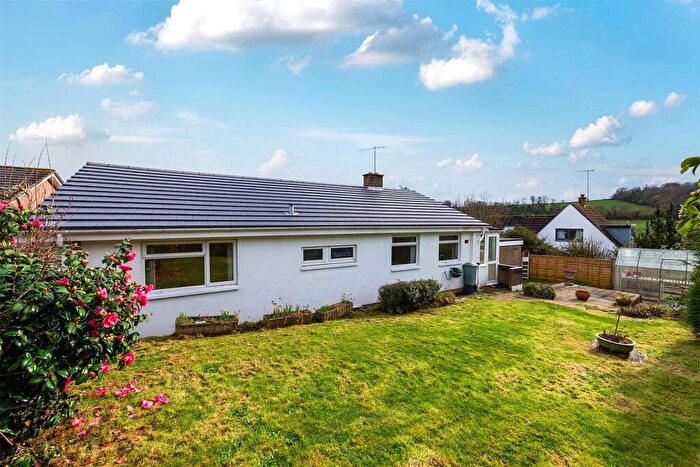

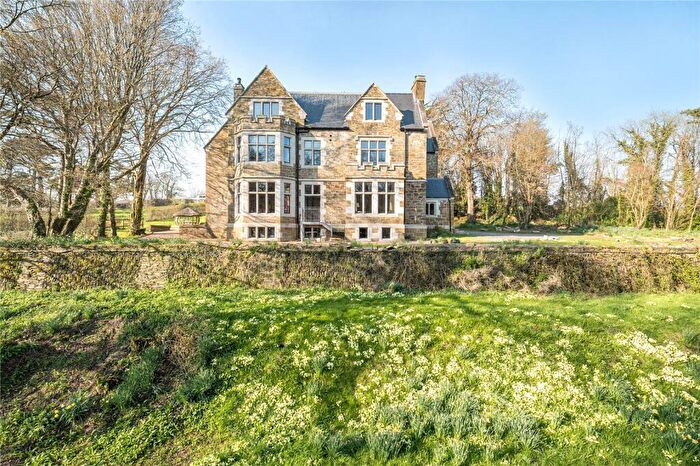
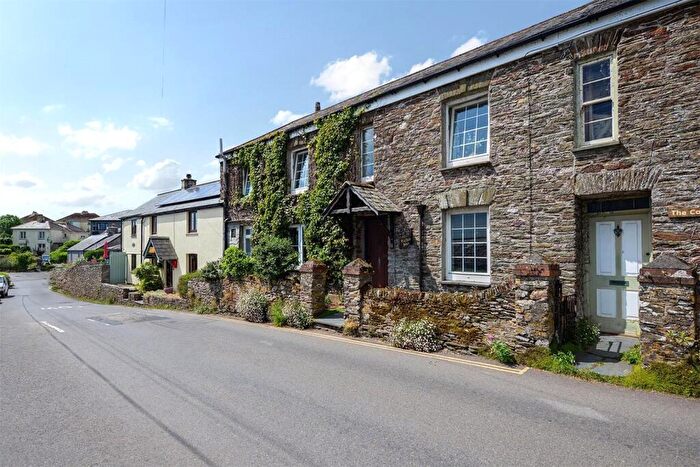
Previously listed properties near PL11 3DQ, FINNYGOOK LANE


![]()
If you are looking to sell your house, let it out, or receive a property valuation, an expert can help you.
Click the button below to get started.
Price Paid in FINNYGOOK LANE, PL11 3DQ, Rame Peninsular
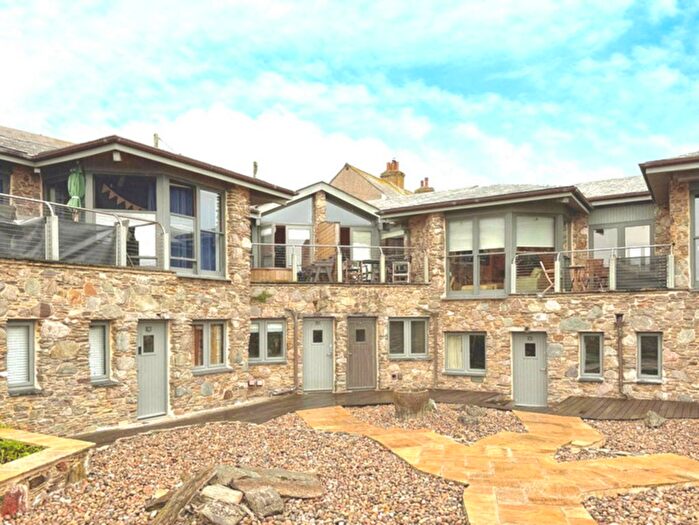
THE FISH CELLARS 5 FINNYGOOK LANE, PL11 3DQ, Rame Peninsular Torpoint
Property THE FISH CELLARS 5 has been sold 1 time. The last time it was sold was in 25/09/2023 and the sold price was £590,000.00.
This is a Terraced House which was sold as a leasehold in 25/09/2023
| Date | Price | Property Type | Tenure | Classification |
|---|---|---|---|---|
| 25/09/2023 | £590,000.00 | Terraced House | leasehold | Established Building |
THE FISH CELLARS 3 FINNYGOOK LANE, PL11 3DQ, Rame Peninsular Torpoint
Property THE FISH CELLARS 3 has been sold 2 times. The last time it was sold was in 28/09/2021 and the sold price was £505,000.00.
This is a Terraced House which was sold as a leasehold in 28/09/2021
| Date | Price | Property Type | Tenure | Classification |
|---|---|---|---|---|
| 28/09/2021 | £505,000.00 | Terraced House | leasehold | Established Building |
| 01/06/2015 | £370,000.00 | Terraced House | leasehold | Established Building |
THE FISH CELLARS 4 FINNYGOOK LANE, PL11 3DQ, Rame Peninsular Torpoint
Property THE FISH CELLARS 4 has been sold 1 time. The last time it was sold was in 17/07/2019 and the sold price was £350,000.00.
This is a Flat which was sold as a leasehold in 17/07/2019
| Date | Price | Property Type | Tenure | Classification |
|---|---|---|---|---|
| 17/07/2019 | £350,000.00 | Flat | leasehold | Established Building |
THE FISH CELLARS 2 FINNYGOOK LANE, PL11 3DQ, Rame Peninsular Torpoint
Property THE FISH CELLARS 2 has been sold 1 time. The last time it was sold was in 31/03/2016 and the sold price was £375,000.00.
This is a Terraced House which was sold as a leasehold in 31/03/2016
| Date | Price | Property Type | Tenure | Classification |
|---|---|---|---|---|
| 31/03/2016 | £375,000.00 | Terraced House | leasehold | Established Building |
2 The Fish Cellars Finnygook Lane Portwrinkle, PL11 3DQ, Rame Peninsular Torpoint
This is a 134 square meter Mid-terrace House with an EPC rating of D. Currently, there is no transaction history available for this property.
5 The Fish Cellars Finnygook Lane, PL11 3DQ, Rame Peninsular Torpoint
This is a 142 square meter Mid-terrace House with an EPC rating of C. Currently, there is no transaction history available for this property.
3 THE FISH CELLARS ACCESS TO GARAGES REAR OF 5 DONKEY LANE FROM FINNYGOOK LANE, PL11 3DQ, Rame Peninsular Torpoint
This is a 139 square meter Mid-terrace House with an EPC rating of C. Currently, there is no transaction history available for this property.
4 The Fish Cellars Finnygook Lane Portwrinkle, PL11 3DQ, Rame Peninsular Torpoint
This is a 148 square meter Mid-terrace House with an EPC rating of C. Currently, there is no transaction history available for this property.
Postcodes in FINNYGOOK LANE, Rame Peninsular
Navigate through other locations in FINNYGOOK LANE, Rame Peninsular, Torpoint to see more property listings for sale or to rent.
Property price trends in PL11 3DQ, FINNYGOOK LANE
According to the latest Land Registry data, the average home in PL11 3DQ, FINNYGOOK LANE sold for £590,000 in 2023. That figure comes from 5 sales logged over the past 8 years.
Prices have continued to climb over the last three years. Compared with 2019, when the typical sale came in around £350,000, that's a rise of roughly 68.6%.
Looking back five years, average prices are up about 68.6% since 2019, a gain of around £240,000 in cash terms.
Zoom out to the past decade for the fuller picture. Back in 2015, homes here averaged £370,000, so the typical sold price has climbed about 59.5% since then, roughly 6% a year.
Property Price Paid in PL11 3DQ, FINNYGOOK LANE by Year
The average sold property price by year was:
| Year | Average Sold Price | Price Change |
Sold Properties
|
|---|---|---|---|
| 2023 | £590,000 | 14% |
1 Property |
| 2021 | £505,000 | 31% |
1 Property |
| 2019 | £350,000 | -7% |
1 Property |
| 2016 | £375,000 | 1% |
1 Property |
| 2015 | £370,000 | - |
1 Property |
Property Price per Property Type in PL11 3DQ, FINNYGOOK LANE
Here you can find historic sold price data in order to help with your property search.
The average Property Paid Price for specific property types in the last three years are:
| Property Type | Average Sold Price | Sold Properties |
|---|---|---|
| Terraced House | £590,000.00 | 1 Terraced House |
