Houses for sale & to rent in Chester-le-street North, Chester Le Street
House Prices in Chester-le-street North
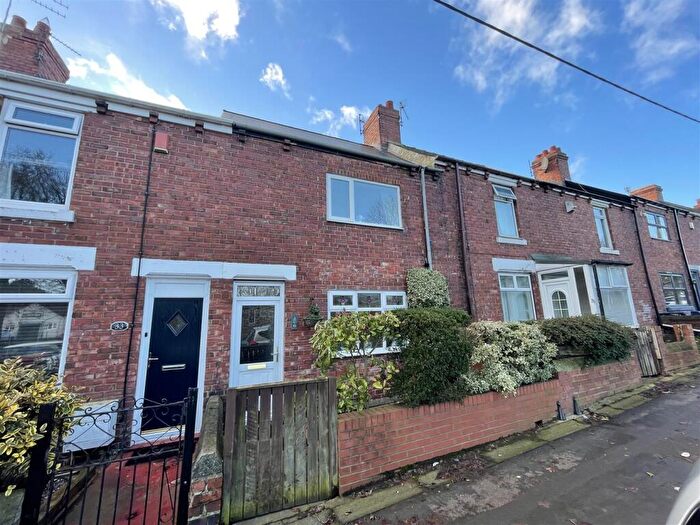
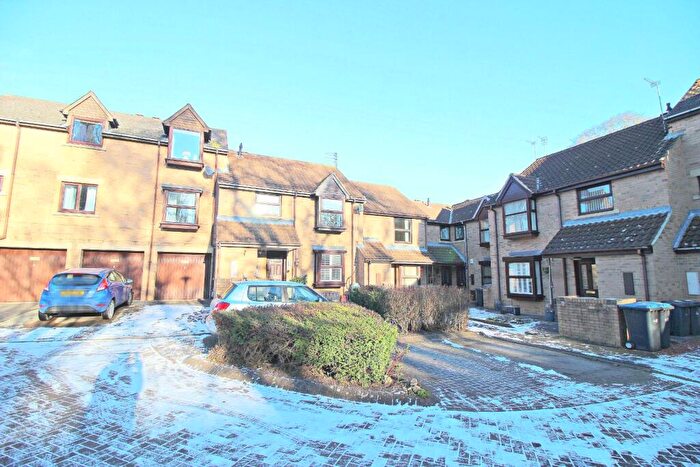
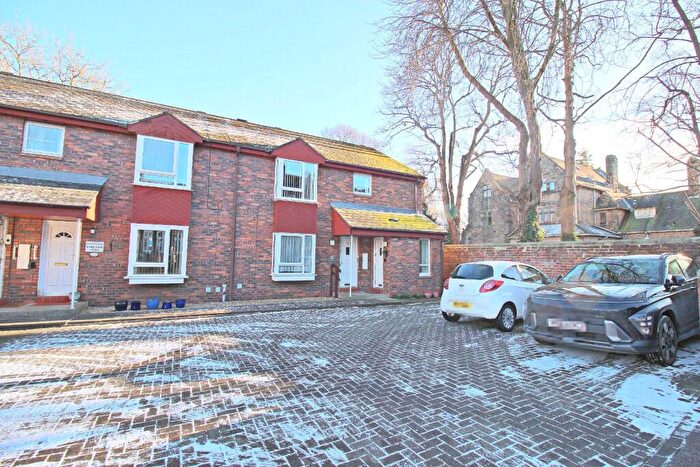
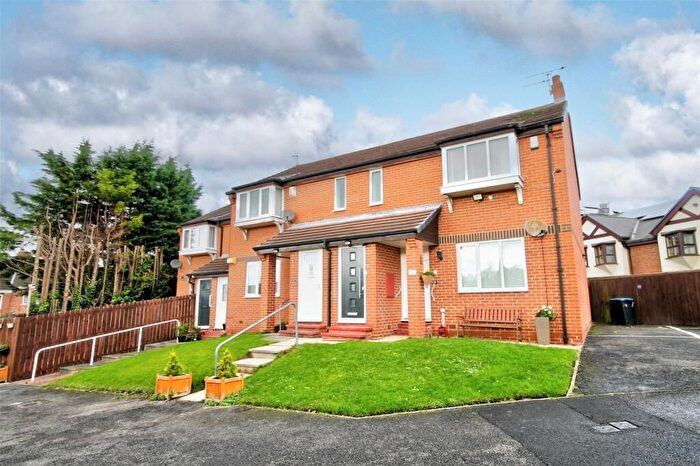
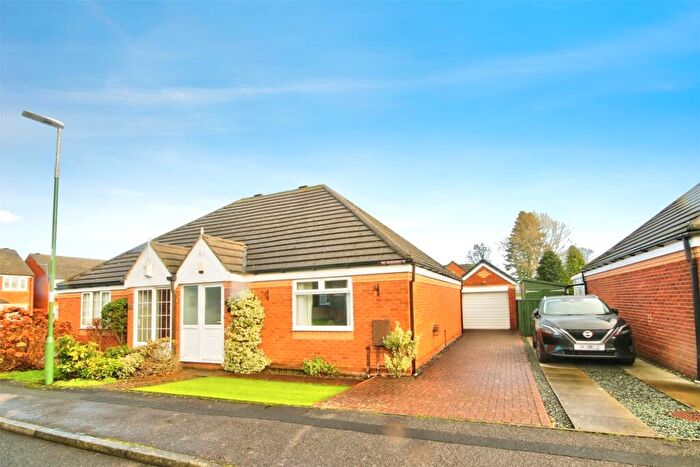
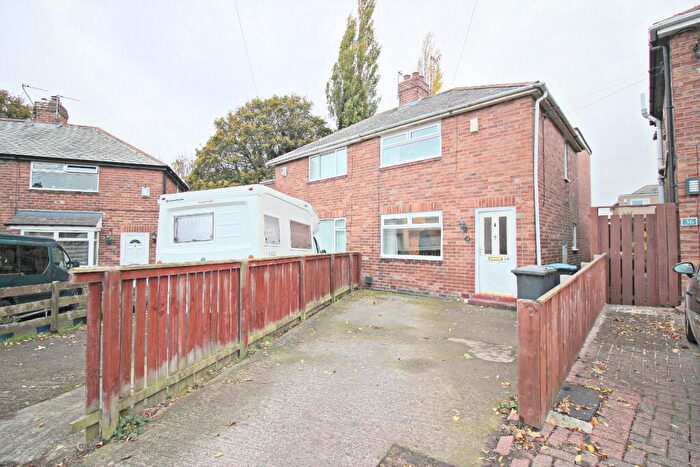
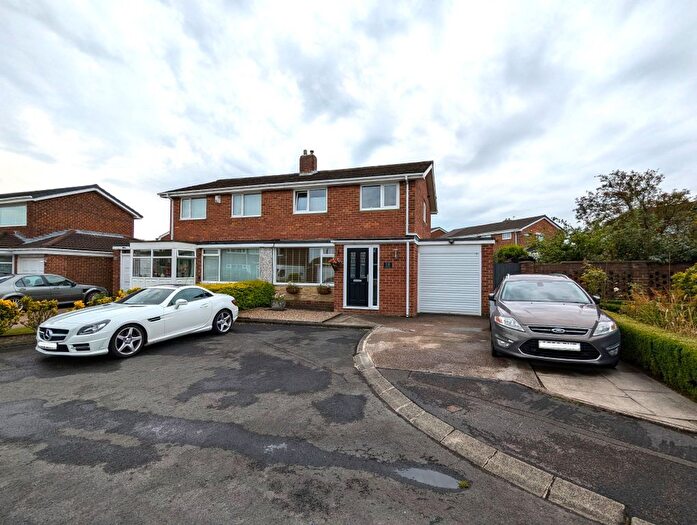
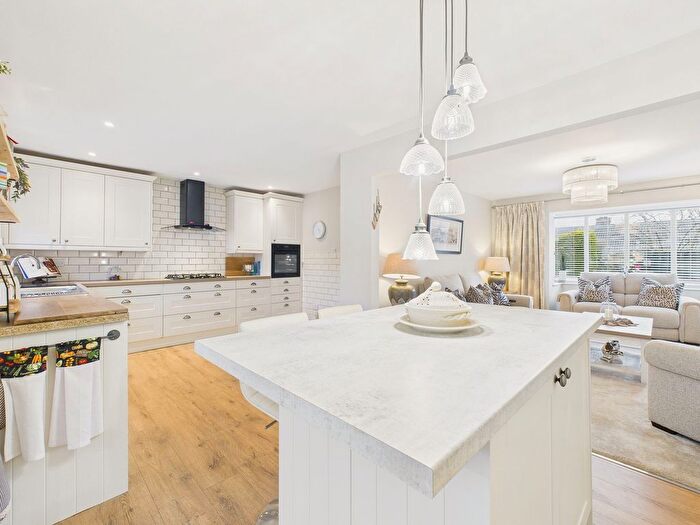
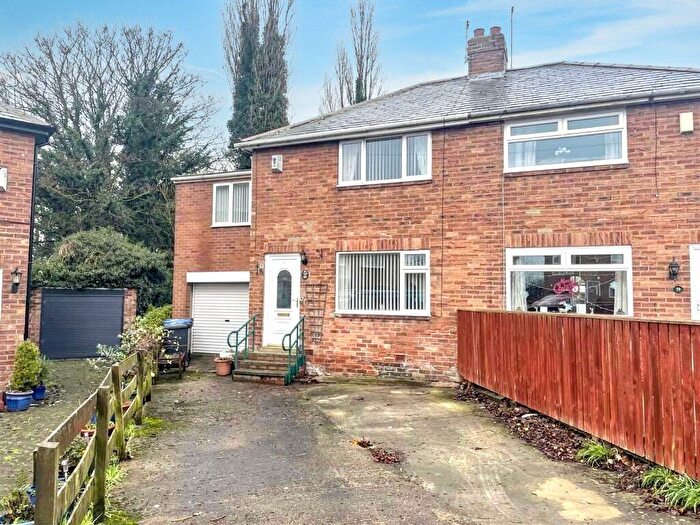
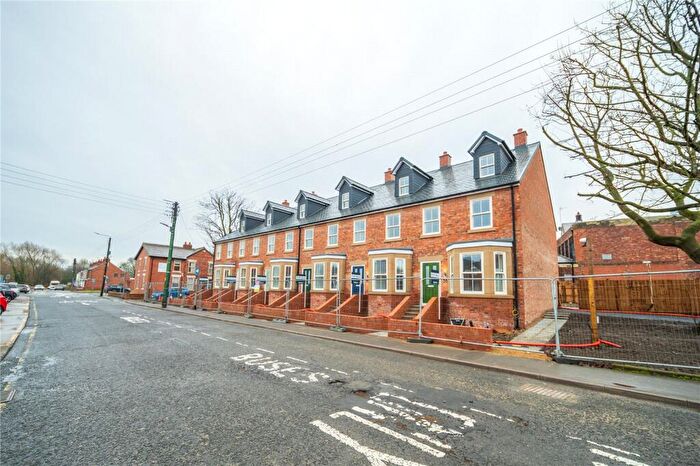
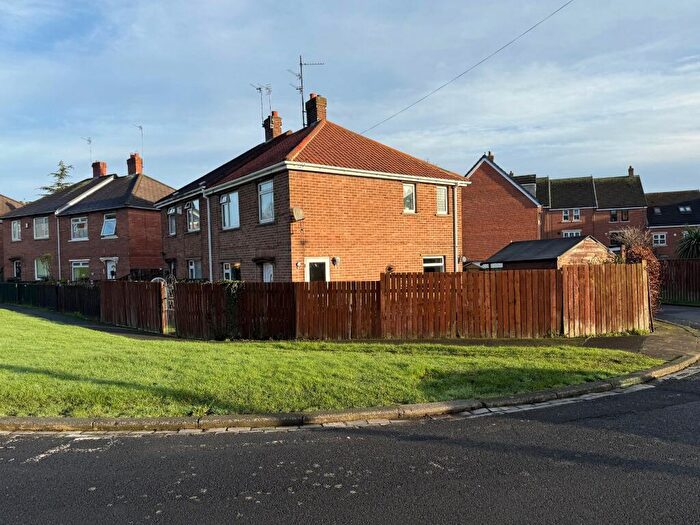
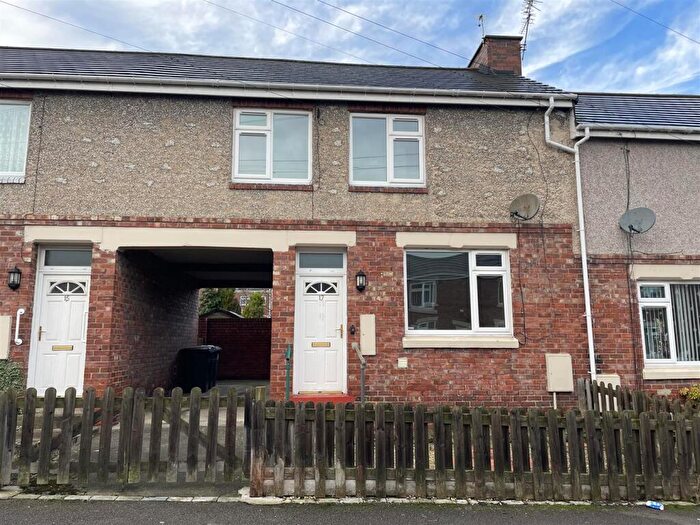
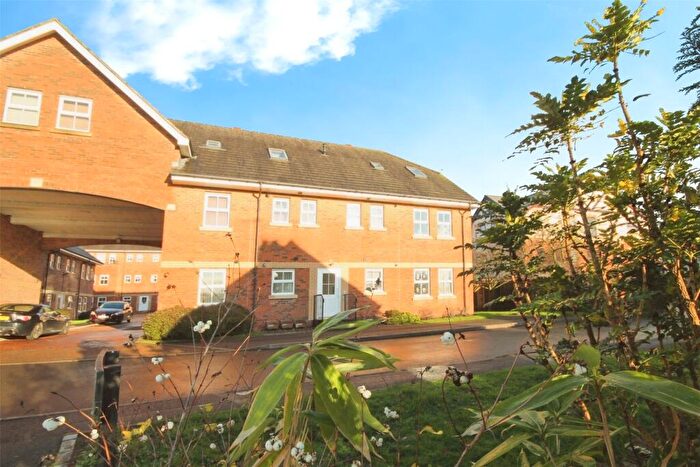
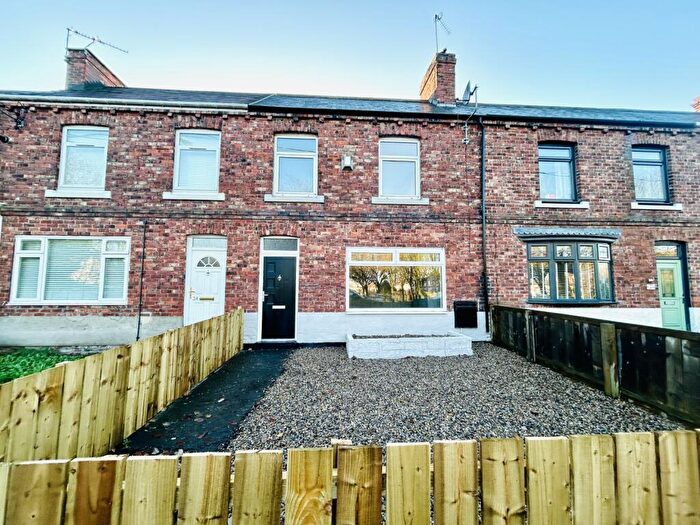
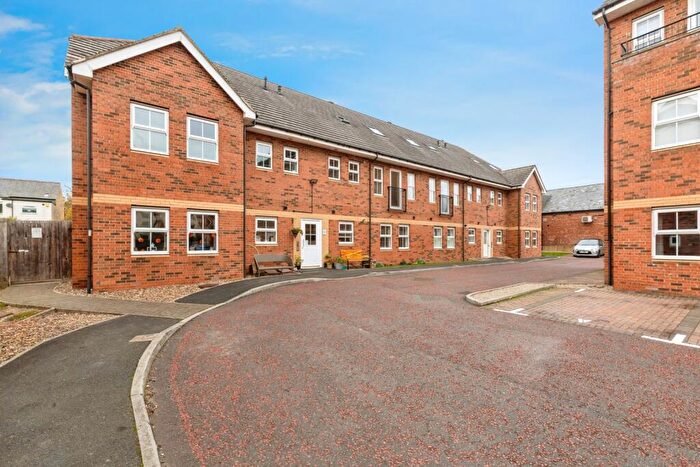
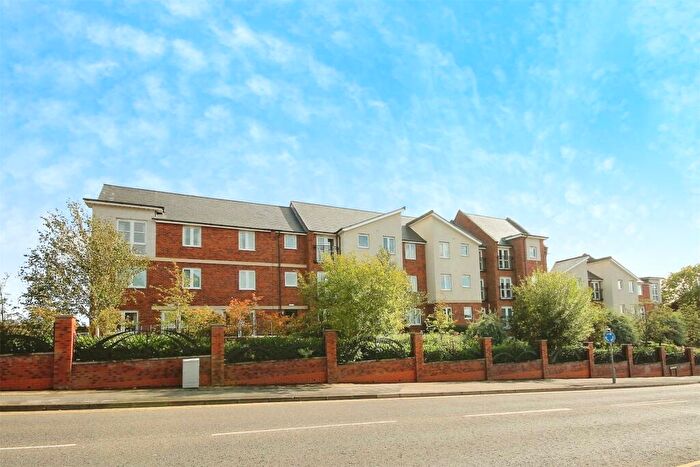
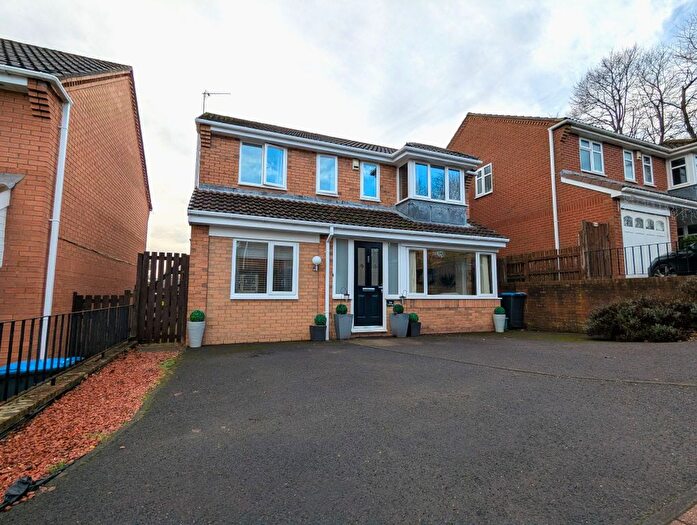
Properties in Chester-le-street North have an average house price of £156,796.00 and had 196 Property Transactions within the last 3 years¹.
Chester-le-street North is an area in Chester Le Street, County Durham with 1,824 households², where the most expensive property was sold for £625,000.00.
Properties for sale in Chester-le-street North
Roads and Postcodes in Chester-le-street North
Navigate through our locations to find the location of your next house in Chester-le-street North, Chester Le Street for sale or to rent.
| Streets | Postcodes |
|---|---|
| Aged Miners Homes | DH2 2EX |
| Arcadia Avenue | DH3 3UH |
| Ashleigh | DH2 2LJ |
| Beechwoods | DH2 2HR |
| Briarhill | DH2 2LL |
| Castle View | DH3 3XA |
| Cedars | DH2 2HT |
| Chalmers View | DH3 3TE |
| Cherrytree Road | DH2 2LP |
| Conyers Avenue | DH2 2HH DH2 2HQ |
| Conyers Gardens | DH2 2HW |
| Conyers Place | DH2 2HN |
| Conyers Road | DH2 2HD DH2 2HE |
| Elmway | DH2 2LD DH2 2LE DH2 2LF DH2 2LG DH2 2LQ DH2 2LX |
| Glen Barr | DH2 2JN |
| Glen Terrace | DH2 2AF |
| Glenavon Avenue | DH2 2JD DH2 2JL |
| Glencoe Avenue | DH2 2JJ |
| Glenmore Avenue | DH2 2JQ |
| Glenroy Gardens | DH2 2JH |
| Hazelgrove | DH2 2LN |
| Highfield Rise | DH3 3UX DH3 3UY |
| Hilda Park | DH2 2JP DH2 2JR DH2 2JS DH2 2JU DH2 2JX DH2 2JY DH2 2JT |
| Hilda Terrace | DH2 2JE |
| Hillside | DH3 3TU |
| Hollycrest | DH2 2LS |
| Laurel Court | DH2 2LY |
| Lilac Grove | DH2 2LR |
| Lucy Street | DH3 3UP |
| Maplewood | DH2 2LB |
| Myrtles | DH2 2HP |
| Newcastle Road | DH3 3TS DH3 3TX DH3 3UB DH3 3UE |
| Northlands | DH3 3UN DH3 3UW |
| Oaklea | DH2 2LA |
| Park View | DH2 2JW |
| Pelaw Avenue | DH2 2HJ |
| Pelaw Bank | DH3 3TJ DH3 3TL |
| Pelaw Crescent | DH2 2HU DH2 2HX |
| Pelaw Place | DH2 2HL |
| Pelaw Road | DH2 2HF DH2 2HG |
| Pelaw Square | DH2 2HA DH2 2HB |
| Pelton Fell Road | DH2 2AG |
| Pelton Lane | DH2 2LU |
| Prospect Street | DH3 3TQ |
| Prospect Terrace | DH3 3TN |
| Rosewood Gardens | DH2 2LT |
| South Street | DH2 2JG |
| Springfield Gardens | DH3 3UQ |
| Sycamores | DH2 2LW |
| The Close | DH2 2EZ |
| The Close East | DH2 2EY |
| The Manse | DH3 3TG |
| The Stellas | DH2 2JZ |
| Viador | DH3 3TP DH3 3TW |
| Willowvale | DH2 2LH |
| Woodlands | DH3 3TR |
| DH2 1BL DH2 2FL DH2 2HS DH3 3TF |
Transport near Chester-le-street North
-
Chester-Le-Street Station
-
Durham Station
-
Heworth Station
-
Dunston Station
-
MetroCentre Station
-
Newcastle Station
-
Manors Station
-
Sunderland Station
-
Blaydon Station
-
Seaham Station
- FAQ
- Price Paid By Year
- Property Type Price
Frequently asked questions about Chester-le-street North
What is the average price for a property for sale in Chester-le-street North?
The average price for a property for sale in Chester-le-street North is £156,796. This amount is 4% lower than the average price in Chester Le Street. There are 645 property listings for sale in Chester-le-street North.
What streets have the most expensive properties for sale in Chester-le-street North?
The streets with the most expensive properties for sale in Chester-le-street North are Castle View at an average of £539,000, Pelton Fell Road at an average of £395,000 and Springfield Gardens at an average of £326,666.
What streets have the most affordable properties for sale in Chester-le-street North?
The streets with the most affordable properties for sale in Chester-le-street North are Pelaw Square at an average of £87,333, Hollycrest at an average of £92,000 and South Street at an average of £93,312.
Which train stations are available in or near Chester-le-street North?
Some of the train stations available in or near Chester-le-street North are Chester-Le-Street, Durham and Heworth.
Property Price Paid in Chester-le-street North by Year
The average sold property price by year was:
| Year | Average Sold Price | Price Change |
Sold Properties
|
|---|---|---|---|
| 2025 | £178,223 | 5% |
28 Properties |
| 2024 | £170,147 | 20% |
59 Properties |
| 2023 | £135,431 | -12% |
49 Properties |
| 2022 | £151,116 | 2% |
60 Properties |
| 2021 | £148,171 | -4% |
71 Properties |
| 2020 | £153,719 | 12% |
36 Properties |
| 2019 | £135,731 | -2% |
61 Properties |
| 2018 | £138,304 | 8% |
58 Properties |
| 2017 | £126,792 | 2% |
71 Properties |
| 2016 | £124,320 | -7% |
63 Properties |
| 2015 | £133,044 | 7% |
57 Properties |
| 2014 | £123,487 | -17% |
43 Properties |
| 2013 | £144,909 | 33% |
42 Properties |
| 2012 | £96,890 | -13% |
50 Properties |
| 2011 | £109,426 | -8% |
28 Properties |
| 2010 | £118,412 | -13% |
41 Properties |
| 2009 | £133,629 | -8% |
34 Properties |
| 2008 | £144,764 | 5% |
42 Properties |
| 2007 | £137,690 | -20% |
82 Properties |
| 2006 | £165,805 | 6% |
111 Properties |
| 2005 | £156,356 | 29% |
86 Properties |
| 2004 | £111,404 | 15% |
50 Properties |
| 2003 | £94,521 | 33% |
92 Properties |
| 2002 | £63,345 | 15% |
87 Properties |
| 2001 | £53,805 | -3% |
73 Properties |
| 2000 | £55,594 | -18% |
85 Properties |
| 1999 | £65,515 | 16% |
77 Properties |
| 1998 | £54,951 | 8% |
76 Properties |
| 1997 | £50,323 | 10% |
60 Properties |
| 1996 | £45,475 | -3% |
52 Properties |
| 1995 | £46,631 | - |
44 Properties |
Property Price per Property Type in Chester-le-street North
Here you can find historic sold price data in order to help with your property search.
The average Property Paid Price for specific property types in the last three years are:
| Property Type | Average Sold Price | Sold Properties |
|---|---|---|
| Semi Detached House | £156,990.00 | 109 Semi Detached Houses |
| Detached House | £308,195.00 | 23 Detached Houses |
| Terraced House | £107,968.00 | 41 Terraced Houses |
| Flat | £91,519.00 | 23 Flats |

