
Houses for sale & to rent in Chester Le Street, County Durham
House Prices in Chester Le Street
Properties in Chester Le Street have an average house price of £162k and had 1,957 Property Transactions within the last 3 years.¹
Chester Le Street is an area in County Durham with 19,280 households², where the most expensive property was sold for £1.38M.
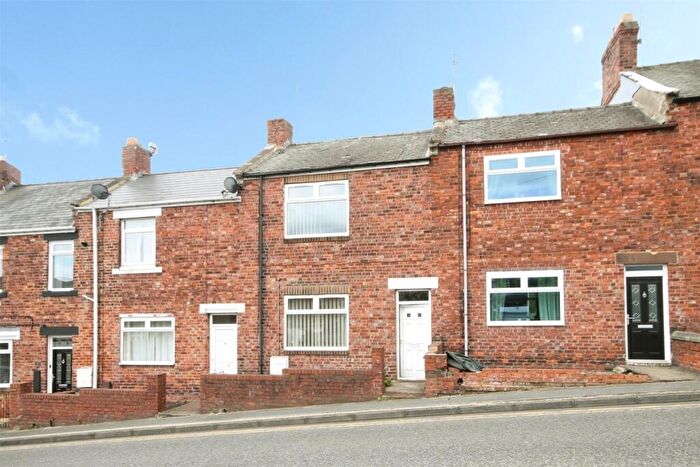
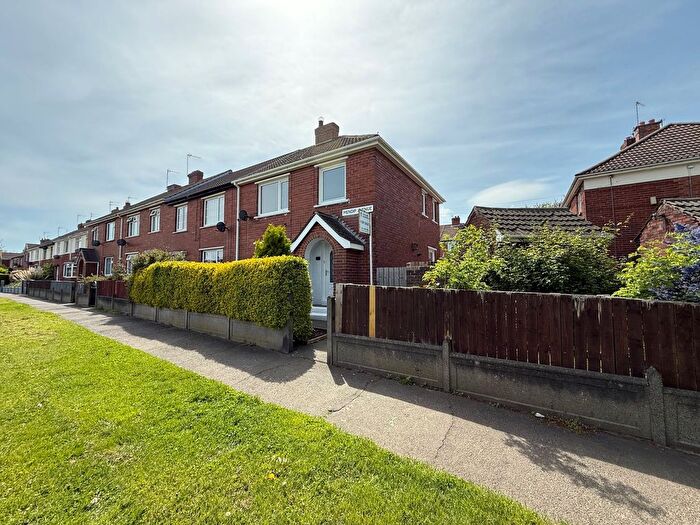
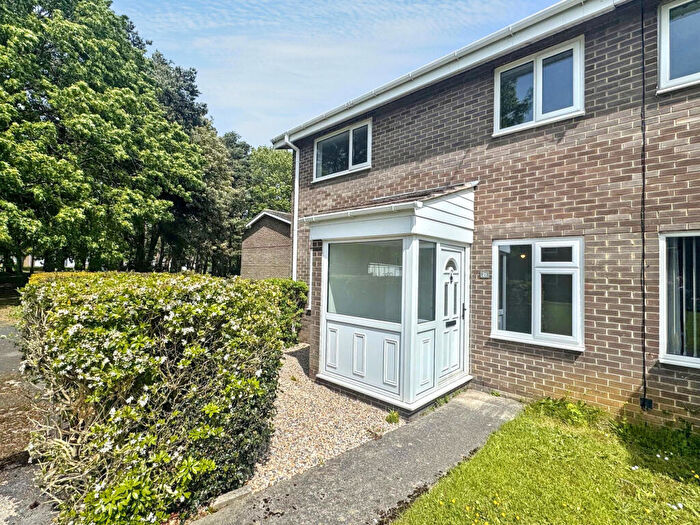
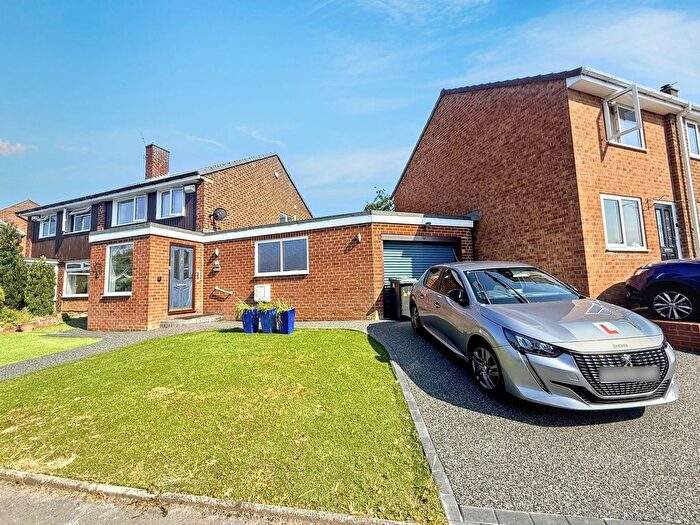
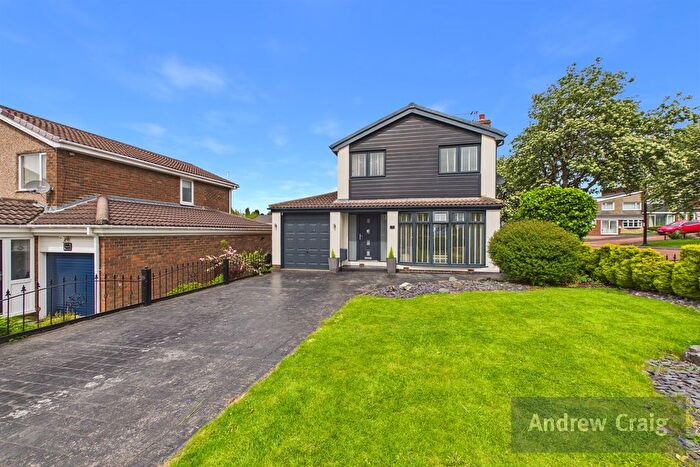
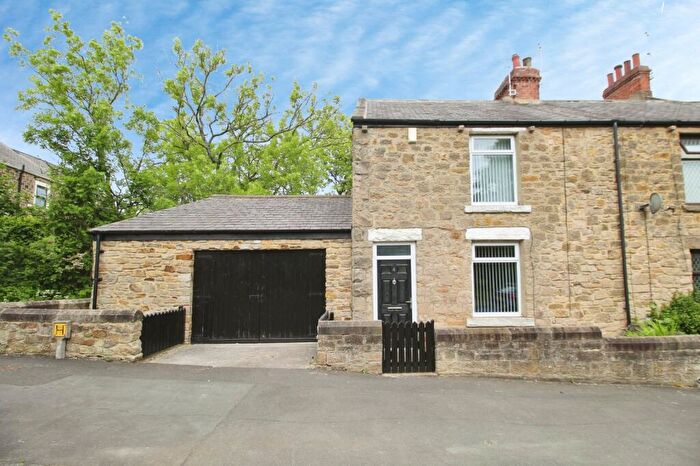
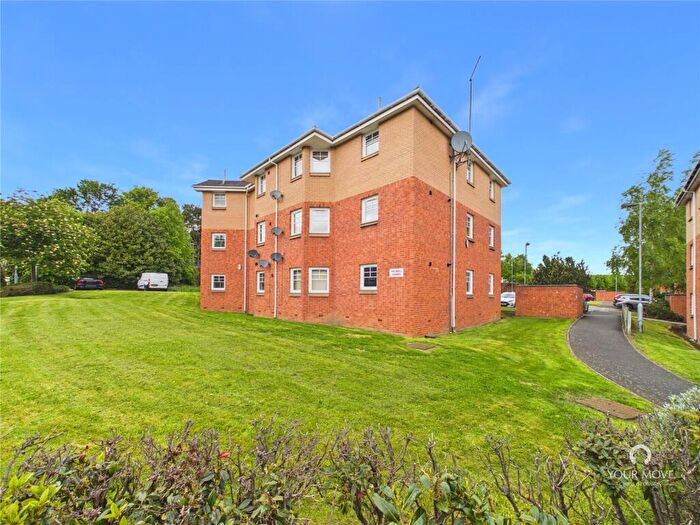
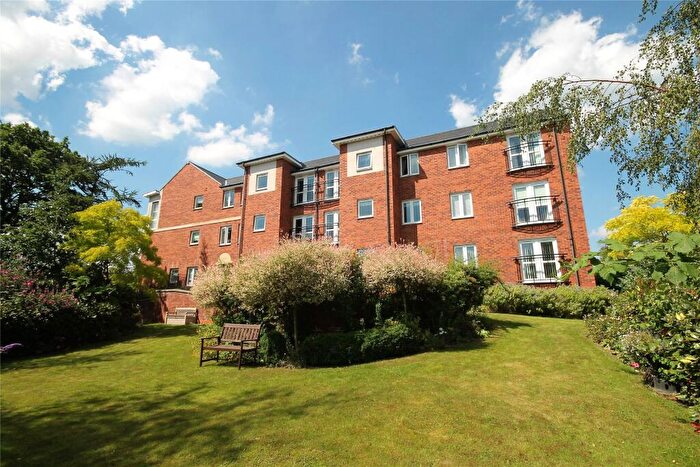
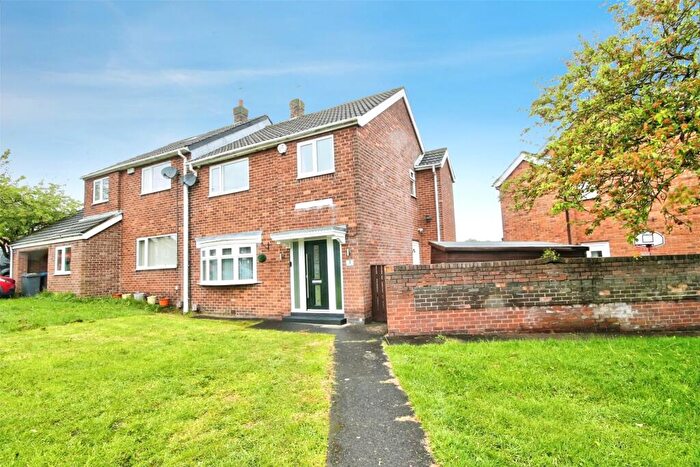
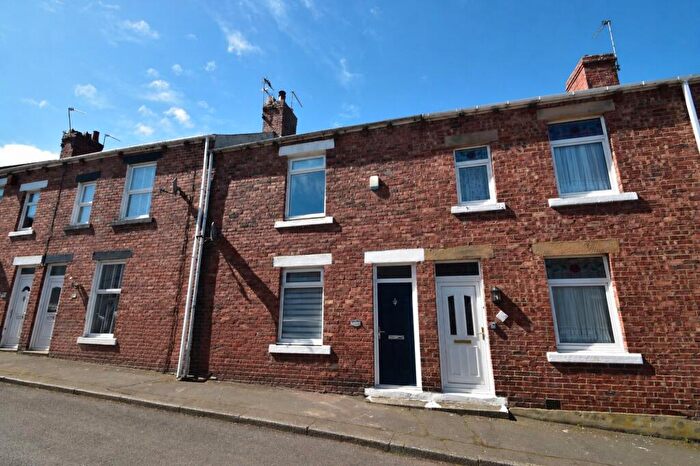
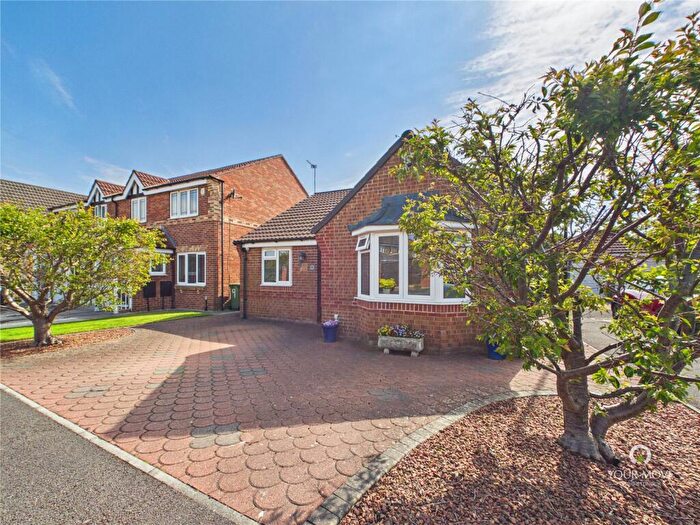
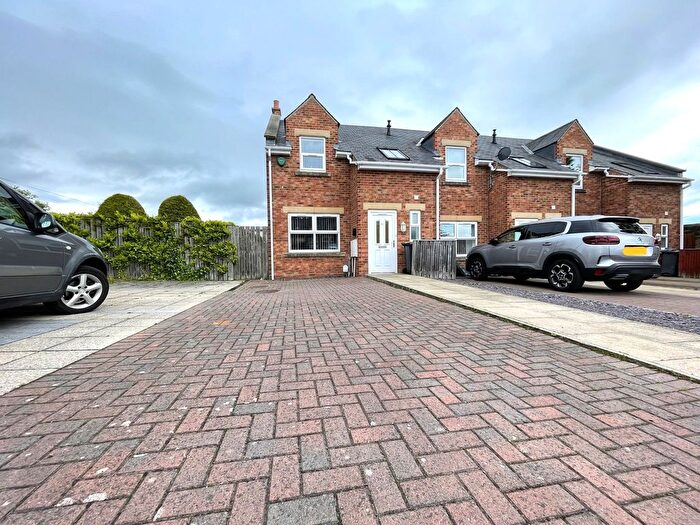
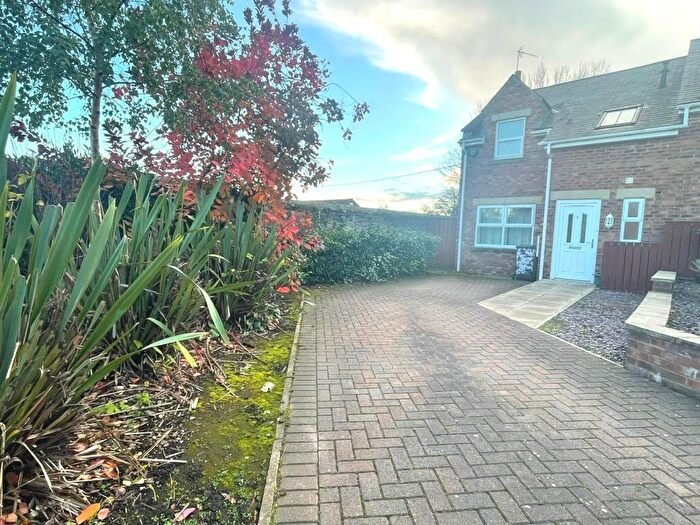
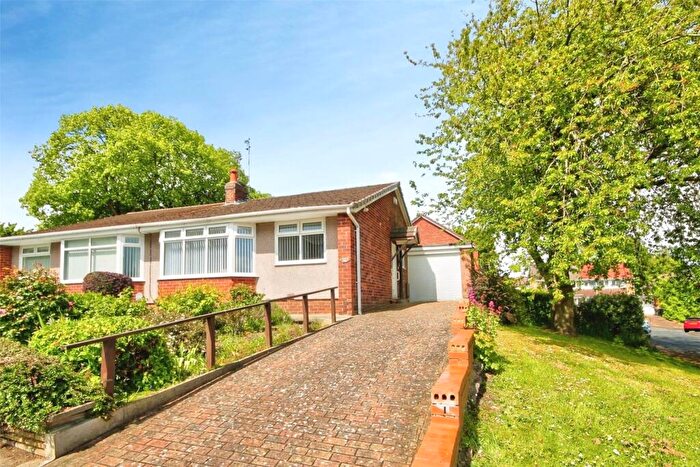
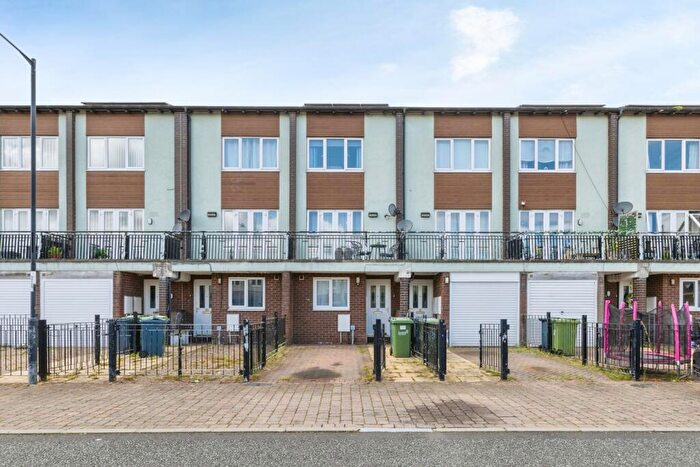
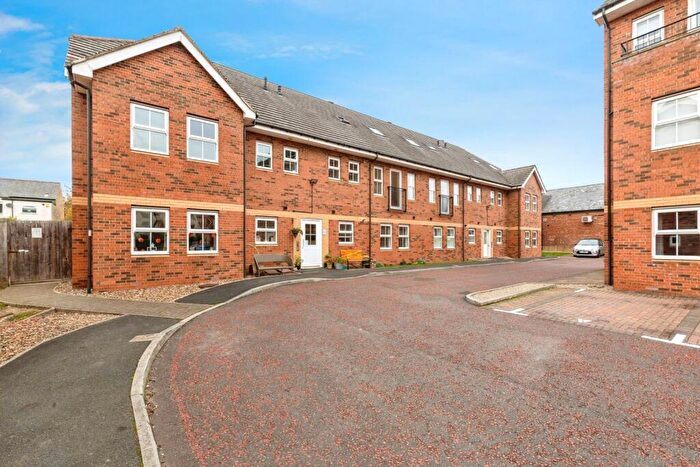
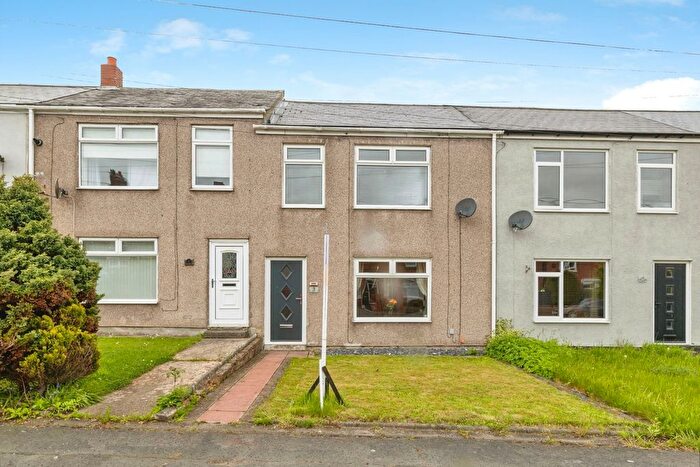
Properties for sale in Chester Le Street
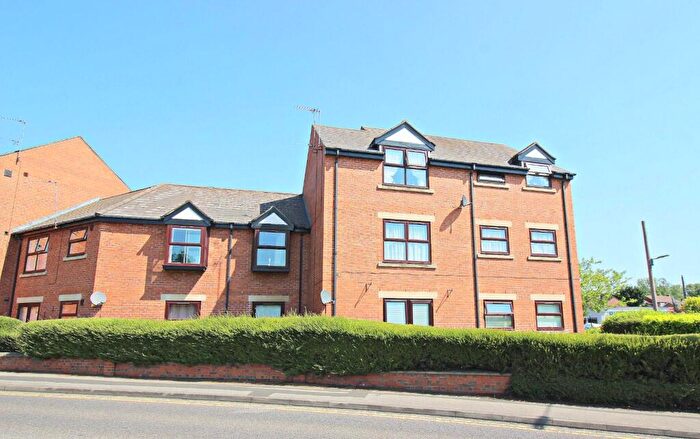
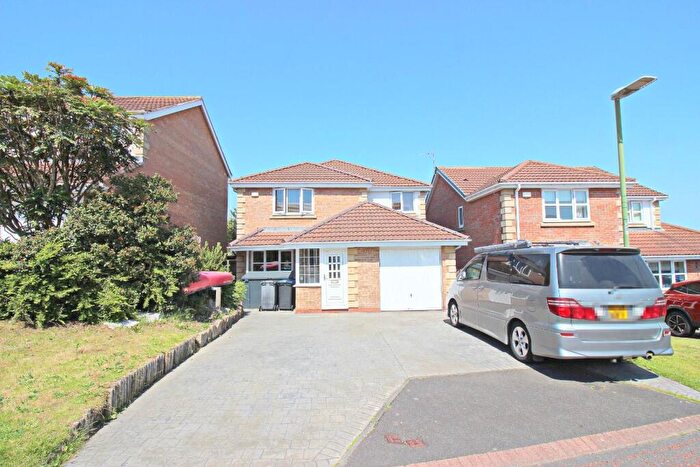
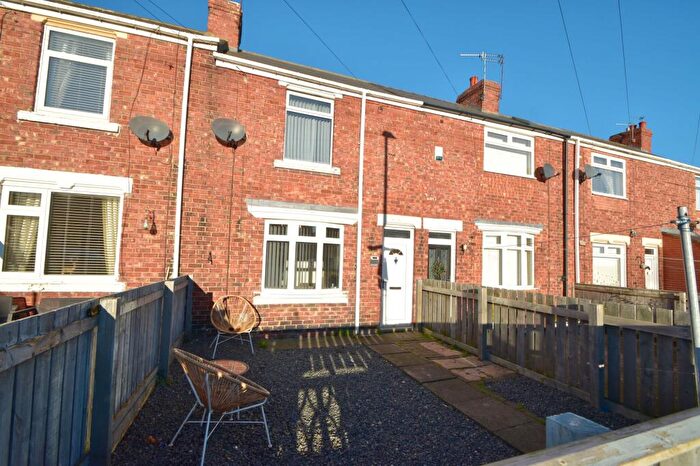
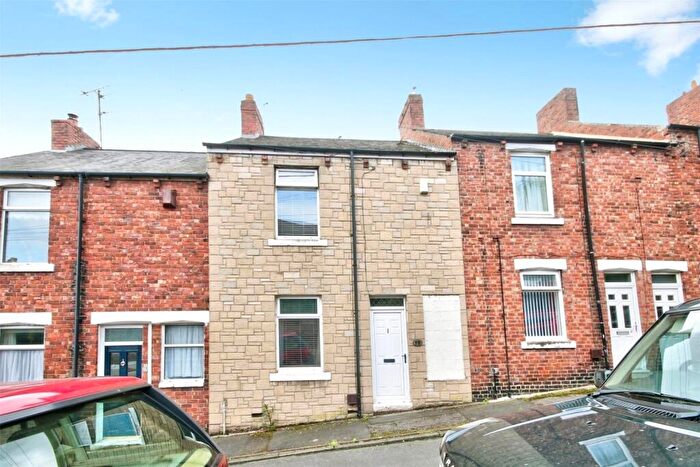
![]()
If you are looking to sell your house, let it out, or receive a property valuation, an expert can help you.
Click the button below to get started.
Neighbourhoods in Chester Le Street
Navigate through our locations to find the location of your next house in Chester Le Street, County Durham for sale or to rent.
Transport in Chester Le Street
Please see below transportation links in this area:
-
 Chester-Le-Street Station
 -
Durham Station
-
Heworth Station
-
Dunston Station
-
MetroCentre Station
-
Newcastle Station
-
Manors Station
-
Sunderland Station
-
Blaydon Station
-
Seaham Station
- FAQ
- Price Paid By Year
- Property Type Price
Frequently asked questions about Chester Le Street
What is the average price for a property for sale in Chester Le Street?
The average price for a property for sale in Chester Le Street is £162,146. This amount is 15% higher than the average price in County Durham. There are 9,654 property listings for sale in Chester Le Street.
What locations have the most expensive properties for sale in Chester Le Street?
The locations with the most expensive properties for sale in Chester Le Street are North Lodge at an average of £259,705, Chester-le-street South at an average of £203,155 and Lumley at an average of £197,660.
What locations have the most affordable properties for sale in Chester Le Street?
The locations with the most affordable properties for sale in Chester Le Street are Pelton at an average of £125,236, Chester-le-street West Central at an average of £133,380 and Chester-le-street East at an average of £149,753.
Which train stations are available in or near Chester Le Street?
Some of the train stations available in or near Chester Le Street are Chester-Le-Street, Durham and Heworth.
Property Price Paid in Chester Le Street by Year
The average sold property price by year was:
| Year | Average Sold Price | Price Change |
Sold Properties
|
|---|---|---|---|
| 2026 | £171,367 | -1% |
47 Properties |
| 2025 | £173,182 | 6% |
610 Properties |
| 2024 | £162,366 | 7% |
681 Properties |
| 2023 | £150,327 | -11% |
619 Properties |
| 2022 | £166,365 | 2% |
791 Properties |
| 2021 | £162,927 | -0,1% |
886 Properties |
| 2020 | £163,091 | 9% |
682 Properties |
| 2019 | £148,425 | -2% |
818 Properties |
| 2018 | £151,426 | 4% |
747 Properties |
| 2017 | £144,647 | 6% |
736 Properties |
| 2016 | £136,660 | 2% |
659 Properties |
| 2015 | £133,307 | -2% |
708 Properties |
| 2014 | £135,802 | 1% |
622 Properties |
| 2013 | £133,847 | 2% |
550 Properties |
| 2012 | £130,909 | -3% |
399 Properties |
| 2011 | £135,379 | -7% |
445 Properties |
| 2010 | £144,958 | 7% |
451 Properties |
| 2009 | £135,093 | -8% |
433 Properties |
| 2008 | £145,635 | 3% |
485 Properties |
| 2007 | £141,654 | -2% |
1,091 Properties |
| 2006 | £143,866 | 6% |
1,051 Properties |
| 2005 | £135,333 | 11% |
911 Properties |
| 2004 | £121,036 | 21% |
930 Properties |
| 2003 | £95,064 | 20% |
1,074 Properties |
| 2002 | £76,317 | 10% |
1,039 Properties |
| 2001 | £68,380 | 2% |
1,061 Properties |
| 2000 | £67,311 | 9% |
888 Properties |
| 1999 | £61,117 | 7% |
867 Properties |
| 1998 | £57,088 | -5% |
867 Properties |
| 1997 | £60,168 | 2% |
1,006 Properties |
| 1996 | £58,952 | -3% |
896 Properties |
| 1995 | £60,623 | - |
942 Properties |
Property Price per Property Type in Chester Le Street
Here you can find historic sold price data in order to help with your property search.
The average Property Paid Price for specific property types in the last three years are:
| Property Type | Average Sold Price | Sold Properties |
|---|---|---|
| Semi Detached House | £174,329.00 | 652 Semi Detached Houses |
| Detached House | £305,808.00 | 327 Detached Houses |
| Terraced House | £108,823.00 | 789 Terraced Houses |
| Flat | £94,164.00 | 189 Flats |