
Houses for sale in Consett, County Durham
House Prices in Consett
Properties in Consett have an average house price of £155k and had 1,963 Property Transactions within the last 3 years.¹
Consett is an area in County Durham with 17,777 households², where the most expensive property was sold for £1.1M.
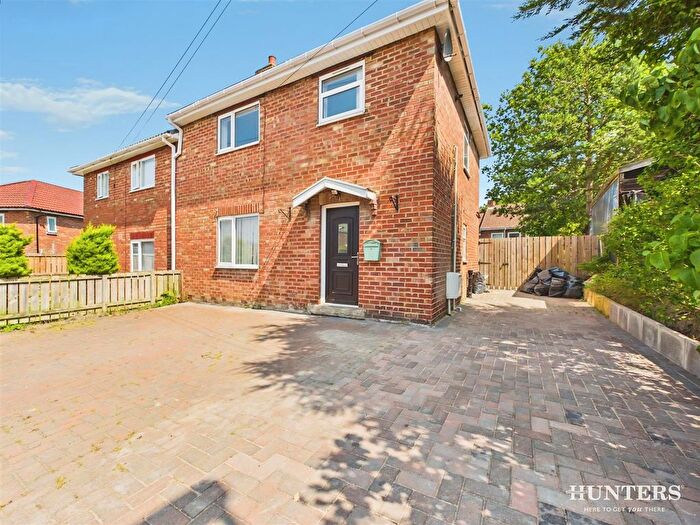
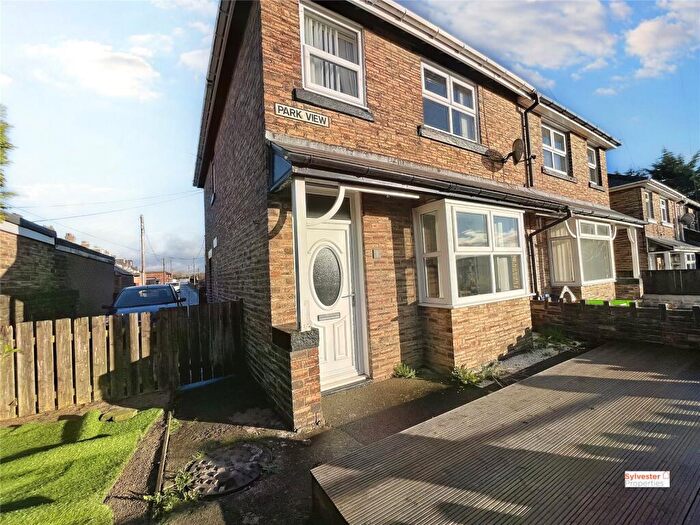
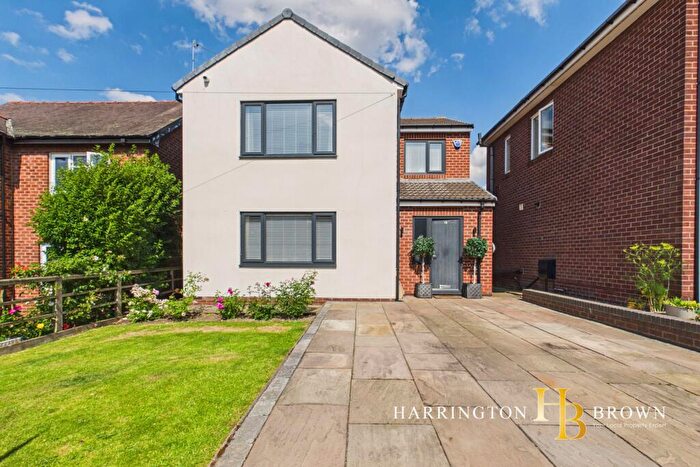
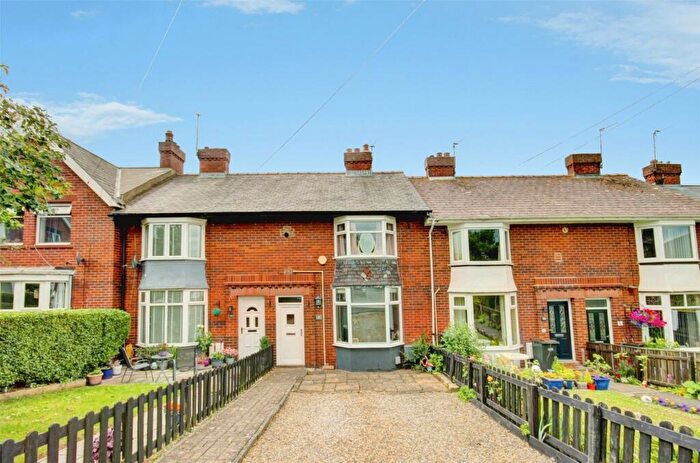
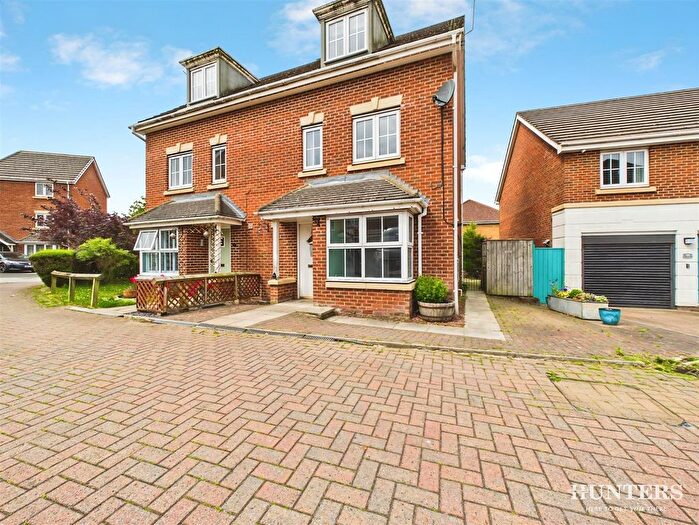
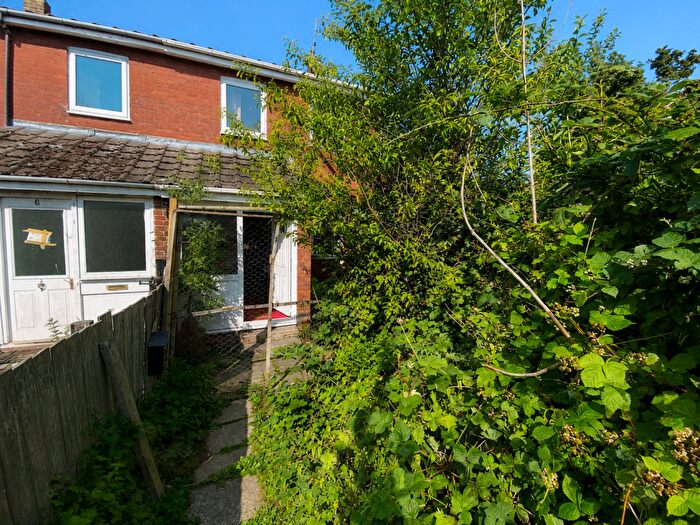
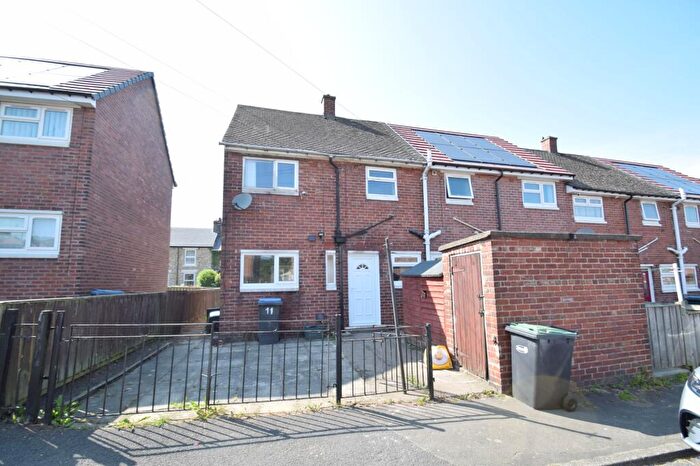
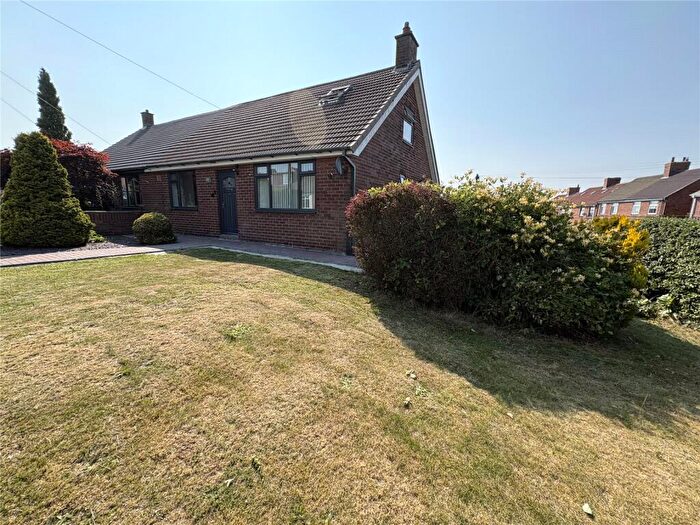
Properties for sale in Consett
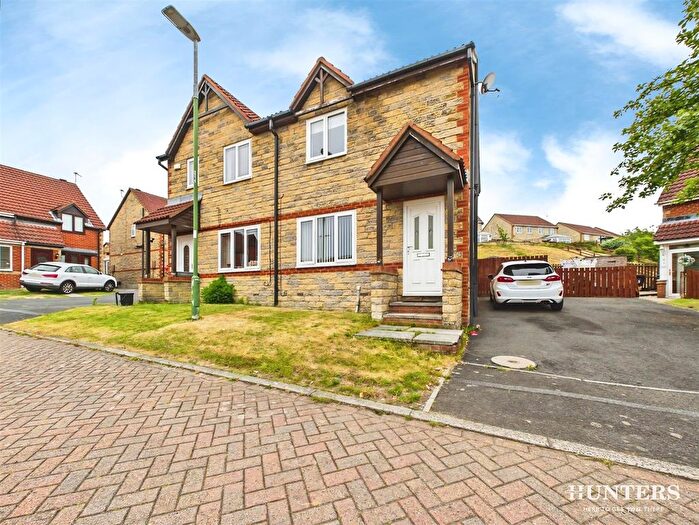
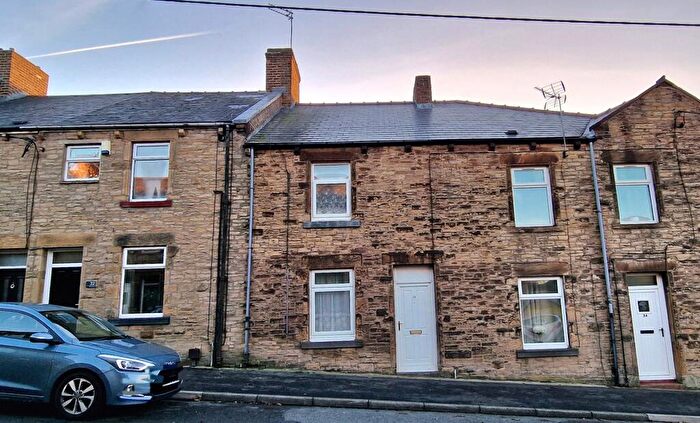

![]()
If you are looking to sell your house, let it out, or receive a property valuation, an expert can help you.
Click the button below to get started.

Neighbourhoods in Consett
Navigate through our locations to find the location of your next house in Consett, County Durham for sale or to rent.
Property price trends in Consett
According to the latest Land Registry data, the average home in Consett sold for £172,150 in 2026. That figure comes from a substantial record of 21,562 sales logged over the past 31 years.
Prices have continued to climb over the last three years. Compared with 2023, when the typical sale came in around £148,948, that's a rise of roughly 15.6%.
Looking back five years, average prices are up about 16.4% since 2021, a gain of around £24,254 in cash terms.
Zoom out to the past decade for the fuller picture. Back in 2016, homes here averaged £122,741, so the typical sold price has climbed about 40.3% since then, roughly 3.4% a year. Stretch the view to fifteen years and that annual pace eases back to about 2.7%.
Frequently asked questions about Consett
What is the average price for a property for sale in Consett?
The average price for a property for sale in Consett is £155,031. This amount is 10% higher than the average price in County Durham. There are more than 10,000 property listings for sale in Consett.
What locations have the most expensive properties for sale in Consett?
The locations with the most expensive properties for sale in Consett are Weardale at an average of £482,538, Benfieldside at an average of £190,636 and Lanchester at an average of £185,727.
What locations have the most affordable properties for sale in Consett?
The locations with the most affordable properties for sale in Consett are Consett North at an average of £131,498, Delves Lane at an average of £136,105 and Leadgate And Medomsley at an average of £144,416.
Which train stations are available in or near Consett?
Some of the train stations available in or near Consett are Stocksfield, Prudhoe and Riding Mill.
Property Price Paid in Consett by Year
The average sold property price by year was:
| Year | Average Sold Price | Price Change |
Sold Properties
|
|---|---|---|---|
| 2026 | £172,150 | 10% |
56 Properties |
| 2025 | £154,839 | -3% |
647 Properties |
| 2024 | £159,157 | 6% |
669 Properties |
| 2023 | £148,948 | 3% |
591 Properties |
| 2022 | £143,950 | -3% |
758 Properties |
| 2021 | £147,896 | 11% |
807 Properties |
| 2020 | £131,318 | 4% |
613 Properties |
| 2019 | £125,800 | -1% |
768 Properties |
| 2018 | £126,581 | -5% |
754 Properties |
| 2017 | £132,358 | 7% |
785 Properties |
Property Price per Property Type in Consett
Here you can find historic sold price data in order to help with your property search.
The average Property Paid Price for specific property types in the last three years are:
| Property Type | Average Sold Price | Sold Properties |
|---|---|---|
| Semi Detached House | £142,772.00 | 602 Semi Detached Houses |
| Terraced House | £106,688.00 | 907 Terraced Houses |
| Detached House | £290,273.00 | 406 Detached Houses |
| Flat | £78,332.00 | 48 Flats |
Transport in Consett
Please see below transportation links in this area:
