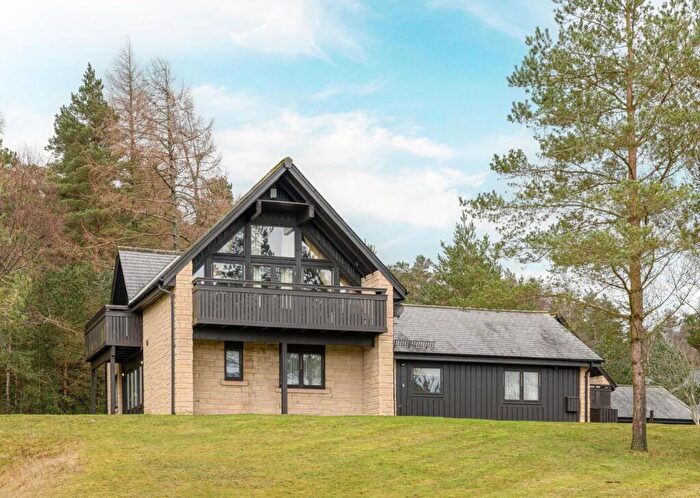
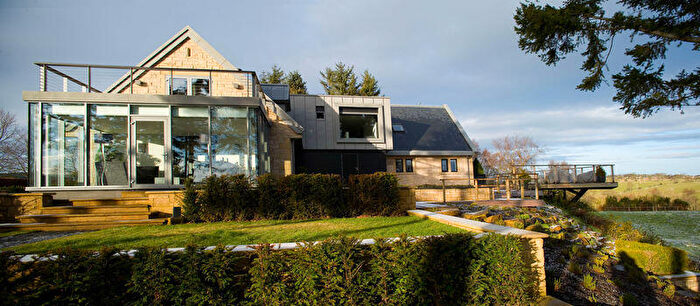
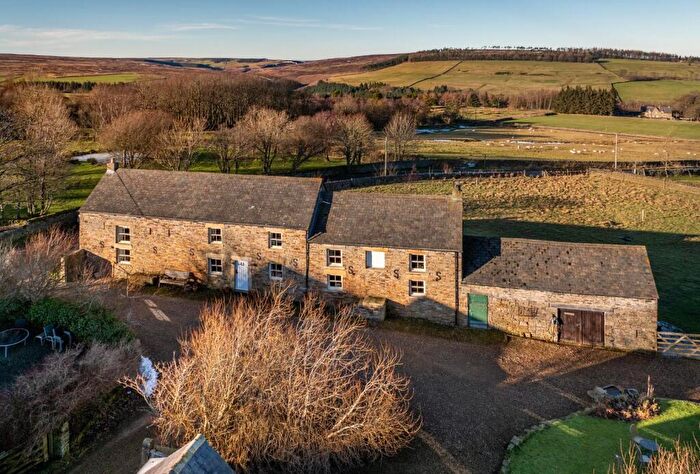
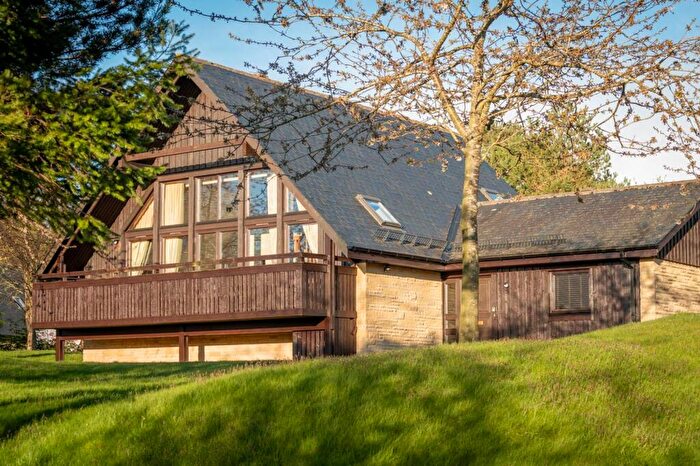
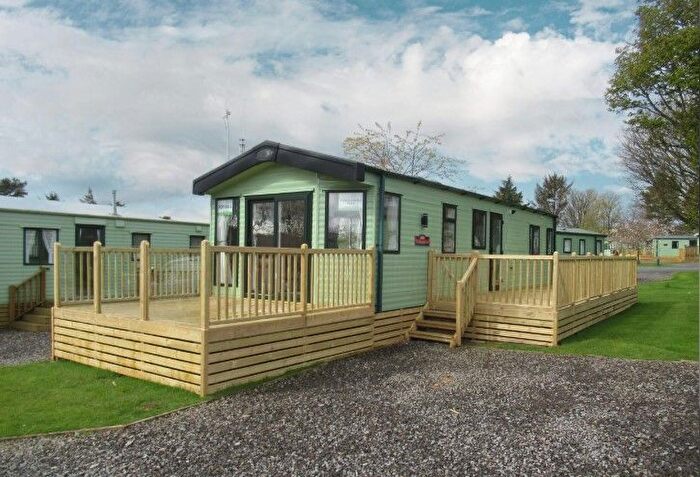
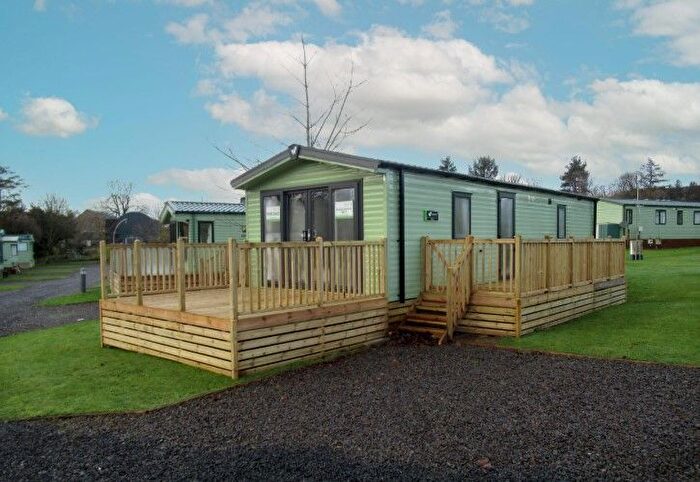
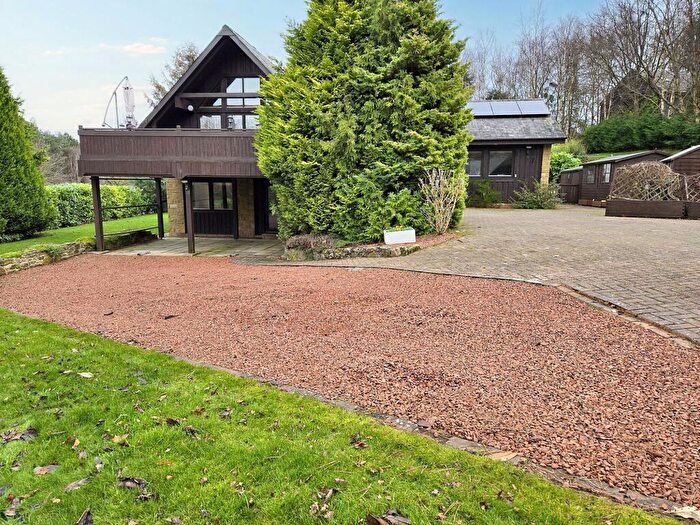
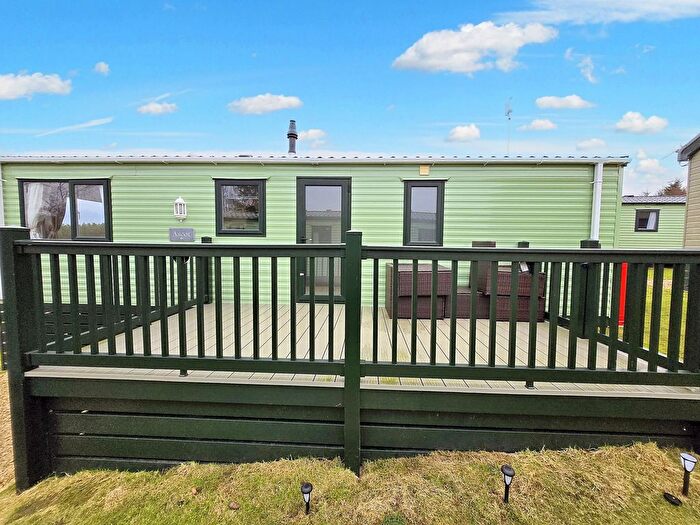
Houses for sale & to rent in Weardale, Consett
House Prices in Weardale
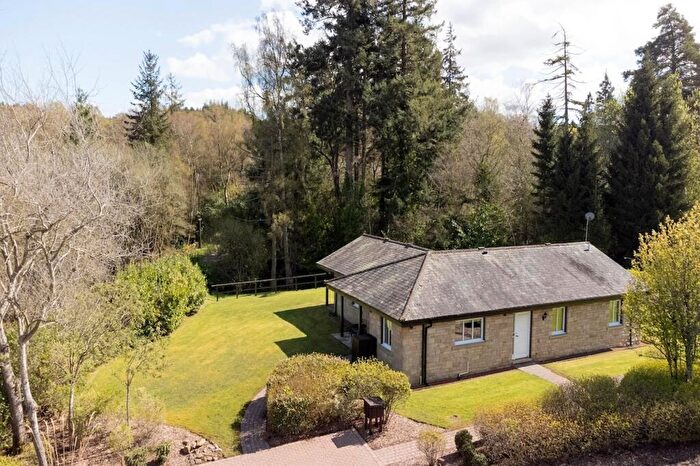
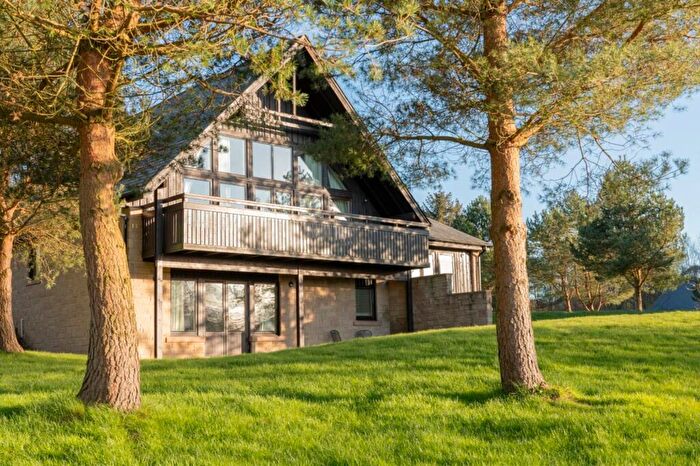
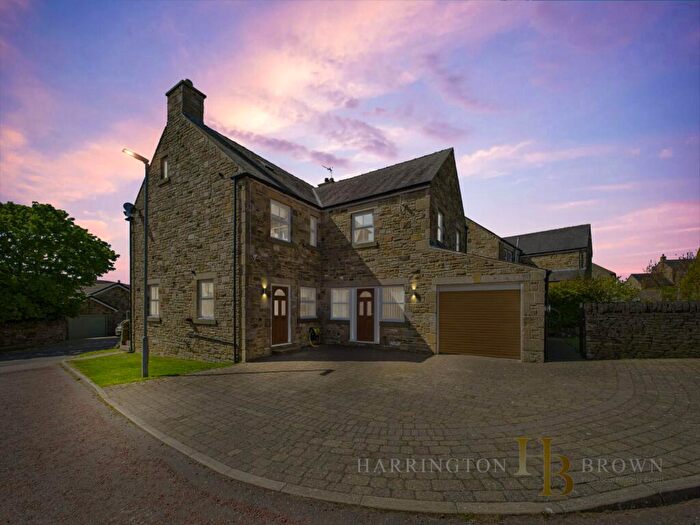
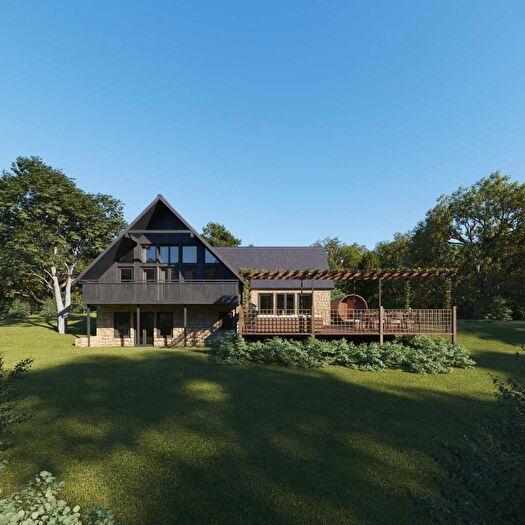
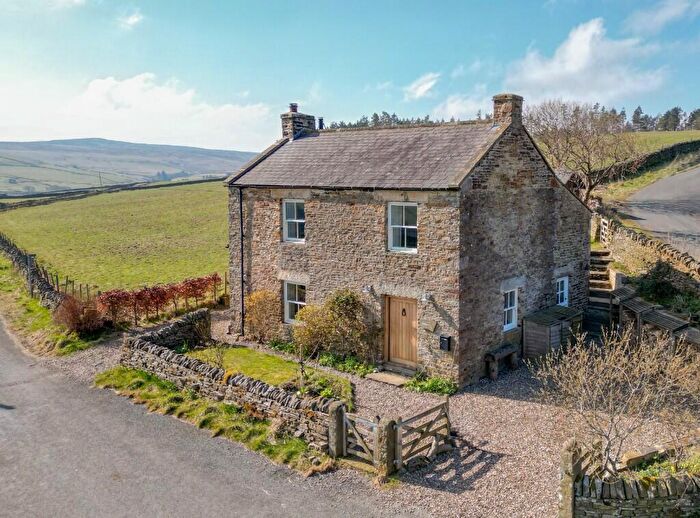
Properties in Weardale have an average house price of £446,181.00 and had 11 Property Transactions within the last 3 years¹.
Weardale is an area in Consett, County Durham with 123 households², where the most expensive property was sold for £739,000.00.
Properties for sale in Weardale
Previously listed properties in Weardale
Roads and Postcodes in Weardale
Navigate through our locations to find the location of your next house in Weardale, Consett for sale or to rent.
| Streets | Postcodes |
|---|---|
| Blanchland | DH8 9UG DH8 9UY DH8 9PL DH8 9PN DH8 9PP DH8 9PR DH8 9PZ DH8 9UH DH8 9UL DH8 9UQ DH8 9UX DH8 9XB |
| Boltsburn Terrace | DH8 9UZ |
| Church Lane | DH8 9NQ |
| Hepple Hill | DH8 9NP DH8 9NT DH8 9NS |
| Ramshaw | DH8 9UU DH8 9XA |
| Rose Cottage | DH8 9UT |
| Ruffside | DH8 9PA DH8 9PB DH8 9TY |
| Ruffside Village | DH8 9PE |
| The Closes | DH8 9NH |
| Townfield Cottages | DH8 9UP |
| DH8 9NJ DH8 9NL DH8 9NN DH8 9NU DH8 9UF DH8 9UR DH8 9UW DH8 9NR DH8 9NW DH8 9TX DH8 9UE DH8 9UN |
Transport near Weardale
- FAQ
- Price Paid By Year
- Property Type Price
Frequently asked questions about Weardale
What is the average price for a property for sale in Weardale?
The average price for a property for sale in Weardale is £446,181. This amount is 189% higher than the average price in Consett. There are 71 property listings for sale in Weardale.
What streets have the most expensive properties for sale in Weardale?
The street with the most expensive properties for sale in Weardale is The Closes at an average of £493,714.
What streets have the most affordable properties for sale in Weardale?
The street with the most affordable properties for sale in Weardale is Ramshaw at an average of £230,000.
Which train stations are available in or near Weardale?
Some of the train stations available in or near Weardale are Riding Mill, Corbridge and Stocksfield.
Property Price Paid in Weardale by Year
The average sold property price by year was:
| Year | Average Sold Price | Price Change |
Sold Properties
|
|---|---|---|---|
| 2025 | £497,500 | 24% |
4 Properties |
| 2024 | £380,000 | -14% |
2 Properties |
| 2023 | £431,600 | -51% |
5 Properties |
| 2022 | £653,333 | 68% |
6 Properties |
| 2021 | £210,000 | -33% |
2 Properties |
| 2020 | £279,000 | 25% |
3 Properties |
| 2019 | £210,000 | -137% |
1 Property |
| 2018 | £497,500 | 46% |
2 Properties |
| 2017 | £268,000 | -76% |
2 Properties |
| 2016 | £471,366 | 23% |
3 Properties |
| 2015 | £360,857 | 7% |
7 Properties |
| 2014 | £335,000 | -3% |
5 Properties |
| 2013 | £346,666 | 25% |
3 Properties |
| 2012 | £260,000 | -20% |
2 Properties |
| 2011 | £312,500 | 46% |
3 Properties |
| 2010 | £169,250 | 11% |
6 Properties |
| 2009 | £150,000 | -121% |
1 Property |
| 2008 | £331,000 | 6% |
1 Property |
| 2007 | £310,000 | 49% |
4 Properties |
| 2006 | £159,055 | -121% |
2 Properties |
| 2005 | £351,158 | 0,3% |
6 Properties |
| 2004 | £350,000 | 26% |
2 Properties |
| 2003 | £258,687 | 3% |
8 Properties |
| 2002 | £249,950 | 59% |
1 Property |
| 2001 | £101,583 | -47% |
6 Properties |
| 2000 | £149,625 | 13% |
4 Properties |
| 1999 | £130,000 | 71% |
2 Properties |
| 1998 | £37,500 | -117% |
1 Property |
| 1997 | £81,250 | 16% |
2 Properties |
| 1996 | £67,875 | -29% |
2 Properties |
| 1995 | £87,250 | - |
2 Properties |
Property Price per Property Type in Weardale
Here you can find historic sold price data in order to help with your property search.
The average Property Paid Price for specific property types in the last three years are:
| Property Type | Average Sold Price | Sold Properties |
|---|---|---|
| Semi Detached House | £246,000.00 | 2 Semi Detached Houses |
| Detached House | £490,666.00 | 9 Detached Houses |

