
Houses for sale in Bishop Middleham And Cornforth, Durham
House Prices in Bishop Middleham And Cornforth
Properties in Bishop Middleham And Cornforth have no sales history available within the last 3 years.
Bishop Middleham And Cornforth is an area in Durham, County Durham with 15 households².
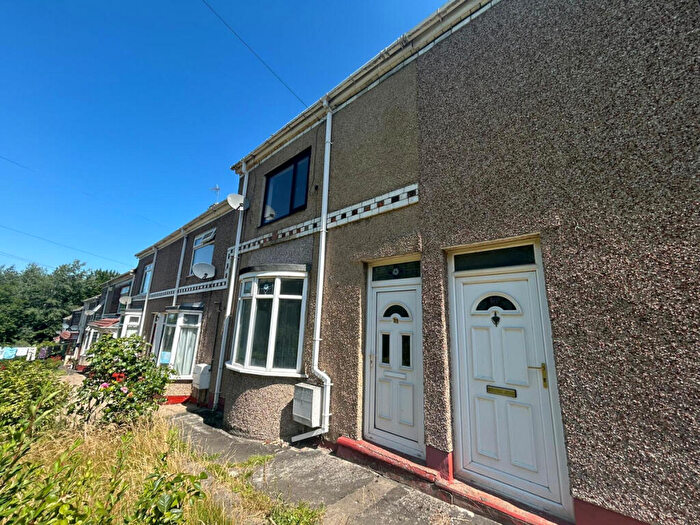
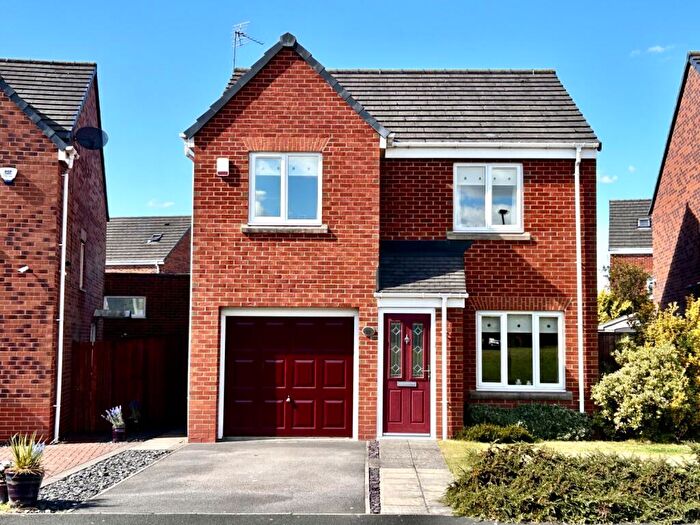
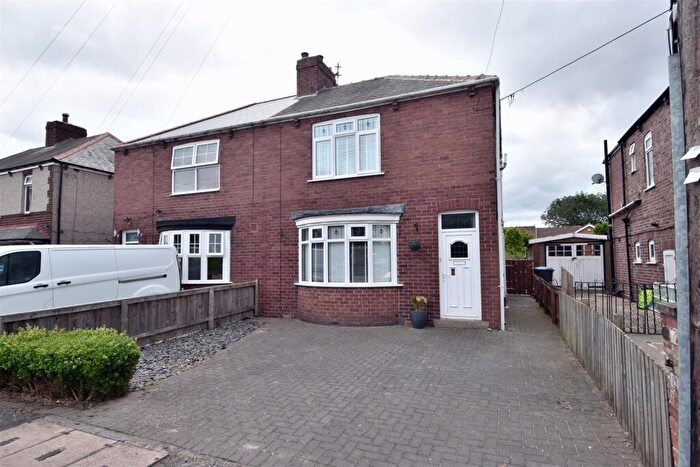
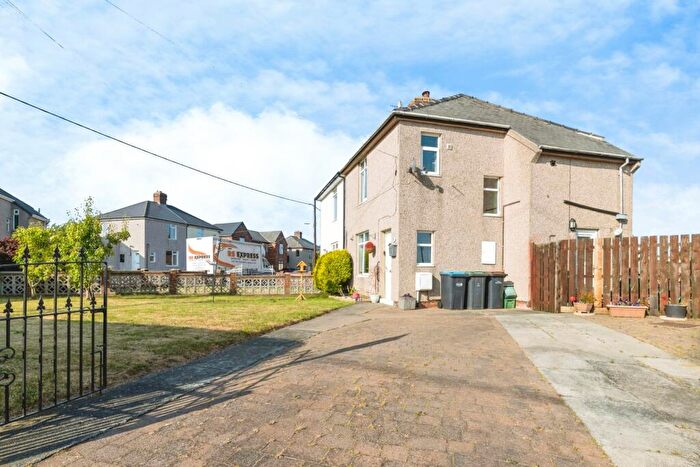
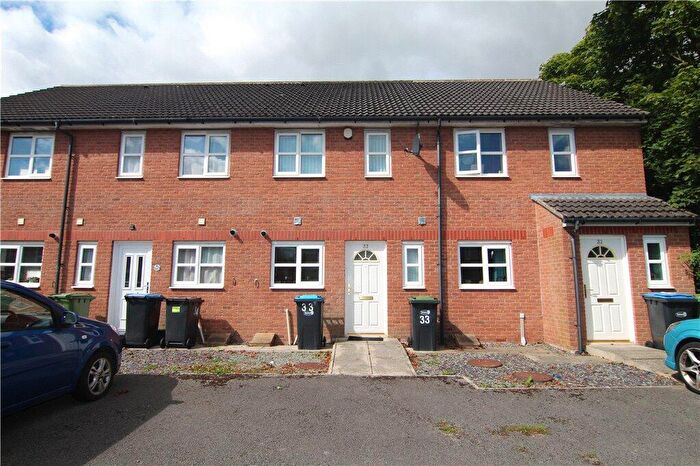
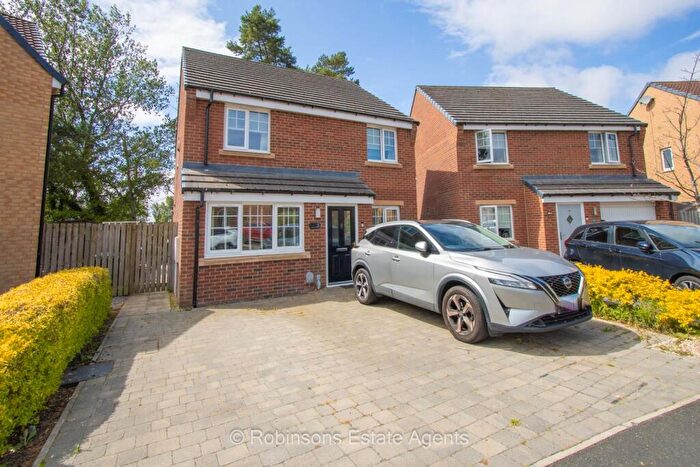
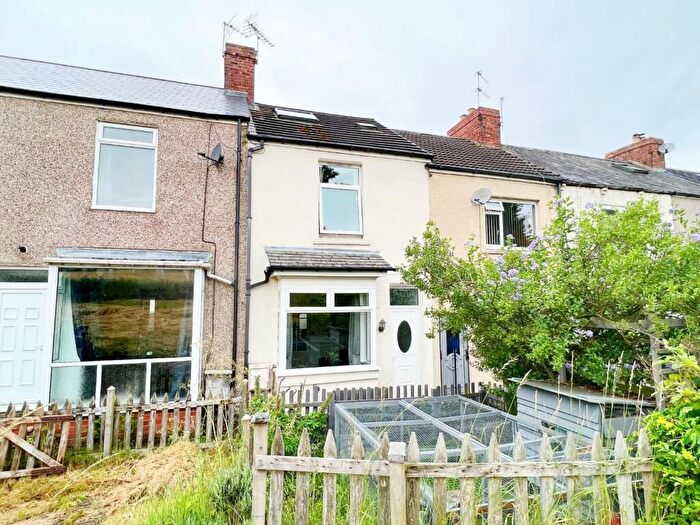
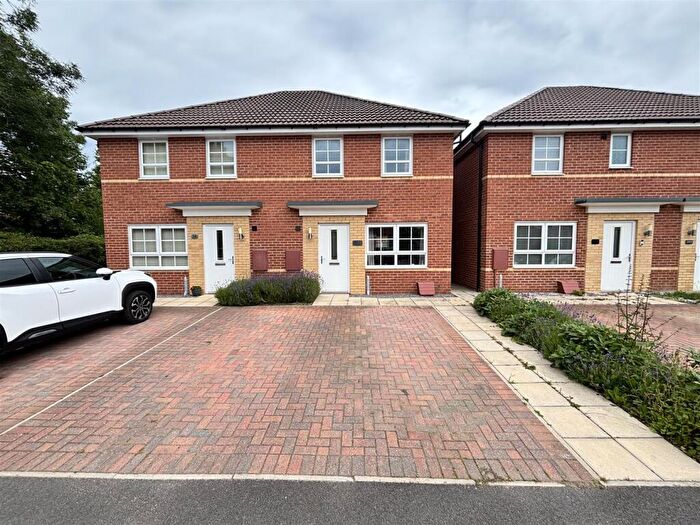
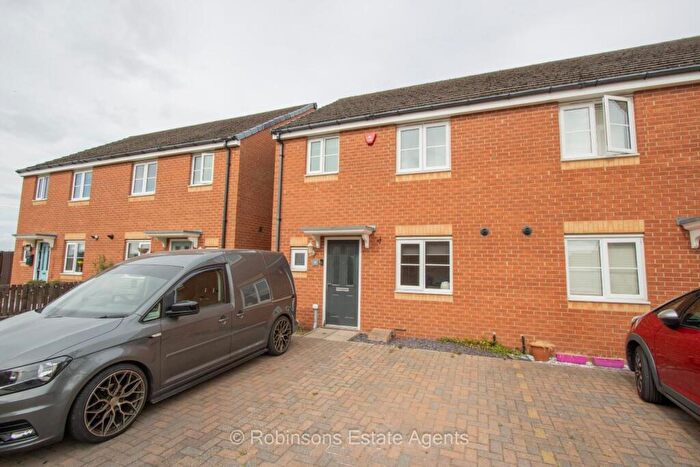
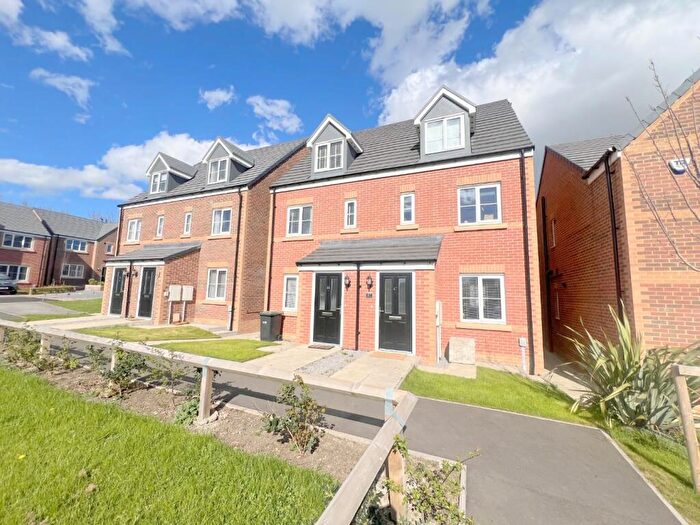
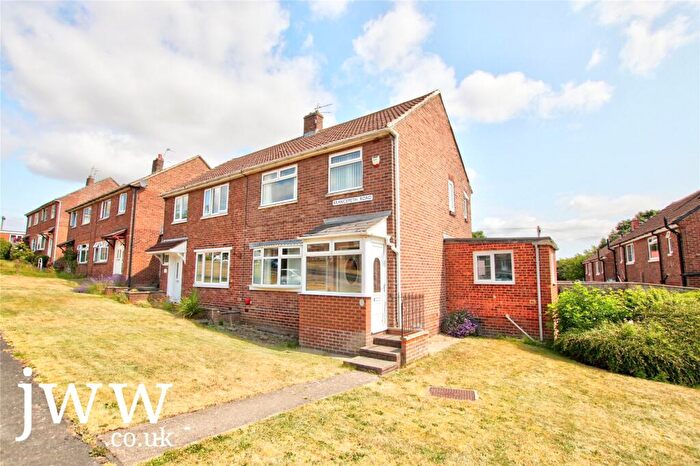
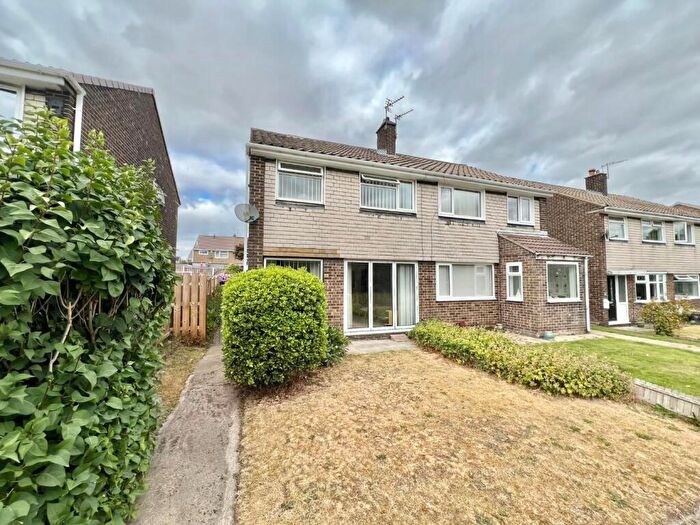
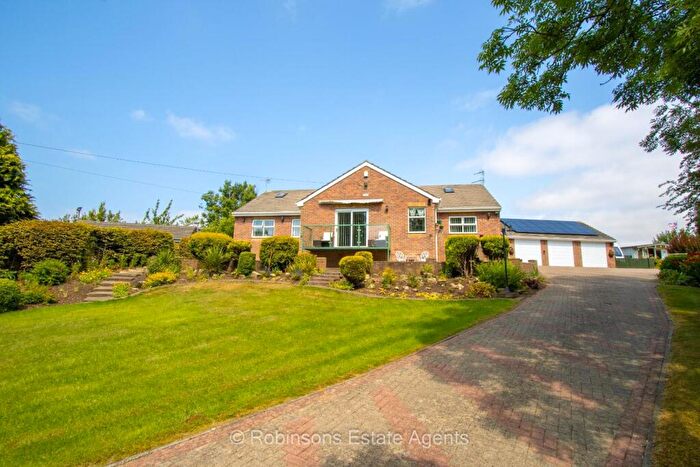
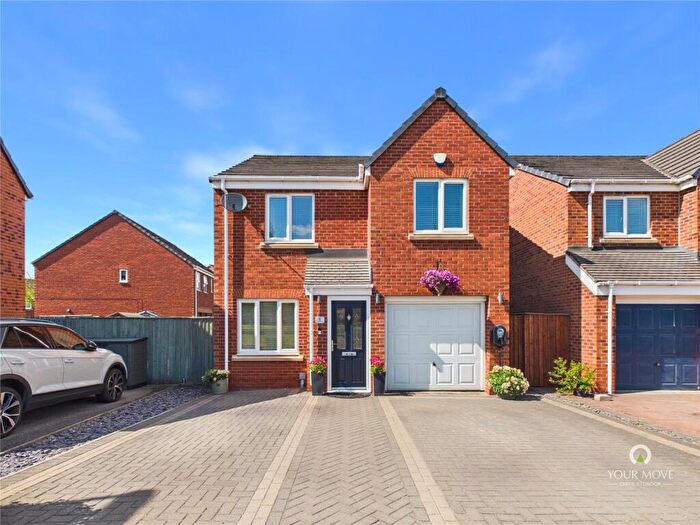
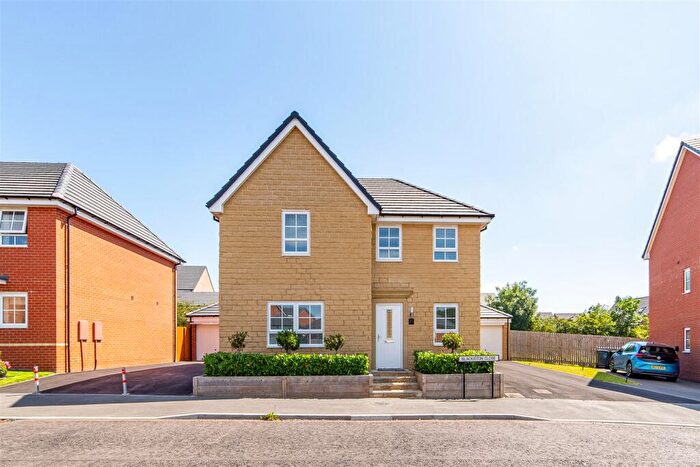
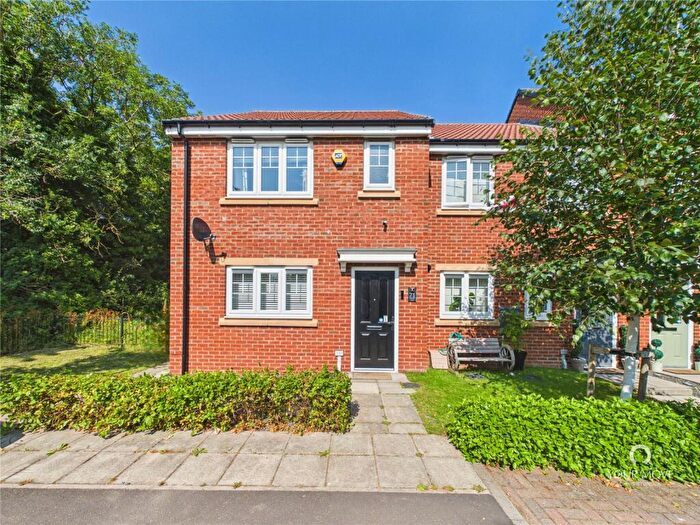
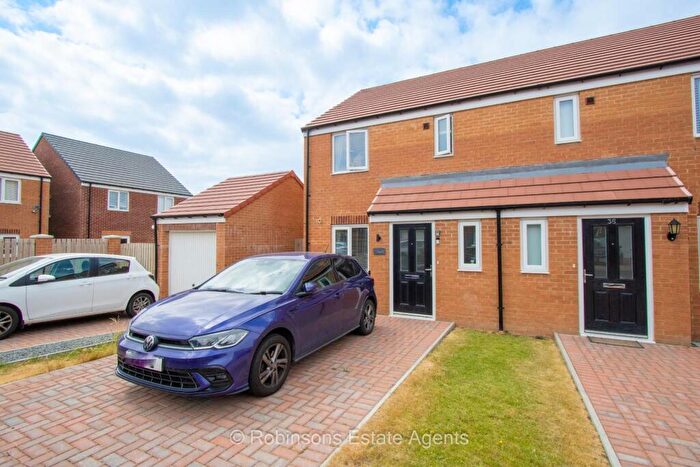
Properties for sale in Bishop Middleham And Cornforth
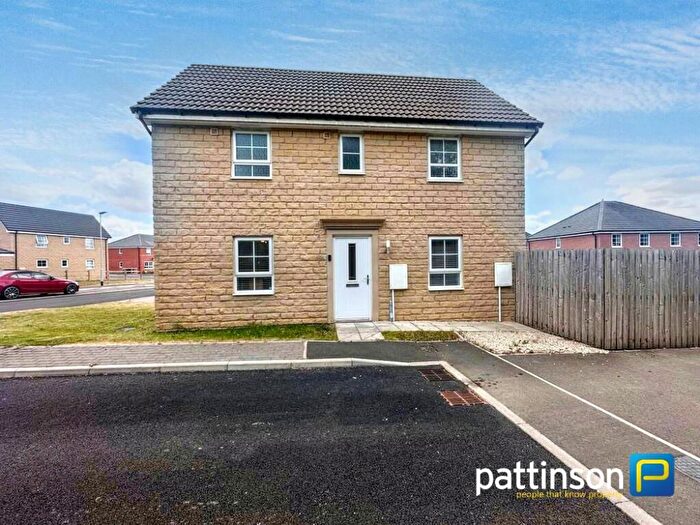
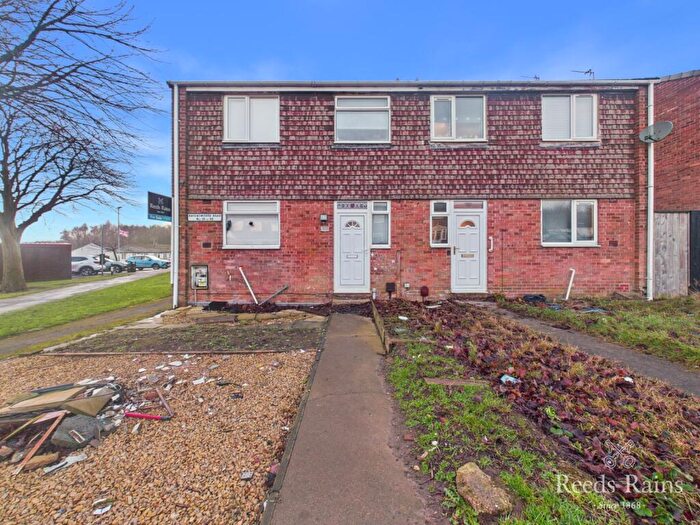
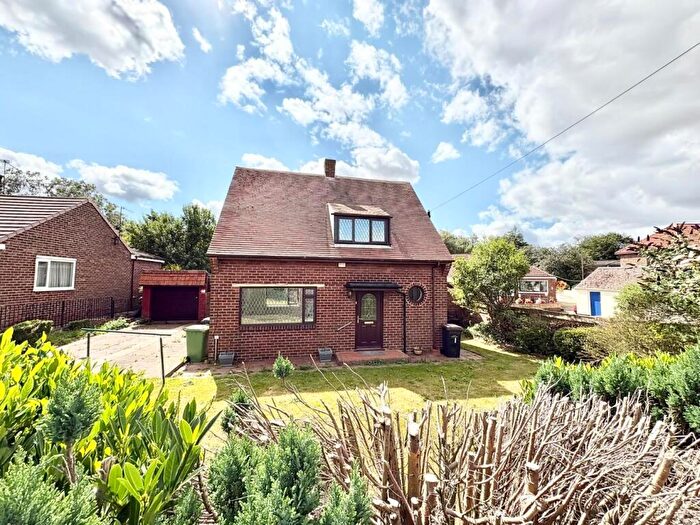
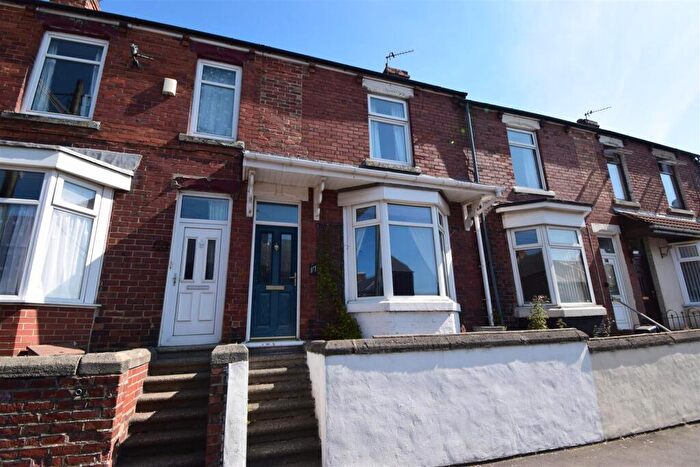
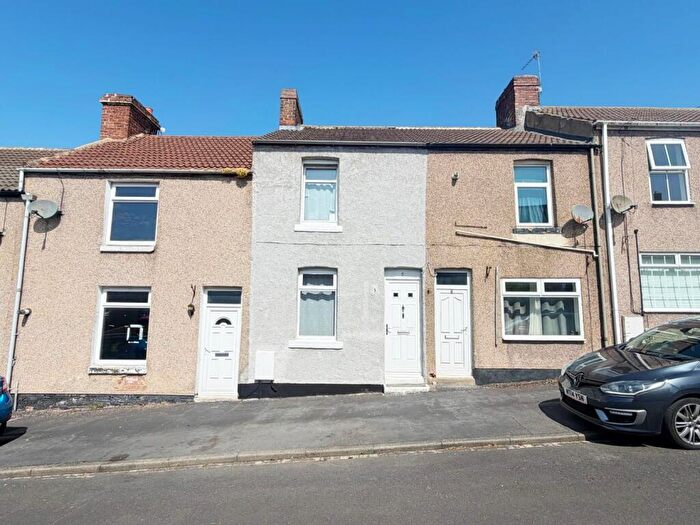

![]()
If you are looking to sell your house, let it out, or receive a property valuation, an expert can help you.
Click the button below to get started.

Roads and Postcodes in Bishop Middleham And Cornforth
Navigate through our locations to find the location of your next house in Bishop Middleham And Cornforth, Durham for sale or to rent.
| Streets | Postcodes |
|---|---|
| Aged Mine Workers War Memorial Homes | DH6 5PA |
| Cornforth Lane | DH6 4ER |
| Thinford Road | DH6 4EU |
| DH6 5NU DH6 5NX DH6 5PB TS21 2BD |
Property price trends in Bishop Middleham And Cornforth
According to the latest Land Registry data, the average home in Bishop Middleham And Cornforth sold for £462,000 in 2021. That figure comes from 9 sales logged over the past 21 years.
Prices have continued to climb over the last three years. Compared with 2017, when the typical sale came in around £340,000, that's a rise of roughly 35.9%.
Looking back five years, average prices are up about 35.9% since 2017, a gain of around £122,000 in cash terms.
Zoom out to the past decade for the fuller picture. Back in 2011, homes here averaged £475,000, so the typical sold price has fallen about 2.7% since then, around 0.3% a year lower. Stretch the view to fifteen years and that annual pace edges up closer to 1.8%.
Frequently asked questions about Bishop Middleham And Cornforth
Which train stations are available in or near Bishop Middleham And Cornforth?
Some of the train stations available in or near Bishop Middleham And Cornforth are Durham, Newton Aycliffe and Bishop Auckland.
Property Price Paid in Bishop Middleham And Cornforth by Year
The average sold property price by year was:
| Year | Average Sold Price | Price Change |
Sold Properties
|
|---|---|---|---|
| 2021 | £462,000 | 26% |
1 Property |
| 2017 | £340,000 | -40% |
1 Property |
| 2011 | £475,000 | 25% |
1 Property |
| 2006 | £355,000 | 11% |
1 Property |
| 2005 | £315,000 | -6% |
1 Property |
| 2004 | £335,000 | 1% |
1 Property |
| 2003 | £333,125 | 65% |
1 Property |
| 2001 | £117,250 | -11% |
1 Property |
| 2000 | £130,000 | - |
1 Property |
