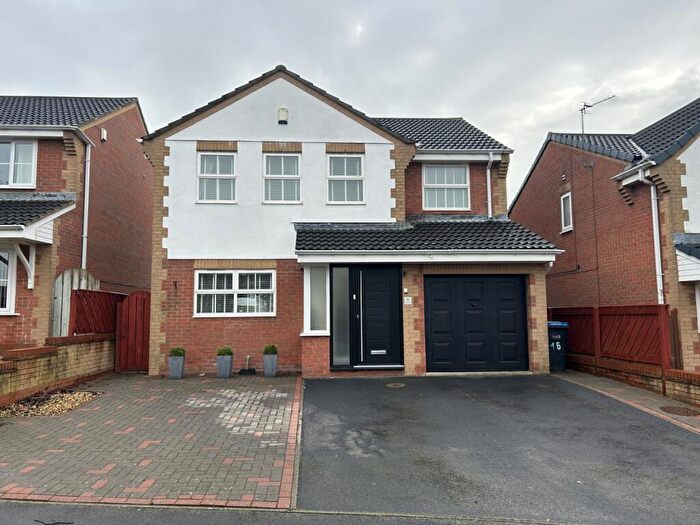
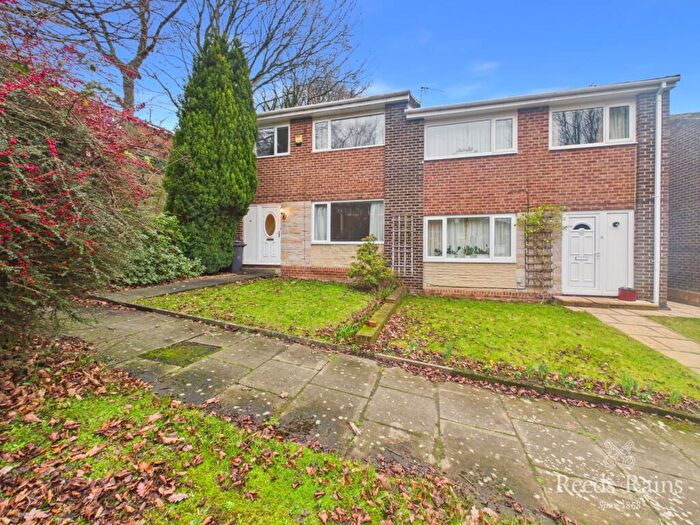
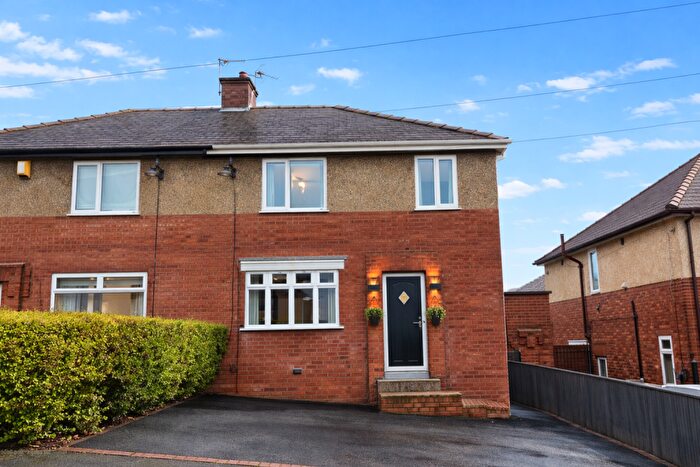
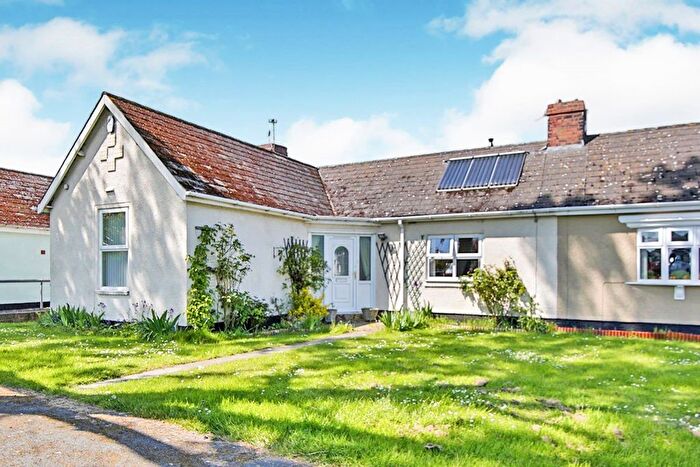
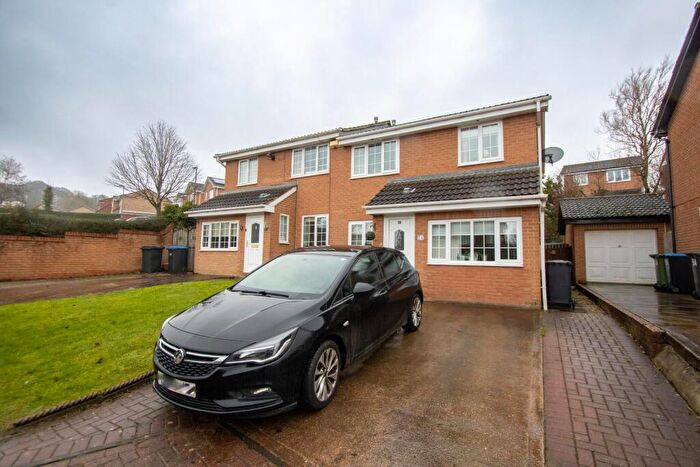
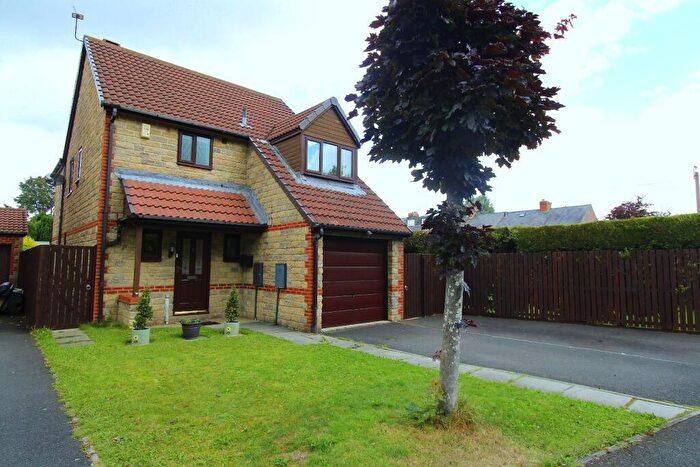
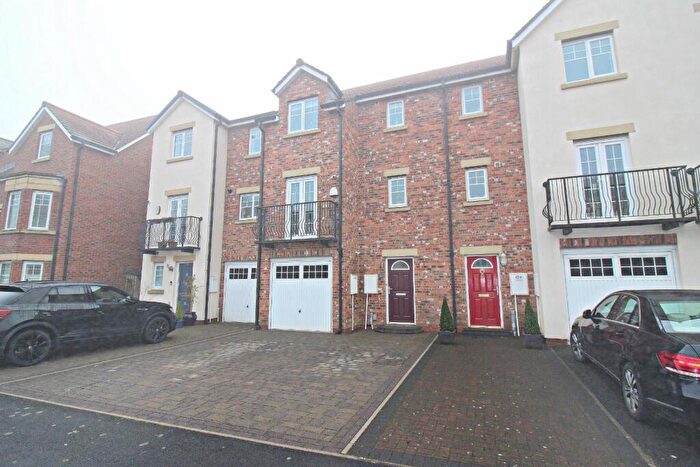
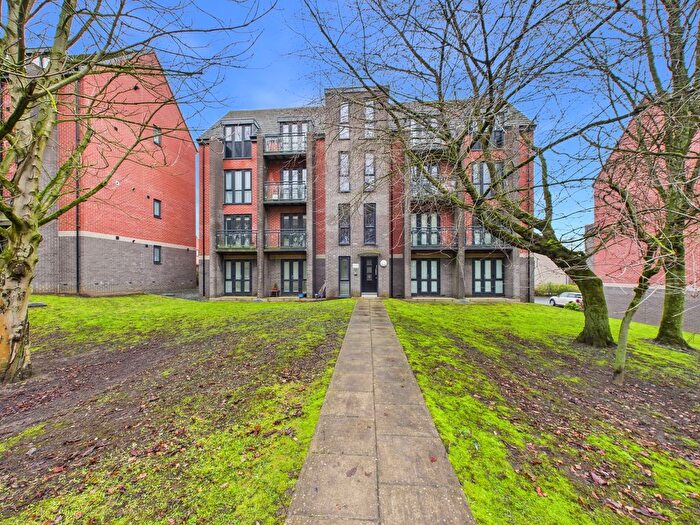
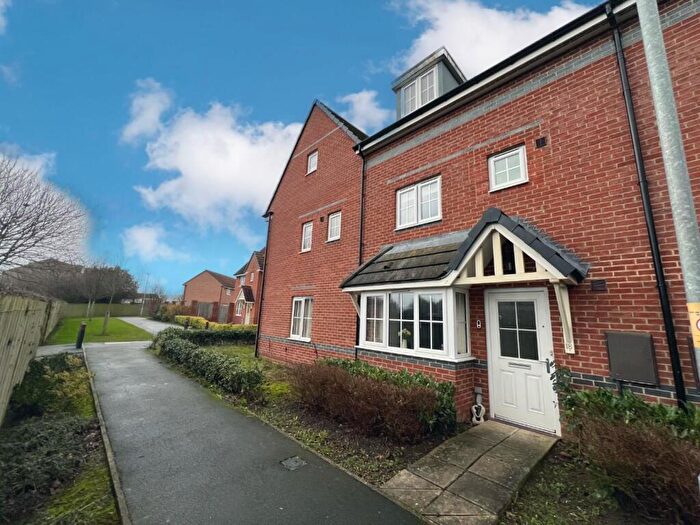
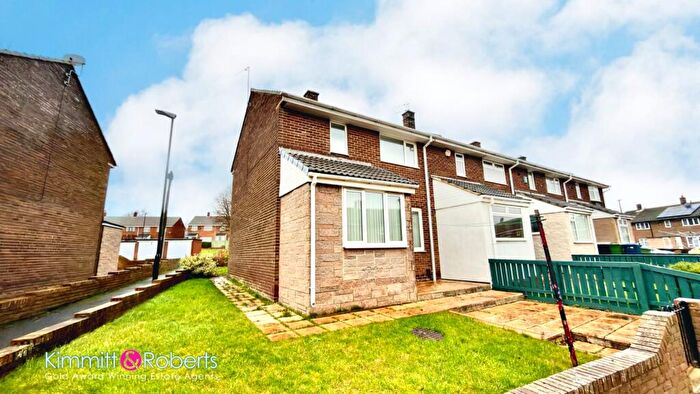
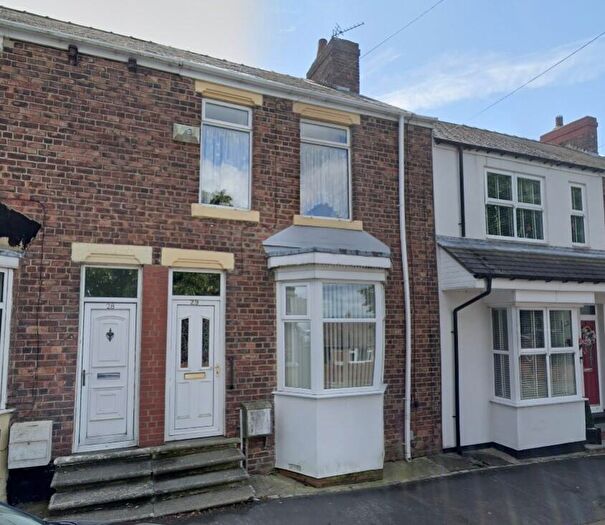
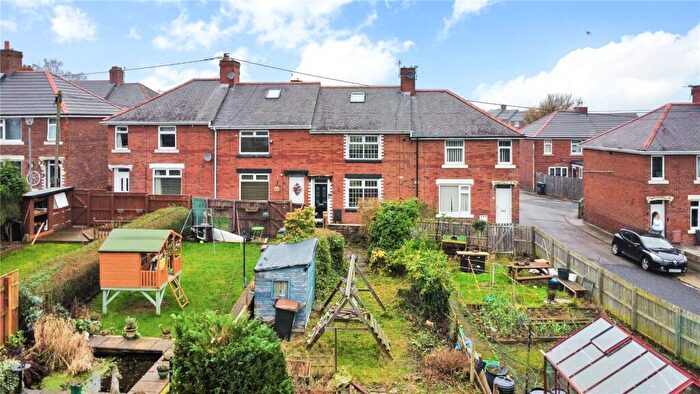
Houses for sale & to rent in Durham, County Durham
House Prices in Durham
Properties in Durham have an average house price of £173,534.00 and had 5,159 Property Transactions within the last 3 years.¹
Durham is an area in County Durham with 51,408 households², where the most expensive property was sold for £1,450,000.00.
Properties for sale in Durham
Neighbourhoods in Durham
Navigate through our locations to find the location of your next house in Durham, County Durham for sale or to rent.
- Belmont
- Bishop Middleham And Cornforth
- Brandon
- Coxhoe
- Deerness
- Durham South
- Elvet And Gilesgate
- Esh And Witton Gilbert
- Ferryhill
- Framwellgate And Newton Hall
- Lanchester
- Nevilles Cross
- Sacriston
- Sherburn
- Shotton And South Hetton
- Trimdon And Thornley
- Tudhoe
- Willington And Hunwick
- Delves Lane
- Leadgate And Medomsley
- Consett South
- Consett North
Transport in Durham
Please see below transportation links in this area:
- FAQ
- Price Paid By Year
- Property Type Price
Frequently asked questions about Durham
What is the average price for a property for sale in Durham?
The average price for a property for sale in Durham is £173,534. This amount is 24% higher than the average price in County Durham. There are more than 10,000 property listings for sale in Durham.
What locations have the most expensive properties for sale in Durham?
The locations with the most expensive properties for sale in Durham are Willington And Hunwick at an average of £488,444, Nevilles Cross at an average of £359,156 and Durham South at an average of £341,768.
What locations have the most affordable properties for sale in Durham?
The locations with the most affordable properties for sale in Durham are Trimdon And Thornley at an average of £103,467, Shotton And South Hetton at an average of £105,147 and Deerness at an average of £125,483.
Which train stations are available in or near Durham?
Some of the train stations available in or near Durham are Durham, Chester-Le-Street and Bishop Auckland.
Property Price Paid in Durham by Year
The average sold property price by year was:
| Year | Average Sold Price | Price Change |
Sold Properties
|
|---|---|---|---|
| 2025 | £177,341 | 0,4% |
1,484 Properties |
| 2024 | £176,646 | 5% |
1,900 Properties |
| 2023 | £167,020 | -3% |
1,775 Properties |
| 2022 | £172,680 | -6% |
2,174 Properties |
| 2021 | £183,221 | 7% |
2,406 Properties |
| 2020 | £170,119 | 4% |
1,850 Properties |
| 2019 | £164,028 | 5% |
2,136 Properties |
| 2018 | £155,704 | -0,2% |
2,001 Properties |
| 2017 | £156,020 | 0,3% |
2,218 Properties |
| 2016 | £155,500 | 3% |
2,040 Properties |
| 2015 | £151,406 | 3% |
1,916 Properties |
| 2014 | £146,361 | 4% |
1,792 Properties |
| 2013 | £140,785 | -3% |
1,499 Properties |
| 2012 | £145,310 | 5% |
1,223 Properties |
| 2011 | £137,772 | -7% |
1,296 Properties |
| 2010 | £147,142 | 5% |
1,276 Properties |
| 2009 | £140,288 | -4% |
1,138 Properties |
| 2008 | £145,767 | 1% |
1,483 Properties |
| 2007 | £144,258 | -4% |
2,769 Properties |
| 2006 | £149,970 | 7% |
2,597 Properties |
| 2005 | £140,095 | 8% |
2,055 Properties |
| 2004 | £128,437 | 21% |
2,344 Properties |
| 2003 | £101,321 | 23% |
2,322 Properties |
| 2002 | £77,941 | 13% |
2,503 Properties |
| 2001 | £67,843 | 5% |
2,303 Properties |
| 2000 | £64,738 | -3% |
2,034 Properties |
| 1999 | £66,644 | 9% |
2,020 Properties |
| 1998 | £60,372 | 4% |
1,955 Properties |
| 1997 | £57,764 | 5% |
1,981 Properties |
| 1996 | £55,027 | -0,2% |
1,740 Properties |
| 1995 | £55,132 | - |
1,443 Properties |
Property Price per Property Type in Durham
Here you can find historic sold price data in order to help with your property search.
The average Property Paid Price for specific property types in the last three years are:
| Property Type | Average Sold Price | Sold Properties |
|---|---|---|
| Semi Detached House | £159,490.00 | 2,041 Semi Detached Houses |
| Terraced House | £131,084.00 | 1,844 Terraced Houses |
| Detached House | £298,125.00 | 943 Detached Houses |
| Flat | £141,675.00 | 331 Flats |

